Friday, June 28, 2013

The Fed Is Now Taking Over The Entire Treasury Market 20 bps Per Week

by Tyler Durden

Yesterday the Fed released its latest balance sheet data: at $3,478,672,000,000, the Fed's assets reached a new all time high of course, up $8 billion from the prior week and up $615 billion from last year - after all with 4 years almost in a row of debt monetization or maturity transformation, either the total holdings or the 10 Year equivalency of Bernanke's hedge fund rise to new record highs week after week.

But that's not the bad news: the bad news, at least for Bernanke, and why the Fed has no choice but to taper is monetizations (however briefly as following the next market crash Bernanke or his replacement Larry "Mr. Burns" Summers will be right back in) is that since the Treasury is about to print less paper (recall: lower budget deficit, if only briefly), and the Fed is monetizing the same relative amount of paper, the Treasurys in the private circulation book get less and less, as more high quality collateral is withdrawn by the Fed.

This is precisely what the Treasury Borrowing Advisory Committee warned against in May. This is also precisely why the Fed's "data-dependent" taper announcement is pure and total hogwash: the Fed knows it can't delay the delay (pardon the pun) of Treasury monetization as doing so only risks even further bond market volatility as less Treasury collateral remains in marketable circulation, and as liquidity evaporates with every incremental dollar purchased by the Fed instead of by the private sector.

So just how bad is the situation? Quite bad. As as of last night, courtesy of SMRA, we know that the amount of ten-year equivalents held by the Fed increased to $1.608 trillion from $1.606 trillion in the prior week, which reduces the amount available to the private sector to $3.603 trillion from $3.636 trillion in the prior week. There were $5.211 trillion ten-year equivalents outstanding, down from $5.242 trillion in the prior week.

After the Treasury issuance, maturing securities, rising interest rates, and Fed operations during the week, the Fed owned about 30.86% of the total outstanding ten year equivalents. This is above the 30.63% from the prior week, and the percentage of ten-year equivalents available to the private sector decreased to 69.14% from 69.37% in the prior week.

In other words, in 1 week the Fed's "take over" of the bond market continued at a brisk pace of 23 bps, which is its average weekly uptake. This is roughly equivalent to 10% of total private collateral moving from private to Fed hands every year!

So basically every year that the Fed does not taper its purchases, Treasury issuance being equal (and it is declining), the Fed removes 10% of high quality collateral from the world's biggest bond market.

And that, in a nutshell, is what Tapering is all about: the realization, and then the fear, of what happens if and when the Fed continues its monetizations of public debt to the point where there is so little left, that when a trade takes place the entire curve moves by 1%, 2%, 5%, 10% or more....

Everything else is smoke and mirrors.

See the original article >>

Bonds & Stocks: Investors Continue To Make The Same Mistakes

by Lance Roberts

On June 21st, in the midst of a bond market meltdown I wrote an article entitled "5 Reasons Why Now Is The Time To Buy Bonds."  In that article I stated:

"For all of these reasons I am bullish on the bond market through the end of this year. Furthermore, with market volatility rising, economic weakness creeping in and plenty of catalysts to send stocks lower - bonds will continue to hedge long only portfolios against meaningful market declines while providing an income stream.

Will the 'bond bull' market eventually come to an end? Yes, it will, eventually. However, the catalysts needed to create the type of economic growth required to drive interest rates substantially higher, as we saw previous to the 1980's, are simply not available currently. This will likely be the case for many years to come as the Fed, and the administration, come to the inevitable conclusion that we are now in a "liquidity trap" along with the bulk of developed countries. While there is certainly not a tremendous amount of downside left for interest rates to fall in the current environment - there is also not a tremendous amount of room for them to rise until they begin to negatively impact consumption, housing and investment. It is likely that we will remain trapped within the current trading range for quite a while longer as the economy continues to 'muddle' along."

At that particular time bonds were being bashed by the mainstream media, analysts and economists alike.  However, from a contrarian viewpoint, isn't this exactly what we want to see to denote a "buying" opportunity?  Isn't our number one job as investors to "buy low" and "sell high?"  If so, the plunge in bond prices in month of June was certainly one of those rare opportunities to scoop up quality corporate and municipal credits at bargin prices. 

Not surprisingly, over the past couple of days, there has risen an affirmation of my viewpoint on bonds from both the media and investment heavyweights alike.

June 27th:  CNBC:  Jeff Gundlach Now Sees Bargains In Credit Markets

"Bond king Jeff Gundlach says the selling wave that roiled credit markets in May and June has come to an end.

'The liquidation cycle appears to have run its course with emerging market bonds, U.S. junk bonds, munis and MBS—all of which substantially underperformed Treasurys during the rate rise—now recovering sharply,' he told CNBC's Scott Wapner.

Gundlach, the founder of DoubleLine and co-manager of the $39.4 billion DoubleLine Total Return Bond Fund, told Wapner in an email that 'the 200-basis-point-yield rise on certain sectors brought absolute yields up to levels high enough to create a compelling value proposition.'

'Not surprisingly, investors have been drawn to these values leading to interest rate stabilization,' he added."

June 26th:  David Kotok - Cumberland Advisors

"At Cumberland, we have lengthened duration while moving to the buy side. We are buying where we can and altering accounts and mixes of accounts as we can. We are taking advantage of this very opportunistic time."

June 27th:  Bill Gross: Current Bond Sell-Off Overdone

"Don’t jump ship now. We may have reached an inflection point of low Treasury, mortgage and corporate yields in late April, but this is overdone. Will there be smooth sailing tomorrow? 'Red sky at night, sailors delight?' Hardly. Will you be able to replicate annualized returns in bonds and stocks for the past 20–30 years? Hardly. Expect 3–5% for both. But sailors, don’t panic."

Well, you get the idea.

As I stated previously the sell-off in rates have pushed yields to very overbought conditions in the short term.  As with all things, nothing goes straight up, or down, and huge divergences from long term means have historically provided opportunistic buying and selling opportunities.  Take a look at the chart I posted previously:

Interest-Rate-Overbought-062113

The chart above shows a weekly chart of interest as compared to its long term moving average. Currently, at more than 3-standard deviations overbought, the level of interest rates is unsustainable and a correction is in order. In the chart I have noted (vertical blue lines) every time that the 10-year interest rate has touched 3-standard deviations above the long term mean. In every single case, over the last 10-years, that was the absolute peak of the move higher. It is unlikely to be "different this time."

The reality is that our job as investors is to look for things that have gotten "out of whack" and creates buying or selling opportunities.  However, if you listen to the mainstream analysis these extremes are never paid attention to and ultimately leads to investor sorrow.  Bonds play a critical role in lowering risk in portfolios designed for long term returns.  With return of capital and income components - bonds not only enchance long term returns but lower volatility which leads to fewer emotional mistakes.

The Opposite End Of Extreme

The same analysis can be applied to the stock market for risk analysis purposes.  A couple of days before the latest FOMC announcement that sent stocks plunging I wrote an article entitled "3 Reasons Why Stocks May Tumble Despite Fed" wherein I stated:

"There is one truth about the markets, despite Federal Reserve interventions, that remains true: 'Stocks do not go in a straight line.'

During unfaltering advances in the market investors begin to migrate towards the belief that the stock market will continue its current trajectory indefinitely into the future. This is particularly true near market tops when almost every pundit, analysts and investor is touting why now is the time to 'jump in'. Of course, history is replete with examples of the disaster that followed such advice.

As we discussed at length in our recent weekly missive 'An Initial Sell Signal Approaches' prices can only move so far away from their long term average before 'gravity' sucks prices back. The chart below shows the S&P Index on a weekly basis (which smooths out day to day volatility) with a set of Bollinger bands representing 3-standard deviations from the mean."

S&P-500-50WMA-Deviation-061913

The point to be made here is that for longer term investors who are managing their "retirement savings" - the analysis of market extremes can help protect portfolios from unexpectedly sharp declines and the identification of low risk buying opportunities.  Furthermore, such analysis can help investors reduce the common syndromes of "buying high" and "selling low" which is the complete antithesis of what investors should be doing. 

It was interesting last week when Josh Brown wrote an article entitled:  "So, Who Bought The Dip" in which he discussed that while hedge funds were selling "Mom and Pop Investors" were buying.  Of course, this is exactly what you would expect to be happening.  The chart below shows mutual fund inflows for investors.

ICI-Cumulative-Equity-Bond-062813

As you can see individuals have a strong tendency to "buy" market tops and "sell" market bottoms as the mainstream analysis drives them to make emotional investment mistakes rather than logical allocation changes.  During the month of May, as interest rates started their parabolic rise, individuals plowed $18.3 billion into bond funds but only $3.3 billion into equity funds.  Only three weeks of the June data currently compiled, which is subject to big revisions, which shows that as the interest rate surge hit its peak individuals yanked out an astounding $32.3 billion from bond funds and just $96 million from equity funds.  Both of these numbers will be revised higher over the next couple of months with equity inflows likely turning positive.

The data clearly supports the overall premise.  Investors are panic selling what is likely an intermediate term bottom in bond prices and holding onto to equities in what is clearly one of the most overbought, valued and extended markets since 2000 or 2007.   While the mainstream market analysis continues to tout "buy and hold" strategies - statistical evidence clearly weighs in favor of a rather significant correction at some point in the not so distant future.  While timing of such an event is difficult at best, given the extreme amounts of artificial intervention by Central Banks globally, the impact to investors portfolios devastate retirement plans.

The biggest problem currently is that there is virtually no expectation, or analysis that incorporates the impact, of an average economic recession ever occurring again.  Since business cycle recessions have occurred with regularity throughout history; it is somewhat naive to expect that the current market trajectory will continue when we are already 48 months into the current economic expansion. The chart below, as discussed in "No Recession Now But When" shows the history of U.S. recessions and their respective impact on the financial markets (note: the analysis uses monthly closing data points)

Recessions-SP500-returns-110612

What is important for investors is an understanding that, despite claims to the contrary, a recession will occur in the future. It is simply a function of time. These recessionary drags inflict lasting damage to investment portfolios over time. The table above shows the start and finish dates, prior peak, and peak to trough price declines during previous recessionary periods. The average draw down for all recessionary periods was 30.76% with an average recovery period of 43 months. For someone close to, or in retirement, this can be devastating.

After two recessions so far in this century, which coincided with very sharp market declines, investor's portfolios have yet to recover on an inflation adjusted basis. Furthermore, and most importantly, with a large segment of the investing population heading into retirement in coming years, the demand for income, over capital appreciation, will weigh more heavily on future market growth. Many individuals are now realizing their own mortality and the critical importance of "time" as an investment variable.  We simply don't live forever.

While the economy is currently not in a recession - the negative trends in the economic and earnings data certainly require monitoring. With very low lead times between non-recession and recessionary states it is very easy to get swept up in the mean reversion process as forward expectations are realigned with current earnings and economic growth trends. With a market that is driven more than ever by momentum, low volume and high-frequency trading - this reversion processes will continue to swift, and brutal, leaving investors little time to react to market changes. This time is NOT "different" - a recession will reassert itself at some point.

What is important is whether you, and your portfolio, are prepared to deal with it.  Bonds are currently exhibiting some of the best valuations that we have seen in the last couple of years with the technical indicators stretched to extremes.  Exactly the opposite is true with the stock market with valuations (based on trailing reported earnings - the only true measure of valuations) pushing levels normally associated with bull market peaks, prices at extreme extensions and earnings peaking.  This is the time when investors should be thinking about taking some profits by "selling stocks high" and adding some relative safety by "buying bonds low".  After all - it is what we are supposed to be doing as long term investors.

See the original article >>

We’ve Passed #1, On In #2… Next Up Comes the Big Drop

by Graham Summers

Today should be the peak of end of the quarter performance gaming.

Stocks have rallied hard for three days. The financial media has seen this as indicating the worst is over. But the fact of the matter is that most of this is performance gaming aided by various Fed officials issue verbal interventions yesterday.

As I’ve noted to Private Wealth Advisory subscribers, there’s a historical pattern here: stocks tend to lead summer rallies into the Fourth of July. With that in mind, the technical pattern we noted earlier this morning remains in play with the S&P 500 rallying to retest support.

As noted on Wednesday, market collapses follow a particular pattern:

1)   The initial drop breaking support

2)   Bouncing to re-test support

3)   The larger drop

As noted on Wednesday, the S&P 500 has completed #1 and is now in #2. I expect the markets will hold up into next week. But at that point we’ll be primed for a serious collapse.

See the original article >>

Record Bond Fund Redemptions Echo Capitulation Lows In 2008

by Tyler Durden

Bond Funds saw a a massive $23bn of redepmtions in the latest week - a record in absolute terms. The outflows were across every segment of the fixed income market and are second only (in %of AUM) to the capitulative collapse that occurred after the October 2008 plunges (after which Treasuries rallied 5% in 6 weeks). The past 4 weeks have seen an unprecedented $58bn of outflows. All of this is providiung fodder for the mainstream media (and several hopeful strategists) that the great rotation 'must' have started. However, as BofAML notes, there were $13.1 billion of outflows from equity funds (including $6.7 billion from pure long-only funds) - the most since late April. It appears the money that has been 'rotated' into stocks from money-market funds has merely reverted back into these safe-havens - another reason why the powers that be would like to drastically reduce the access to these liquidity-sapping investment vehicles to keep the sheep in risk assets.

Bond Redemption hit a record hit (in absolute terms) and 2nd largest ever in AUM terms...

This was also a record week for Global HY outflows helped by the -$3.7bn outflows from non-US domiciled funds, their highest so far. US IG funds posted their highest dollar outflow on record (highest percentage outflow since 2009), coming in at -$5bn, which eroded 0.7% from their AUM.

Loans and Money Market funds were the only two asset classes reporting inflows, coming in at +$1bn and +$5.5bn respectively.

See the original article >>

Great Graphic: World GDP

by Marc to Market

This Great Graphic comes from The Economist.  It depicts world GDP on a year-over year basis for the world, high income countries, the BRICS and other emerging markets. 

The Economist estimates that world growth slowed to a 2.1% pace in Q1 13, down a full percentage point from Q1 12.    The high incomes countries are barely growing net-net.  Europe is largely in recession.  US growth in Q1 has been revised lower.  The prospects for Q2 look poor..  US growth has not improved, though the euro zone contraction may have eased, it is still appears to be contracting.    Japanese growth is likely to lead again, with both exports and domestic consumption continuing to recover. 

Emerging market often grow faster than the high income countries, though it does not always lead to superior asset returns.  The BRICS have slowed, as have other emerging markets.  The sharp rise in global interest rates starting in late-May will not help matters.  The increase in interest rates is not a reflection of greater demand for capital due to increased activity.  Rather the rise in rates reflects portfolio adjustments in response to the tapering talk the US (less stimulus is not the same thing as no stimulus), continued selling of foreign assets by Japanese investors, and the liquidity squeeze in China. 

With the Fed officials trying to help the market understood the meaning of its forward guidance and the acute phase of the Chinese squeeze being alleviated, rates ease and stabilize.  There remains a reasonable chance that global growth picks up late Q3 or early Q4. 

See the original article >>

Joe Friday-”Emotipoints” converging here as margin debt records hit!

by Chris Kimble

CLICK ON CHART TO ENLARGE

Does the 1982, 2002, 2003 closing lows and the 1987, 1999 and 2007 closing highs have something in common?  Yes!

They are emotional extremes, Key highs and lows in the Dow since President Reagan was in office.

Joe Friday....The "Emotipoints" converge in the Dow at (1) in the chart above.

The convergence of "Emotipoints" suggest this resistance is pretty strong in the Dow at the same time Margin Debt is near record levels and net cash available is near record lows!

CLICK ON CHART TO ENLARGE

See the original article >>

Cocoa falls as weather proves cooperative for harvest

By Jack Scoville

COCOA 

General Comments: Futures closed lower on ideas of good harvest weather and active movement of beans to ports in western Africa. Some are worried about dry weather developing in western Africa right now and there is a lot of smog in Southeast Asia, but these fears seem to be passing. Ideas of weak demand after the recent big rally kept some selling interest around. The weather is good in West Africa, with more moderate temperatures and some rains. It is hotter and drier again in Ivory Coast this week, but the rest of the region is in good condition. The mid crop harvest is about over, and less than expected production along with smaller beans is reported. Malaysia and Indonesia crops appear to be in good condition and weather is called favorable.

Overnight News: Scattered showers are expected in West Africa. Temperatures will average near to above normal. Malaysia and Indonesia should see episodes of isolated showers. Temperatures should average near normal. Brazil will get mostly dry conditions and warm temperatures. ICE certified stocks are lower today at 4.984 million bags. ICE said that 29 delivery notices were posted today and that total deliveries for the month are 234 contracts. LIFFE stocks are 7,372 standard delivery units, 143 large delivery units, and 4 bulk delivery units.

Chart Trends: Trends in New York are mixed to down with no objectives. Support is at 2140, 2105, and 2080 September, with resistance at 2200, 2230, and 2250 September. Trends in London are mixed to down with objectives of 1380 and 1270 September. Support is at 1440, 1420, and 1360 September, with resistance at 1470, 1490, and 1520 SeptemberCOTTON

General Comments: Futures were higher on preparations before the USDA reports that come out today. Some speculative buying appeared due to end of the month and end of the quarter position liquidation. The export sales report showed weak demand and was no reason to buy futures. Ideas of better production conditions in the US caused some selling interest. USDA showed that conditions in some areas got better while conditions in other areas got worse and this supported markets. Texas is reporting dry weather again. Dry weather is being reported in the Delta and Southeast as well. The weather should help support crop development in the Delta and Southeast, and could help in Texas as some areas of the state saw good rains last week. Weather for Cotton appears good in India, Pakistan, and China.

Overnight News: The Delta should be dry and Southeast will see some light showers through this weekend and bigger rains next week. Temperatures will average near to above normal this weekend and near to below normal next week. Texas will get dry weather today and tomorrow, then a few showers early next week. Temperatures will average above to much above normal today, but near to below normal early next week. The USDA spot price is now 81.77 ct/lb. ICE said that certified Cotton stocks are now 0.612 million bales, from 0.596 million yesterday. ICE said that 96 notices were posted today and that total deliveries are now 1,522 contracts.

Chart Trends: Trends in Cotton are mixed to down with no objectives. Support is at 85.10, 84.00, and 82.80 October, with resistance of 86.40, 86.90, and 88.00 October.

FCOJ

General Comments: Futures closed a little higher in recovery trading. Prices have fallen a lot this week and some kind of correction was to be expected before the end of the week. Better weather in Florida seems to be the big problem for the bulls at this time, but maybe the better weather is now finally part of the price structure. Futures have been working generally lower as showers have been seen and conditions are said to have improved in almost the entire state. Ideas are that the better precipitation will help trees fight the greening disease. No tropical storms are in view to cause any potential damage. Greening disease and what it might mean to production prospects continues to be a primary support item and will be for several years. Temperatures are warm in the state, but there are showers reported. The Valencia harvest is continuing but is almost over. Brazil is seeing near to above normal temperatures and mostly dry weather, but showers are possible next week.

Overnight News: Florida weather forecasts call for showers. Temperatures will average near to above normal.

Chart Trends: Trends in FCOJ are down with no objectives. Support is at 125.00, 122.50, and 121.50 September, with resistance at 130.00, 131.50, and 132.50 September.

COFFEE

General Comments: Futures were higher on speculative short covering before the end of the month and the end of the quarter and some reports of roaster buying. The production is big, but the cash market remains very quiet. However, roasters are showing more buying interest tan they have in months. Sellers, including Brazil, are quiet and are waiting for futures to move higher. Buyers are interested on cheap differentials, and might start to force the issue if prices hold and start to move higher in the short term on ideas that the market made a bottom. Brazil weather is forecast to show dry conditions, but no cold weather. There are some forecasts for cold weather to develop in Brazil early next week, but so far the market is not concerned. Current crop development is still good this year in Brazil. Central America crops are seeing good rains now. Colombia is reported to have good conditions.

Overnight News: Certified stocks are higher today and are about 2.750 million bags. The ICO composite price is now 115.74 ct/lb. Brazil should get dry weather except for some showers in the southwest. All areas could get showers early next week. Temperatures will average near to above normal. Colombia should get scattered showers, and Central America and Mexico should get showers, with some big rains possible in central and southern Mexico and northern Central America. Temperatures should average near to above normal. ICE said that 40 delivery notices was posted against July today and that total deliveries for the month are now 769 contracts. LIFFE stocks are now 12,114 lots.

Chart Trends: Trends in New York are down with no objectives. Support is at 117.00, 116.00, and 113.00 September, and resistance is at 123.50, 125.00, and 126.00 September. Trends in London are mixed. Support is at 1720, 1705, and 1680 September, and resistance is at 1765, 1775, and 1800 September. Trends in Sao Paulo are down with no objectives. Support is at 140.00, 137.00, and 134.00 September, and resistance is at 148.00, 151.00, and 155.00 September.

SUGAR 

General Comments: Futures closed sharply lower in response to data from UNICA earlier in the week that showed ample supplies. Some liquidation trading was seen in July contracts. July goes off the Board on Friday. There is still talk that a low is forming or has formed for at least the short term, but there is still a lot of Sugar around, and not only from Brazil. The Indian monsoon is off to a good start and this should help with Sugarcane production in the country. But, everyone is more interested in Brazil and what the Sugar market is doing there. Traders remain bearish on ideas of big supplies, especially from Brazil. Traders in Brazil expect big production to continue as the weather is good.

Overnight News: Showers are expected in Brazil, mostly in the south and southwest. Temperatures should average near to above normal.

Chart Trends: Trends in New York are mixed. Support is at 1685, 1665, and 1650 October, and resistance is at 1715, 1750, and 1760 October. Trends in London are mixed to up with objectives of 495.00 October. Support is at 484.00, 478.00, and 475.00 October, and resistance is at 496.00, 499.00, and 503.00 October.

See the original article >>

Global Growth Will Be Down

By tothetick

Global economic growth has been downgraded today in a new forecast that has just been published by HSBC. According to analysts at HSBC, the forecast has been brought lower due to Federal Reserve decisions to cut Quantitative Easing coupled with the slowdown in growth being experienced notably by China, but also by other emerging countries such as India.

Forecasts for world growth stood at 2.2% for 2013 and now they have been lowered by 0.2%. Predictions for 2014 have also been reduced to 2.6%.

Growth: China

Growth: China

China’s GDP growth forecast was slashed from 8.2% to 7.4% for 2013 and the forecast for 2014 suffered the same treatment being reduced from 8.4% to 7.4%. However, the People’s Bank of China made a statement which showed that they were looking for quality growth rather than just quantity recently. The target is still below that which has been suggested by the People’s Bank of China, standing at 7.5%. Analysts believe that China will not be able to reach this objective for growth this year.

HSBC stated:  "While dominated by the reduction in our forecasts for China, the new numbers also reflect further sizable reductions in our projections for Brazil and India, among others. They are consistent with the idea that, even allowing for the emerging nations' obvious long-term growth advantages, there is no easy escape from deteriorating near-term economic fundamentals”.

Growth: India

Growth: India

India’s growth forecast was reduced recently by HSBC, being cut from 6% to 5.5%. The reason that was given was the slowdown in reforms that are taking place there. Key reforms will however be voted this July and August. In particular, there will be the land-acquisition bill and the pension and insurance bills that are likely to go through. However, there are fears in India by many that the land-acquisition bill will lead to land prices shooting through the roof, thus only enabling speculators to reap the benefits and at the same time adversely affecting competitiveness with regard to agricultural produce. The only way round that, according to some in India, is to prefer leasing rather than acquisition of land. But the pension bill is also marred with controversy as the government may have to end up footing the entire weight of the minimum pension that is being put forward in the bill in order to win over the trade unions. If that happens, then growth will be undermined.

Brazil has also seen its growth forecast reduced to 2.4% by HSBC for 2013 and the 2014 prediction stands at slightly higher at 3%.

Growth: Brazil

Growth: Brazil

Capital Economics also published research which showed that emerging markets were at their slowest rate of growth since 2008. Although, it did also suggest that Quantitative-Easing tapering would have little effect on what was going on in those countries economically-speaking. This was due to the fact that emerging markets were about as dependent on external financing as they were back in 2008 at the start of the financial crisis. The report stated: “As such, the majority should be able to withstand a reversal of capital inflows associated with a tightening of global monetary conditions”.  Others are arguing that it is the Quantitative Easing that has enabled those economies too to remain in the positions that they are in. Average growth in Latin America, emerging Asia and Europe slowed to 4% during the first quarter of 2013. That is lower than the average figure for the past ten years, which stands at 6.4%. There could be an improvement in that in this second quarter, however.  But, that means that emerging markets will also be slowing down, it will be hard to find where the impetus might come from to boost the rest of the world.

The question that is worrying analysts today is whether or not that slowdown will also spill over from emerging markets into the rest of the world. If it does, then it looks like there is a tough time ahead. Or, perhaps the Federal Reserve will just carry on printing to save us all from that!

See the original article >>

Fed's Jeremy Stein Full Speech In Which A "Hypothetical" September Taper Is Announced

by Tyler Durden

The first of three Fed speeches is out, and as expected, it contains nothing new save for the ongoing barage of stock market battering for daring to sell on last week's Bernanke warnings that the Fed's monthly flow is set to begin tapering in September. It continues to be as if the Fed is shocked to learn that nothing else matters in this "economy" and, of course, "market" than what the Fed will do and say.

Here is the highlight paragraph:

... it often doesn't make sense to try to explain a large movement in asset prices by looking for a correspondingly large change in expectations about economic fundamentals. So while we have seen very significant increases in long-term Treasury yields since the FOMC meeting, I think it is a mistake to infer from these movements that there must have been an equivalently big change in monetary policy fundamentals. Nothing we have said suggests a change in our reaction function for the path of the short-term policy rate, and my sense is that our sharpened guidance on the duration of the asset purchase program also leaves us close to where market expectations--as expressed, for example, in various surveys that we monitor--were beforehand.

And here is why futures are now sliding - nothing quite like a hypothetical assumption in a Fed governor speech:

Both in an effort to make reliable judgments about the state of the economy, as well as to reduce the possibility of an undesirable feedback loop, the best approach is for the Committee to be clear that in making a decision in, say, September, it will give primary weight to the large stock of news that has accumulated since the inception of the program and will not be unduly influenced by whatever data releases arrive in the few weeks before the meeting--as salient as these releases may appear to be to market participants. I should emphasize that this would not mean abandoning the premise that the program as a whole should be both data-dependent and forward looking.

Expect similar speeched from the other two Fed members due out later today.

Full speech:

Comments on Monetary Policy

Thank you very much. It's a pleasure for me to be here at the Council on Foreign Relations, and I look forward to our conversation. To get things going, I thought I would start with some brief remarks on the current state of play in monetary policy. As you know, at the Federal Open Market Committee (FOMC) meeting last week, we opted to keep our asset purchase program running at the rate of $85 billion per month. But there has been much discussion about recent changes in our communication, both in the formal FOMC statement, as well as in Chairman Bernanke's post-meeting press conference. I'd like to offer my take on these changes, as well as my thoughts on where we might go from here. But before doing so, let me note that I am speaking for myself, and that my views are not necessarily shared by my colleagues on the FOMC.

It's useful to start by discussing the initial design and conception of this round of asset purchases. Two features of the program are noteworthy. The first is its flow-based, state-contingent nature--the notion that we intend to continue with purchases until the outlook for the labor market has improved substantially in a context of price stability. The second is the fact that--in contrast to our forward guidance for the federal funds rate--we chose at the outset of the program not to articulate what "substantial improvement" means with a specific numerical threshold. So while the program is meant to be data-dependent, we did not spell out the nature of this data-dependence in a formulaic way.

To be clear, I think that this choice made a lot of sense, particularly at the outset of the program. Back in September it would have been hard to predict how long it might take to reach any fixed labor market milestone, and hence how large a balance sheet we would have accumulated along the way to that milestone. Given the uncertainty regarding the costs of an expanding balance sheet, it seemed prudent to preserve some flexibility. Of course, the flip side of this flexibility is that it entailed providing less- concrete information to market participants about our reaction function for asset purchases.

Where do we stand now, nine months into the program? With respect to the economic fundamentals, both the current state of the labor market, as well as the outlook, have improved since September 2012. Back then, the unemployment rate was 8.1percent and nonfarm payrolls were reported to have increased at a monthly rate of 97,000 over the prior six months; today, those figures are 7.6 percent and 194,000, respectively. Back then, FOMC participants were forecasting unemployment rates around 7-3/4 percent and 7 percent for year-end 2013 and 2014, respectively, in our Summary of Economic Projections; as of the June 2013 round, these forecasts have been revised down roughly 1/2 percentage point each. While it is difficult to determine precisely, I believe that our asset purchases since September have supported this improvement. For example, some of the brightest spots in recent months have been sectors that traditionally respond to monetary accommodation, such as housing and autos. Although asset purchases also bring with them various costs and risks--and I have been particularly concerned about risks relating to financial stability--thus far I would judge that they have passed the cost-benefit test.

However, this very progress has brought communications challenges to the fore, since the further down the road we get, the more information the market demands about the conditions that would lead us to reduce and eventually end our purchases. This imperative for clarity provides the backdrop against which our current messaging should be interpreted. In particular, I view Chairman Bernanke's remarks at his press conference--in which he suggested that if the economy progresses generally as we anticipate then the asset purchase program might be expected to wrap up when unemployment falls to the 7 percent range--as an effort to put more specificity around the heretofore less well-defined notion of "substantial progress."

It is important to stress that this added clarity is not a statement of unconditional optimism, nor does it represent a departure from the basic data-dependent philosophy of the asset purchase program. Rather, it involves a subtler change in how data-dependence is implemented--a greater willingness to spell out what the Committee is looking for, as opposed to a "we'll know it when we see it" approach. As time passes and we make progress toward our objectives, the balance of the tradeoff between flexibility and specificity in articulating these objectives shifts. It would have been difficult for the Committee to put forward a 7 percent unemployment goal when the current program started and unemployment was 8.1 percent; this would have involved a lot of uncertainty about the magnitude of asset purchases required to reach this goal. However, as we get closer to our goals, the balance sheet uncertainty becomes more manageable--at the same time that the market's demand for specificity goes up.

In addition to guidance about the ultimate completion of the program, market participants are also eager to know about the conditions that will govern interim adjustments to the pace of purchases. Here too, it makes sense for decisions to be data-dependent. However, a key point is that as we approach an FOMC meeting where an adjustment decision looms, it is appropriate to give relatively heavy weight to the accumulated stock of progress toward our labor market objective and to not be excessively sensitive to the sort of near-term momentum captured by, for example, the last payroll number that comes in just before the meeting.

In part, this principle just reflects sound statistical inference--one doesn't want to put too much weight on one or two noisy observations. But there is more to it than that. Not only do FOMC actions shape market expectations, but the converse is true as well: Market expectations influence FOMC actions. It is difficult for the Committee to take an action at any meeting that is wholly unanticipated because we don't want to create undue market volatility. However, when there is a two-way feedback between financial conditions and FOMC actions, an initial perception that noisy recent data play a central role in the policy process can become somewhat self-fulfilling and can itself be the cause of extraneous volatility in asset prices.

Thus both in an effort to make reliable judgments about the state of the economy, as well as to reduce the possibility of an undesirable feedback loop, the best approach is for the Committee to be clear that in making a decision in, say, September, it will give primary weight to the large stock of news that has accumulated since the inception of the program and will not be unduly influenced by whatever data releases arrive in the few weeks before the meeting--as salient as these releases may appear to be to market participants. I should emphasize that this would not mean abandoning the premise that the program as a whole should be both data-dependent and forward looking. Even if a data release from early September does not exert a strong influence on the decision to make an adjustment at the September meeting, that release will remain relevant for future decisions. If the news is bad, and it is confirmed by further bad news in October and November, this would suggest that the 7 percent unemployment goal is likely to be further away, and the remainder of the program would be extended accordingly.

In sum, I believe that effective communication for us at this stage involves the following key principles: (1) reaffirming the data-dependence of the asset purchase program, (2) giving more clarity on the type of data that will determine the endpoint of the program, as the Chairman did in his discussion of the unemployment goal, and (3) basing interim adjustments to the pace of purchases at any meeting primarily on the accumulated progress toward our goals and not overemphasizing the most recent momentum in the data.

I have been focusing thus far on our efforts to enhance communications about asset purchases. With respect to our guidance on the path of the federal funds rate, we have had explicit links to economic outcomes since last December, and we reaffirmed this guidance at our most recent meeting. Specifically, we continue to have a 6.5 percent unemployment threshold for beginning to consider a first increase in the federal funds rate. As we have emphasized, the threshold nature of this forward guidance embodies further flexibility to react to incoming data. If, for example, inflation readings continue to be on the soft side, we will have greater scope for keeping the funds rate at its effective lower bound even beyond the point when unemployment drops below 6.5percent.

Of course, there are limits to how much even good communication can do to limit market volatility, especially at times like these. At best, we can help market participants to understand how we will make decisions about the policy fundamentals that the FOMC controls--the path of future short-term policy rates and the total stock of long-term securities that we ultimately plan to accumulate via our asset purchases. Yet as research has repeatedly demonstrated, these sorts of fundamentals only explain a small part of the variation in the prices of assets such as equities, long-term Treasury securities, and corporate bonds. The bulk of the variation comes from what finance academics call "changes in discount rates," which is a fancy way of saying the non-fundamental stuff that we don't understand very well--and which can include changes in either investor sentiment or risk aversion, price movements due to forced selling by either levered investors or convexity hedgers, and a variety of other effects that fall under the broad heading of internal market dynamics.

This observation reminds us that it often doesn't make sense to try to explain a large movement in asset prices by looking for a correspondingly large change in expectations about economic fundamentals. So while we have seen very significant increases in long-term Treasury yields since the FOMC meeting, I think it is a mistake to infer from these movements that there must have been an equivalently big change in monetary policy fundamentals. Nothing we have said suggests a change in our reaction function for the path of the short-term policy rate, and my sense is that our sharpened guidance on the duration of the asset purchase program also leaves us close to where market expectations--as expressed, for example, in various surveys that we monitor--were beforehand.

I don't in any way mean to say that the large market movements that we have seen in the past couple of weeks are inconsequential or can be dismissed as mere noise. To the contrary, they potentially have much to teach us about the dynamics of financial markets and how these dynamics are influenced by changes in our communications strategy. My only point is that consumers and businesses who look to asset prices for clues about the future stance of monetary policy should take care not to over-interpret these movements. We have attempted in recent weeks to provide more clarity about the nature of our policy reaction function, but I view the fundamentals of our underlying policy stance as broadly unchanged.

Thank you. I look forward to your questions

See the original article >>

Time Is Running Short

by Mark J. Grant

"It is only in silence that one hears the sounds of life."
                       -The Wizard
From time to time it is necessary to quietly sit down and assess where we are going. This is a significantly different undertaking than listening to those who try to tell us where we are going. Government and the Pastors of Propaganda are always whispering into our ears either offering Heaven or the retribution of Divine Providence so the removal of either from a deliberate consideration is a necessary part of the examination of reality. 
I bring a measure of experience to this task. Things that are not counted, liabilities that are excluded from national budgets or their debts, do not mean that they do not have to be paid. This, in fact, is Europe's greatest problem. They have played "extend and pretend." They have played "lie and deny." They have resorted to every trick imaginable when compiling data such as the debt to GDP ratios of the countries and yet; chicanery does not erase the debts.
The financial projections of the IMF, the EU and the ECB are never accurate or even close to accurate because they use garbage for their data. It is therefore "garbage in" and "garbage out" as they all make a mockery of themselves. The vast amount of investors continue to believe them as evidenced by the markets but certain events are now about to take place.
Greece reported out a -14.2% decline in just one month this morning for retail sales. Greek collapse III is almost at hand as their two major privatizations have failed and as their economy continues to worsen. Soon the Greeks will call for more money but the end of this road is in sight as I do not believe the nations in Europe are willing to roll over again. The IMF is also up against the wall and they have asked, I understand, for Europe to forgive part of the Greek debt which has fallen, so far, on deaf ears.
Soon, soon, the Iceman cometh.
The Cyprus solution is a failure. It is as clear and as simple as that. Cyprus will have $10.17 left in their banks by the end of the year. They will soon be back asking for more money and we will have another IMF problem and a Euro fiasco as the amount of money they have been given to date is akin to a flyswatter trying to smack down an F-14. A ridiculous incident in both cases.
The biggest problem though is going to be France. They have a stated debt to GDP ratio of 90.2%. This is another mockery of the data though as the real number, liabilities included, is somewhere around double this number or just below 200%. They also have an economy that, according to "Trading Economics," is expected to decline in the next quarter by -0.5% while their sovereign debt increases to $366.9 billion which is an increase of 9.5%. This is while their government spending rises 9.9% for the same time period. This, then not only puts them in violation of the EU's current mandates, which is a secondary consideration, but puts them clearly on the road to insolvency.
France has run out of road.
The real issue here is a question of politics. In France being rich is defiled. That is fine and dandy except this attitude leads to an inescapable end which is with a 75% tax rate, massive amounts of workers in the government, social programs that keep increasing, and no reason to be successful and thereby support the government; those with money are fleeing the country. The drain is enormous.
Consequently sovereign revenues cannot, by any stretch of the imagination, support the imbedded costs of the country which must either be drastically cut, think massive protests or where France shows up at the door of the EU asking for help, which would be a disaster for the European Union. I believe the country is at this crossroads now as their fiscal policy, regardless of politics, is just not sustainable.
Now the investors of the world are in another reality altogether. They do not want to hear anything about these sorts of things. They are in the state of, "ignore and deplore."
You can live there for a while. Government induced fantasies have occupied the center stage before and for some time. Our current denial of reality is fueled by all of the money that the central banks have pumped into the world but that will be diminishing as the Fed and others examine the longer term consequences of their actions. There are always consequences.
What has been put off will arrive. It was always just a matter of time.

See the original article >>

Don’t Let the S&P 500’s Mixed Messages Derail Your Investment Strategy

By Sasha Cekerevac

The connection between economic growth and the stock market, best represented by the S&P 500, is a complicated affair. Many investors mistakenly believe that both need to be moving in the exact same direction at the exact same time.

But nothing could be further from the truth. For evidence, take a look at the economic growth rate over the last few years. While it’s quite clear that economic growth has been very anemic, the S&P 500 has in fact had a huge positive return.

There are actually many reasons that could push the S&P 500 up. Economic growth is obviously one of them, in addition to the profitability of the individual companies, many of which obtain revenue from international sources and don’t depend entirely on economic growth in the U.S., as well as the increase in monetary stimulus by the Federal Reserve.

I have been of the opinion that the Federal Reserve has primarily fueled much of the move up over the past few months.

The news that the Federal Reserve might begin to reduce its asset purchase program has led to a significant decrease in the S&P 500 as investors whose primary catalyst was monetary liquidity ran for the exits.

However, easing the stimulus can only occur if economic growth accelerates—the Federal Reserve was clear about that fact. The problem is that the data regarding economic growth remain mixed.

This week was a good example of the various mixed messages. On Tuesday, several data points indicated the potential for strong economic growth, including durable goods orders (both core and headline) far above estimates, consumer confidence moving dramatically higher, and the S&P/Case-Shiller home index showing a record year-over-year increase in home prices.

However, on Wednesday, the Bureau of Economic Analysis released final gross domestic product (GDP) for the first quarter at 1.8%, well below earlier estimates of 2.4%. (Source: Bureau of Economic Analysis, June 26, 2013.)

In this case, the final GDP data point indicates that economic growth was below estimates, leading some to believe that the Federal Reserve might keep its foot on the accelerator, which is bullish for stocks. However, the data are quite old, and the more recent data are showing potential for economic growth.

These mixed messages are leaving investors understandably confused.

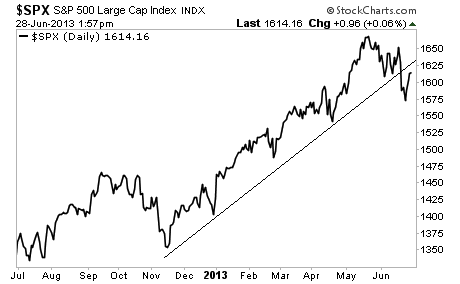
$SPX S&P 500 Large Cap Index
Chart courtesy of www.StockCharts.com

As they say, talk is cheap and actions speak volumes. The charts show us what people are actually doing. The S&P 500, following the recent sell-off after the Federal Reserve meeting, has started to move back up toward its trend line, as you can see in the chart above.

While some investors might believe that the Federal Reserve will continue pumping liquidity, helping propel stocks back upward, I disagree with that assessment because of the current position of the S&P 500. For me to become bullish once again on the S&P 500, as I’ve been for much of the time since last fall, it would need to move back above the upward-sloping trend line.

However, I think it is far more likely that the S&P 500 will attempt to break above this resistance but fail. Of course, if the S&P 500 were to sustain a breakout from resistance, it would naturally lead me to consider a retesting of the highs for the year as likely.

With earnings season coming upon us shortly, unless companies report extremely positive surprises, I think there will be an extensive amount of resistance at the 1,650 level in the S&P 500.

See the original article >>

Is It About Time You Take Advantage of the Market’s Near-Term Volatility?

By George Leong

I think Federal Reserve Chairman Ben Bernanke’s recent announcements got him his desired effect. Let me explain why.

The housing market was sizzling with bubble-like characteristics, and the stock market was in overdrive with the S&P 500 and Dow tacking on record after record.

Everybody from the retail investor to the Federal Reserve members to the pundits were attributing the gains to the easy monetary policy aggressively being pushed by the Federal Reserve.

Well, Bernanke did the right thing, and while things are not exactly calm at this moment, prices in the stock and housing markets have adjusted downward to more manageable levels.

On the charts, the major indices are all below their respective 50-day moving averages (MAs) and showing weak relative strength. As well, the S&P 500 has corrected 6.77% from its May high.

But I’m not convinced the worst is over yet. In my view, the potential of more downside moves is real and could likely surface. This would provide a buying opportunity to look at adding stocks.

The problem is that there’s still not a solid sense of which way things will go—much will depend on the economy and the Federal Reserve.

We saw some buying emerge in late-day trading this past Monday continuing into Tuesday morning. That buying suggests there could be some support, but I’m not convinced.

Stocks could rally like they did in mid-April, after a minor correction, but the selling could continue, following a pause. Traders will be eyeing the slew of key economic data on the horizon and trying to figure out whether the tapering of the bond buying will begin later this year, as the Federal Reserve suggested.

But as I mentioned in my recent post–Federal Reserve commentary, as long as interest rates remain low, I still feel stocks could go higher, though not at the same rate we have seen.

The reality is that the economic renewal is continuing, albeit not at a pace that some would probably want to see; nonetheless, the low interest rates will allow the economy to move along, which is what the Federal Reserve is looking for.

The key durable orders reading increased 3.6% in May, which was unchanged from April, but was below the more optimistic 4.5% estimate from Briefing.com. On an ex-trans basis, durable orders jumped 0.7%, better than the Briefing.com estimate of a reduction of 0.6%, but short of the 1.7% in April. The positive sign here is that consumers are continuing to spend.

Another hot topic is the housing market.

The Case-Shiller 20-City Index continues to point to strength, with home prices surging 12.1% in April, representing the biggest gain since March 2006.

The SPDR S&P Homebuilders ETF (NYSEArca/XHB) has lost 14% since its May peak and is still looking for a bottom, as shown on the chart featured below. Failure to hold at 28, as indicated by the horizontal blue line, could drive the housing stocks lower. In my view, the housing market has had its run and the easy money has been made. I would be hesitant to enter the housing market at this point.

XHB SPDR S&P Homebuilders ETF NYSE

Chart courtesy of www.StockCharts.com

I also would not be buying in this current housing market; however, I would be looking for any further declines.

For now, it’s all about the economy, jobs, and when the Federal Reserve will begin to reduce its bond buying. Depending on how the economic readings turn out, there will be more debate on the Federal Reserve’s bond buying—which means market volatility and possible opportunities to make money.

See the original article >>

Sugar futures set for sharp move - but which way?

by Agrimoney.com

Sugar futures are at a tipping point, which could see them fall some 15% or soar 30%, Phillip Futures said.

But as to which way they will break, commentators stressed divergent price influences.

Phillip Futures flagged "clear signs of tapering momentum" in the sugar market, with "smaller movement on the price chart" and lows on the chart for the sweetener's moving average convergence-divergence measure, a key technical indicator, "converging to zero".

Such phenomena often precede large price moves.

But as to which way, "there seems equal change of sugar breaking on the upside and the downside", the Singapore-based broker said.

New York futures, trading at 16.99 cents a pound in New York on Friday for the best-traded October lot, could break as high as 21.7 cents a pound or fall to 14 cents a pound.

"Fundamentally sugar is in large excess, but an unlikely major switch to ethanol production may cause unexpected disruption in sugar," the broker said, a reference to mills' capability, notably in Brazil, to convert cane into either the sweetener or the biofuel.

'Bullish view'

Separately, Rabobank, while cautious over predicting much move in sugar prices for now, said it was sticking by a "bullish view on the sugar market over the medium term", seeing futures recover to average 19.0 cents a pound in the last three months of 2013.

The price level at which it makes more sense for Brazilian mills to convert cane into ethanol rather than sugar "is becoming increasingly supportive" to sugar prices, "with ethanol production absorbing a greater proportion of the cane harvest", the bank said.

Recent rain delays to the cane harvest in Brazil's key Centre South region "raise the question of whether it will be possible to harvest the entirety of the 585m-tonne Brazilian cane crop this season".

Furthermore, the global sugar production surplus in 2013-14, which Rabobank pegged at 3.77m tonnes, would be the "smallest in three seasons".

'Surpluses have not disappeared'

However, Kingsman, the respected sugar consultancy, signalled a more cautious approach, even as it confirmed a downgrade to 3.927m tonnes, from 4.591m tonnes, in its forecast for the world sugar output surplus in 2013-14.

A drop in the surplus from the 11.486m tonnes estimated for 2012-13 "is being portrayed by some as bullish", the Swiss-based group said.

"But although it is a step in the right direction a surplus is still a surplus.

"And the past surpluses have not disappeared - the excess sugar is sitting in warehouses in China, India, Mexico and Argentina, to name but a few."

India uptick

Furthermore, it highlighted, generally, "upside" risks to its sugar output forecasts, for countries including Thailand, Pakistan and India, the second-ranked producing country, where a strong monsoon is seen as helping cane in many areas recover from drought, if causing flooding to some crops.

"Our Indian production estimate of 22.3m tonnes white value (24.2m tonnes raw value) has potential upside, with some now talking the crop closer to 23m-24m tonnes white value," Kingsman said.

See the original article >>

China Will Adjust Liquidity

By tothetick

The statement was issued through the official news agency of the People’s Bank of China, the Xinhua News Agency today. The statement went on to mention that “prudent” monetary policy would be implemented and would continue to be used, but fine-tuning would be used where and when appropriate in a bid to calm down fears that the Chinese banking system is drying up and going into meltdown. But will this be enough to alleviate the fears that have grown stronger over the past week? In particular in the light of the fact that two major Chinese banks no longer have enough liquidity deposits and have suspended their credit lines.

On Tuesday the People’s Bank of China agreed to inject money to stop the shortage that was occurring and that was already a change of attitude. Monday saw the Shanghai Composite post its biggest drop in 4 years of 5.3%. Tuesday was almost as bad with a further drop of 6%, only managed to pick that back up when the PBOC issued the statement that liquidity would be provided in the late afternoon. The Shanghai Composite rallied by 1.5% (+29.19 points to 1, 979.21) today so perhaps it has taken affect.

The People’s Bank of China is certainly playing it cool. They are very wary about injecting cash into the economy as they want to see a restriction on credit and they want the shadow banks to disappear, thus enticing the Chinese to put their money into bone fide (or banks that are controllable by the state) banks. Shadow banks include trust and insurance companies as well as pawnbrokers and informal lenders. By refusing to inject money to boost liquidity deposits, the People’s Bank of China had hoped that it would cut uncontrolled lending via the shadow banks. However, major banks are currently strapped for cash and now the statement has been issued that the PBOC will indeed aid faltering banks. This will not have the desired effect, therefore of reducing uncontrolled loans.

Shadow Banking

Shadow Banking

Shadow banks are able to raise capital from two sources, both from traditional banks and also from individuals that wish to obtain a greater yield than is being currently offered by those traditional banks. Those banks have lost out to enterprising possibilities on offer by the shadow-banking sector.

According to analysts, shadow banking is the fastest sector to grow in the financial area right now. In 2010 for a 2-year period shadow banks ended up doubling their outstanding loans and that came to a whacking 36 trillion Yuan ($5.8 trillion). In GDP terms, that represents about 69% of China’s current GDP.

Naturally, the shadow banks have little control from the state and so there business deals tend to be riskier and also they sometimes take over projects that would normally be dealt with by the traditional banking sector. That’s taking work away from the traditional banks, reducing even further their liquidity. But, if the state has little control over them, then that means when things do go really downhill, then there may be greater debt that will be popping up all over the place, further fuelling a meltdown that is already in progress.

If the People’s Bank of China has issued a statement today that they will continue to be prudent, but that they will use all kinds of tools to fine tune the Chinese economy, then all well and good. It just remains to be seen what that actually means. Prudence is a good thing, but what are the tools that are going to be used. Come on PBOC, tell us more! Otherwise if nothing is done very soon, the People’s Bank of China might actually end up taking down the sign hanging outside head office and replace it with the spheres suspended from a bar.

See the original article >>

4 Candles Create Confusion

by Greg Harmon

The major market index ETF’s have had a great start to the week. Four days of a reversal back higher has many calling the bottom in place and a run higher coming. But the close Thursday has also brought in some doubters and this is reasonable too. It all comes down to how you interpret the last 4 days Candlesticks. There are many similarities in the charts elsewhere. The Relative Strength Index (RSI) is turning back higher. The Moving Average Convergence Divergence indicator (MACD) is leveling or starting to improve. These are positives. But the move higher has come on flat or declining volume and is only now nearing the gap lower in the bodies of the candles. So that leaves the Candlesticks, and there are two different views. Lets walk through those Candlesticks one by one to see what you think.

First, for the bulls, the Russell 2000 ETF, $WIM, below. The first candlestick, a Spinning Top out side of the Bollinger bands is a good reversal candidate. The second a near doji back inside the Bollinger bands is is suspect, but does confirm the reversal in the Spinning Top. It is the next two Candlesticks, increasing in the size of their real bodies and moving up through the 20 day Simple Moving Average (SMA) that makes the bull case. These negate any doubt of the

iwm

Spinning Top and the doji. With the characteristics mentioned above this builds a bullish mosiac. The Dow 30 ETF, $DIA is pretty close to looking like this as well. Some may interpret this as a 3 Advancing White Soldiers pattern (the color on the second candle is wrong – it should be a solid black candle), which is very bullish. That may be a stretch but certainly all is well and you can lean back in your chair again. Until you look at the Nasdaq 100 ETF, $QQQ. This is a very different story, and by the way the same one the S&P 500 ETF, $SPY, is telling. It starts the same with the Spinning Top and confirmation higher with a candle back in the Bollinger bands. But then the doji’s continue and end Thursday with a

qqq

Gravestone Doji, or Shooting Star doji. This needs to be confirmed to be a reversal candle, but where is the long green body of the IWM candle? Where is the strong bullishness? This grouping with the gapping is more like an Advance Block, a weakening version of 3 Advancing White Soldiers. And this has not even made it to the 20 and 50 day SMA’s yet. So which set of candles is going to lead the market through the last day of the second Quarter?

See the original article >>

Oil is the Next Major Commodity to be Taken Down

By EconMatters

We have seen how Gold and Silver were viciously attacked by the shorts this past week, and surprisingly Oil escaped the carnage which is interesting because in April Oil was taken down to the $86 level during the last attack on the Gold and Silver markets. This is even stranger considering the fundamentals for the Oil market are even more bearish than they were in April from a supply standpoint as exemplified by the latest EIA report on Wednesday on this week. There is little doubt however that since the easy money is gleaned from the Gold attack, the Feral Hogs will start looking for their next target, and the Oil market will be high on their list in the upcoming months as the summer driving season winds down, and bulging supplies start to weigh on trader`s sentiments.

This week`s EIA report identifies the problem with the Oil market as we had refineries running at the highest utilization rate of the year at 90% and yet there still wasn`t a draw in crude supplies. There have only been like 4 or 5 draws the entire year in Crude supplies. With Oil inventories above 390 million during the strong part of the year for oil demand, what happens to supplies when the slower part of the demand cycle kicks in for petroleum products? Gasoline supplies are well above where they were last year at this time, and distillates are slightly ahead of last year`s inventory levels for this time of year. And for all that talk about added pipelines out of Cushing alleviated the Cushing Oil glut; you guessed it Cushing supplies are higher now than during this same time a year ago. This is hilarious considering the spread between Brent and WTI last year, compared to the $5 spread today. But that is the thing you have to understand about the Oil market it is one of the most manipulated markets in the world. There is just so much money to be made in the Oil business and markets that the incentives for manipulation with lax oversight are just too inviting for the large players in the industry. Take your pick either the spread should never have been $25 to begin with or it shouldn`t be $5 today because nothing has changed at Cushing Oklahoma in fact there is even more oil stuck in the Midwest so to speak which was used as the rationale for having the spread in the first place, and rhetoric for why the spread was going to go away! More lies and propaganda used to push positions for profit! The entire spread is a complete farce, take your pick it was either a farce then or it is now because having both conditions given the actual data is illogical.

The headwinds for the oil market are as follows: The entire BRIC and emerging markets commodity inspired theme has come to an end from Brazil to India to China. In fact, some emerging markets seem destined for a crash. And the biggest Oil consumer of the BRIC play China may be growing at less than 6% in real terms. You don`t have to look at China to realize how bad it is in China for growth of commodities just look at the other commodity producer countries of Australia and Brazil to see just how much China has slowed in its consumption of raw materials, i.e., the fall in Iron-ore prices. Moreover, the PMI`s coming out of China are going in the wrong direction, they aren`t getting better, they are starting to accelerate to the downside, and that was before the credit crunch of late. In addition, it appears too much past stimulus is part of the problem in China with regards to solvency issues and the shadow banking crisis that additional stimulus from the Central Planning Authorities is unlikely anytime soon.

The next headwind is a strong dollar and despite fed officials trying to talk down the dollar and bond market yields the rest of the world is in far worse shape than the United States. Emerging market and Commodity currencies are imploding against the dollar, and with the advent of the weakening Yen strategy of Japan the dollar seems destined for much higher levels. A higher dollar means commodities which are based and traded in dollars becomes more expensive, and is a bearish driver for prices.

Consumption is down in the biggest user of petroleum products the United States while the emerging economies like China and India are really struggling economically which is needed to offset the draw in US consumption. This is the real reason the Brent – WTI spread has come down with China not building a new city every month like they were in the developing phase, India in the midst of a recession, and Europe automobile sales at record lows, nobody is going to pay higher prices for oil at the global level – and Brent is considered the Oil Benchmark for international demand. And Brent under $105 tells you demand sucks internationally because if the players had their way Brent would be closer to $130.

Oil output and production is up globally, with US leading gains in the domestic US market not seen in decades. But here is the kicker for why Oil is in for larger inventory builds for the fall. The Saudi`s raise and lower production seasonally, i.e., they ship more to the US during the Driving season, and less in the Fall. But the US production is constantly rising because these are projects that are just trying to maximize production from an efficiency standpoint. So this new capacity comes to market regardless of the current supply levels or current seasonal demand patterns. You see this in the fact that we should be experiencing draws right now in Crude supplies as refinery utilization rates increase to produce more products for the seasonal driving demand. But yet we are flat or have had slight builds in Crude supplies because US production is making up the difference for season demand. The equation for the fall is the Saudi`s slow production as refinery utilization rates come down, but the US production still continues at or above the same rate and Oil supplies build with total supplies crossing the 400 million threshold.

Even the Middle East is looking less threatening for potential supply disruptions with Iran electing a much more moderate leader this time around, and an Iran attack that was thought to be a possibility is looking less likely by most of the scholars on the subject from the political think tanks analyzing the latest dynamics. It looks like there will be a deal to scale back the size of the nuclear program in Iran which appeases Israel and the United States and lifts the sanctions in Iran who need the economic boost as practical concerns have taken precedent over ideological drivers in the country`s politics.

In short, almost every argument used in the past to support higher oil prices is actually heading in the other direction. And we haven`t even touched on the fact that there seems to be a problem of deflation, and not inflation when it comes to commodities in general. All other commodities have deflated far more than Oil has, and especially if we take WTI which is up for the year, this seems like the outlier that stands out, and will be correcting in the future. The price of WTI doesn`t match the fundamentals of the rest of the commodity complex, or the fundamentals of its own supply and production levels. The real question is when will the Feral Hogs fix their sights on the WTI market, and take it down to $80 like they have the last two years. My guess now that they have had their fun with the Gold and Silver markets, they will start looking around for their next target. And the WTI price just stands out among the other commodities like a sore thumb. If they can take Gold down below $1200 on a couple of arguments, it seems there are at least five major arguments for taking WTI down to $80 in their next shark attack. Just watch out for all the I-banks coming out with their “research reports” after they are properly positioned for their takedown like we saw in Gold.

See the original article >>

Russia, Ukraine setbacks erode grain harvest hopes

by Agrimoney.com

The glowing early reports on the northern hemisphere wheat harvest turned a notch dimmer amid restated doubts over some former Soviet Union crops, and in the southern hemisphere with growing concerns for newly-sown crops in Western Australia too.

Reports on the early northern hemisphere grains harvests remain encouraging overall, as it ramps up from initial cuts in southern Russia and the US, with early results from Spain coming in strong.

Early Spanish barley cuts, an early indicator of the European Union cereals crop, "suggest excellent yields", averaging 7.5m tonnes per hectare so far in the north of the country, a major European commodities house said.

While this figure came from crops grown largely on irrigated land, "so average productivity will certainly be lower, it is a promising start for a country which has a five-year average yield of around 4 tonnes per hectare for winter barley," the commodities house said.

INTL FCStone analysts, returning from a field trip to northern Spain, reported expectations of yields of more than 8m tonnes for winter barley, with test weights "also being reported as being up on last year, at around 67 kilogrammes per hectolitre", a rise of 3 kilogrammes per hectolitre.

The strong crop prospects put Spain, a major European consumer of feed barley, on track for a "small surplus" in the grain in 2013-14 the commodities house said, flagging a potentially negative impact for exporters to the country, such as the UK which could see its "barley prices put under yet more pressure".

Former Soviet Union reports

However, while INTL FCStone also noted reports of strong rises in grain yields from the former Soviet Union so far, with Ukraine yields up 50%, some other commentators had a more negative spin.

Agritel, which has an office in Ukraine, termed the early Ukraine harvest "disappointing", saying that "spring dryness could have affected national production", while noting some setbacks in Russia too.

The agriculture ministry forecast of a 95m-tonne grains harvest, including 54m tonnes of wheat, "doesn't seems possible given the situation in the field", the consultancy said.

The beginning of harvest in the southern area of Kuban two weeks early reflects dry conditions towards the end of crop development which "could affect grains quality", cutting by 35% the amount of the local crop making milling grade, Agritel said.

"In addition, weather conditions are too cold in Siberia where plantings have been delayed.

"This could affect spring wheat quality with a drop in gluten rate", leaving "a significant part" of the crop potentially only suitable for feed use.

'Concerns surrounding ongoing dryness'

Separately, Rabobank reported "some concerns surrounding ongoing dryness" in Russia's Volga region as it slashed to 40m tonnes, from 55m tonnes, its forecast for the rise in world wheat production in 2013-14.

The bank's updated world crop estimate is in line with that from the US Department of Agriculture.

Rabobank also noted "quite mixed" reports for yields and protein from the US hard red winter wheat crop, which is broadly seen as having got off to a better-than-expected start, allowing a drop in the premium of Kansas City-traded hard red winter wheat over Chicago's soft red winter wheat.

Minneapolis-based broker Benson Quinn Commodities also reported a "wide range of protein levels" from the hard red winter wheat harvest, adding that a "few areas dealing with damp conditions".

'Some lost area'

Rabobank furthermore revealed that fears over dryness this month in Western Australia, where newly-sown crops are establishing, had hardened into reduced crop forecast.

"Australian production expectations have been trimmed due to some lost area in the eastern wheat belt in Western Australia," the bank said, in a briefing written by Australia-based staff.

Much of the Western Australia grain belt has received less than 40% of normal June rainfall, with Geraldton getting less than 10% of average levels, Luke Mathews at Commonwealth Bank of Australia said.

"The Western Australia grain belt is unfavourably dry and will stay that way for at least another week," he added.

See the original article >>
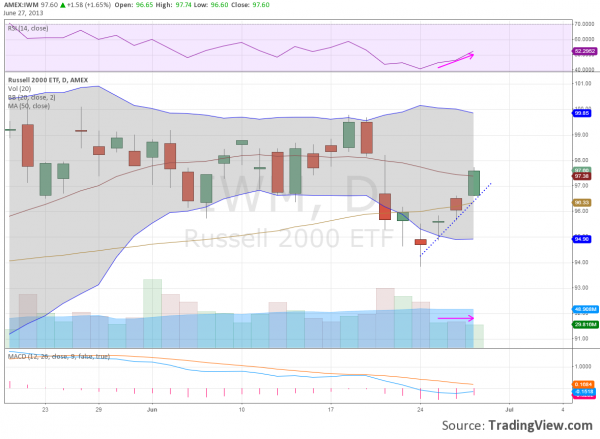
Gold Plunges

By tothetick

Gold has gone down Friday to under $1, 200 an ounce and that means it’s reached its lowest point for the past three years. Worse than that: it’s been the worst quarterly performance for gold for 45 years! But the mere mining of gold is now just under the market value of gold and this could have serious consequences for people working in that sector. Gold is almost at production cost today and if that stays there while the markets readjust, then it will be cause for concern for those working in mining.

The ‘All in Sustainable Cash Cost’ of gold, or the cost per ounce for a company to mine gold, is roughly $919. However that is for the US, where it is the cheapest to produce gold. In Africa, the level at which mining gold becomes profitable may be as high as $1, 300. The cost of gold production is broken down into the following areas:

  • $610 represents the direct cost of mining the gold.
  • $156 for mine development expenditure
  • $121 for sustaining Capital expenditure (to upgrade physical assets such as property).
  • $50 goes to gains made under currency hedging.
  • $44 administrative costs.
  • $44 goes in royalties (investors buy royalties and provide capital to the mine for future production and then they are paid back in royalties).
  • $29 for by-product credits.
  • $11 for the mine on-site exploration.
  • $26 for rehabilitation and accreditation.
  • $14 for other expenses.

Gold is most economically produced in North America, then in Europe. Africa is the most costly place to mine gold.

In some places in the world there has been a doubling in the cost of gold production over the past five years and it now stands at a world average of about $1, 000. Obviously, smaller mines are having greater difficulty in keeping up with that or will do in the future if the prices remain where they are. They may have to end up closing down. The only ones that will be able to maintain any sustained production will be the larger companies or the ones that have good cash flows and that might be able to prop themselves up for a while. There is also the added problem of the fact that fixed costs in the industry have seen a rise in recent years. Salaries, in particular have increased.

Gold has fared badly over the last quarter quite simply because of the Federal Reserve’s decision to cut Quantitative Easing by 2014. Analysts suspect, however, that it would be impossible for gold to fall further or to even go under $1, 000 an ounce as this would mean that the vast majority of mines would then turn unprofitable and definitely close. However, impossible always tends to happen right when it’s not being expected. So, will gold fall below that price of $1, 000?

Analysts also believe that the price of gold will automatically stabilize when mines go into liquidation and there are cuts in gold production. Reducing supplies of gold on to the market will lead to a rise in the price and greater stability. But, in the meantime, there will be miners that lose their jobs and mines that close leaving only the big fish to snap them up once the price of gold returns to better times.

The fall in gold prices has certainly been brought about by the end to stimulus that has been announced and which seems to be edging closer in the light of economic data revealed yesterday regarding US incomes and consumer spending, in particular. Even if the progress is tepid to say the least, it reveals that the Federal Reserve will withdraw Quantitative Easing as planned. That means that people will be leaving gold as it will no longer be just a safe haven to place your money while the economy gets back on track.

Consumer-spending data in the USA showed an increase of 0.3% in May (which was the opposite of April’s 0.3%-drop). After inflation, adjustments, spending rose by 0.2%. In the first three-months there was an increase in economic growth of 1.8%, which admittedly is not much. That’s sluggish. Consumer spending may have been helped along the way somewhat by rising prices of real estate in the USA. Given the fact that it was this which was one of the triggering factors of the financial crisis, Ben Bernanke is looking at it as a good gauge of what the state of the economy is like. This has a positive effect on consumer confidence. Average housing prices increased by 12.1% ending in April in comparison with last year. April has seen the largest monthly gain for six years (+2.5%). Housing prices are increasing perhaps some suggest due to the fact that there is a current shortage. The US population has increased by 12 million over the past 6 years, and there has been a cut in the building trade and real-estate sector regarding new homes being built. Rising house prices will mean that the economy is getting back on its feet, some will say. Incomes in the USA also increased by 0.5% and that means it was the best increase since February.

But, the President of the New York Federal Reserve Bank, William Dudley, did state yesterday that if economic growth were under what the Federal Reserve has predicted, then Quantitative Easing will more than likely continue.  Just last week, the Federal Reserve predicted a fall in unemployment to even below 6.5%, which would mean that the US was back in the boundaries of healthy. That is for 2014, which still means that it is a year ahead of what was previously predicted. March’s forecast of economic expansion in the US was raised and is now situated at between 3% or 3.5% for this year.

Gold falling in price has brought about a fall in the Australian Dollar also as a knock-on effect. It was down this morning to 92.76 US cents from 93.17 at yesterday’s close.

Australian Dollar

Australian Dollar

Some South African mining companies (where mining is the most costly) have already lost over $10 billion so far this year. This will bring further fears of the consequences of the future of some mines to the very forefront of their agendas. In some cases, South African mines are having also to deal with wage demands of over 60% this year. Gold prices have fallen by 25% this year.The South African Rand may also come in for a knock-on effect like the Dollar, and it is also down today by 0.26%.

South African Rand

South African Rand

So, the economy looks like it is picking up. Quantitative Easing will be withdrawn and gold will no longer be a good option.

See the original article >>
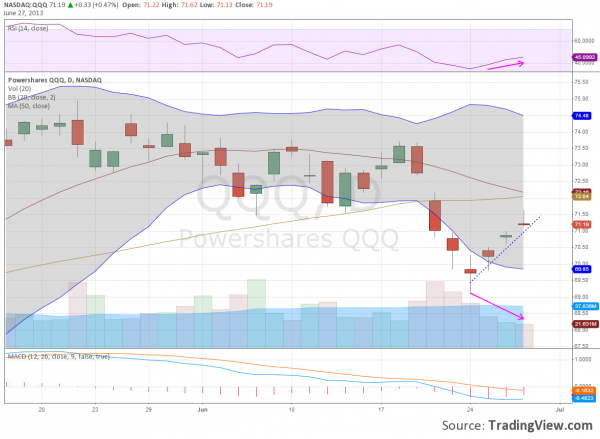
It’s Getting Volatile in Here…

By Attain Capital

There’s been so many recent events in the past couple of weeks, that it’s been hard to keep track. Let’s review: First it was Abenomics, resulting with the plunge in the Yen, then emerging markets experienced high volatility which sent stock US markets down, then a bout of selling in bonds as Bernanke signaled the end of QE. So put that all together and what do you get? Worried investors?  Sort of, but we’re not just talking about down moves – we’re talking about increased moves of all sorts. In the S&P, in Gold (ouch..again), in the Yen, in the Aussie Dollar, in 10 year notes.

In the Dow – consider the DJIA has had 12 triple digit moves this month, and at one point put in 8 in a row, from June 10th to 19th.

All of it combines to push the Vix to its highest levels of the year, and up about 81% since the March low, but you’ll also notice the VIX was down today with US stocks up.

Chart Courtesy: Yahoo Finance

But how does the VIX going down amidst a big up move reconcile with the fact that for those who go long and short – today was not less volatile, it was just volatile in another direction. As we’ve noted in a previous newsletter, while the VIX is the widely accepted barometer of volatility, it isn’t necessarily the best way to measure volatility for those who don’t just buy and hold stocks.

More importantly to managed futures participants, the VIX doesn’t do a very good job at explaining what investors are seeing in their portfolios. The fatal flaw of the VIX is that it doesn’t do a very good job of telling us what is happening when markets spike higher. Thus in order to get a better gauge of movement across markets we look to the much easier to understand average true range (ATR) calculation.  ATR has been used for decades by commodities traders, and the calculation is pretty easy to understand as well.  When calculating the ATR all we are considering are the market highs and lows for the current trading ATRsession along with the previous market close, and then averaging them across a predetermined time period. In this case, we looked back 20 days to see what the average market movement from one close to the next was.

With this view, you’ll see volatility at 1.5 year highs in stocks, gold, Yen, and 10 yr notes.

(Disclaimer:  past performance is not necessarily indicative of future results)

What’s this mean for the next 20 days, much less the rest of the year – who knows?  This could be a spike which subsides with the next bout of good economic news (or I guess… bad economic news so people think QE will come back), or it could be the start of a volatility shift to higher levels a la 2007/2008.

See the original article >>

Follow Us