by Greg Harmon
The major market index ETF’s have had a great start to the week. Four days of a reversal back higher has many calling the bottom in place and a run higher coming. But the close Thursday has also brought in some doubters and this is reasonable too. It all comes down to how you interpret the last 4 days Candlesticks. There are many similarities in the charts elsewhere. The Relative Strength Index (RSI) is turning back higher. The Moving Average Convergence Divergence indicator (MACD) is leveling or starting to improve. These are positives. But the move higher has come on flat or declining volume and is only now nearing the gap lower in the bodies of the candles. So that leaves the Candlesticks, and there are two different views. Lets walk through those Candlesticks one by one to see what you think.
First, for the bulls, the Russell 2000 ETF, $WIM, below. The first candlestick, a Spinning Top out side of the Bollinger bands is a good reversal candidate. The second a near doji back inside the Bollinger bands is is suspect, but does confirm the reversal in the Spinning Top. It is the next two Candlesticks, increasing in the size of their real bodies and moving up through the 20 day Simple Moving Average (SMA) that makes the bull case. These negate any doubt of the
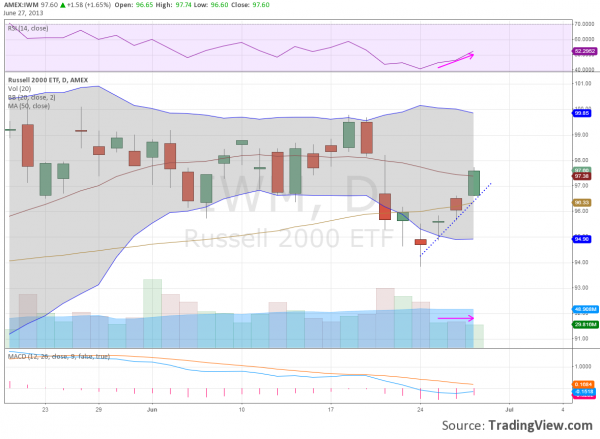
Spinning Top and the doji. With the characteristics mentioned above this builds a bullish mosiac. The Dow 30 ETF, $DIA is pretty close to looking like this as well. Some may interpret this as a 3 Advancing White Soldiers pattern (the color on the second candle is wrong – it should be a solid black candle), which is very bullish. That may be a stretch but certainly all is well and you can lean back in your chair again. Until you look at the Nasdaq 100 ETF, $QQQ. This is a very different story, and by the way the same one the S&P 500 ETF, $SPY, is telling. It starts the same with the Spinning Top and confirmation higher with a candle back in the Bollinger bands. But then the doji’s continue and end Thursday with a
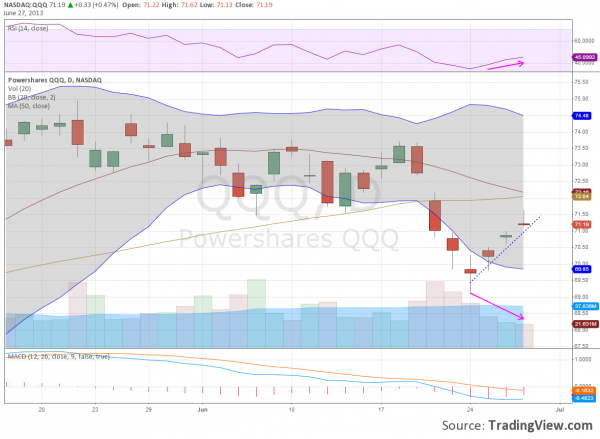
Gravestone Doji, or Shooting Star doji. This needs to be confirmed to be a reversal candle, but where is the long green body of the IWM candle? Where is the strong bullishness? This grouping with the gapping is more like an Advance Block, a weakening version of 3 Advancing White Soldiers. And this has not even made it to the 20 and 50 day SMA’s yet. So which set of candles is going to lead the market through the last day of the second Quarter?
No comments:
Post a Comment