Sunday, June 19, 2011

Yes, the Next Crisis is Coming… And It WILL Be Worse Than 2008


While the mainstream media has numerous stories for why 2008 occurred, the real one is largely ignored because admitting it would mean admitting that the entire financial system is filled with crap and that none of these problems have gone away.

The truth is that the cause of the 2008 crisis was the black hole of finance: the derivatives market. A market that is so enormous (20 TIMES the entire world stock market), so unregulated (Wall Street can literally price these things at whatever levels it wants) and so complicated that virtually no one wants to write about it.

Bernanke, Paulson, all of those guys lied when they acted like 2008 was a surprise. What was a surprise was that the system managed to last as long as it did. As far back as 1999, Greenspan admitted in private conversation that any attempt to rein in the derivatives market would “implode” the market.

Why is this? Because derivatives are crap, pure and simple. While intensely complicated on paper (the prospectus for a typical CDO was north of 60 pages) the derivatives market can ultimately be described in three words: Wall Street BS. It’s basically the creation of “assets” by dressing up bad ideas and financial nonsense in complicated terminology. 

Consider the mere notion that lumping a bunch of crap mortgages, student loans, and auto loans into a single package and then claiming somehow a portion of this is prime quality asset and you’ll get an idea of what I’m talking about (hint: they’re all still “crap” loans made to folks who won’t be paying them back).

The reason Wall Street went so crazy with these things is simple: they can price them at whatever prices they like and shill them to whoever (Greece, Jefferson County, Alabama, etc) while charging fees at every stage of the process. 

Imagine the profitability you could create if you literally could claim your own excrement was a financial instrument and then sell it to investors while loading the deal up with transaction fees, processing fees, fees if they ever realize it’s just crap and don’t want it anymore, and the like. 

As you can imagine, this situation lends itself to getting a little too carried away. Small surprise then that the derivatives market is over $600 trillion in size. That’s right, the largest market in the world is based on imaginary crap designed to make money for Wall Street and no one else.

So 2008 comes along. We all find out that this bunch of crap nearly destroyed the financial system. And we did… nothing. Bernanke funneled trillions to the big banks (all of whom are the primary producers of this crap) and that’s about it.
It’s almost as if the conversation went like this.

Bernanke: You did what!?!?
Wall Street: We have rendered the entire financial system insolvent with crap. We need trillions.
Bernanke: Hmmm… will you stop making this crap?
Wall Street: No.
Bernanke: Will you consider admitting it’s crap?
Wall Street: No
Bernanke: Ok, here’s a blank check.

So here we are today. And rather than fixing any of these problems, we’ve transferred a couple trillion dollars’ worth of this crap to the public’s balance sheet. 

Put another way, the crap that nearly took down the banks has been allowed to spread to the US and other country’s balance sheets.

What happens when a problem is not only ignored but allowed to spread even further? Well, we’re going to find out.

Indeed, the next Crisis is coming. And it will make 2008 look like a picnic. Why? Because this time around the Crisis will involve entire countries, rather than just banks (see Greece today). It’s going to be really REALLY bad. And I would argue that 99% of people are completely ignorant of it. 

Don’t be one of them. Don’t believe for one moment that the issues that created 2008 are fixed or that somehow we’ve made it through the worst. The worst is only just beginning. It may take a while to hit (just as 2008 did) but when it does it’s going to be really, really, REALLY bad.

On that note if you’ve not taken steps to prepare for the coming Crisis, you NEED To download my FREE report devoted to showing in painstaking detail how to protect yourself and your portfolio from the coming ROUND TWO of the Financial Crisis (round one wiped out $11 TRILLION in wealth).

I call it The Financial Crisis “Round Two” Survival Kit. And its 17 pages contain a wealth of information about portfolio protection, which investments to own, which to avoid, and how to take out Catastrophe Insurance on the stock market (this “insurance” paid out triple digit gains in the Autumn of 2008).

Agricultural Commodities On the Rise


The financial markets had a horrible day yesterday. There's no way of sugarcoating it. The Dow closed below 11,900 and both the Nasdaq and the S&P 500 ended about 1.75% lower.

Know what started to climb in after-hours trading?

Grains... Agricultural commodities like corn, wheat and soybeans. This is good news for grains. They had been sliding for a number of days because of lower energy costs. Some stabilization could mean investments in grains are in for a bounce.

I do think corn and wheat will climb from here. Jack Scoville of Price Futures Group is predicting tight corn supplies by September, and that the USDA will need to lower production estimates for wheat.

This news hasn't filtered down yet.

Two Agricultural Commodities Investments

You may remember me talking about two agricultural investments back in January... The iPath Dow Jones UBS Grains ETN (JJG:NYSE) and the PowerShares DB Agriculture ETF (DBA:NYSE). Both invest in agricultural commodity futures. The JJG was focused on grains exclusively, but the DBA can hold lots of different agricultural commodities.

Right now, the majority of DBA is made up of coffee futures. This isn't the same mix as when we first talked about DBA, and the ETF is down almost 5%.

It might be time to take this money off the table.

But JJG is a different story.

As of May 31, 2011, this was JJG's portfolio:


JJG is also down since January -- about 4%. But if grains get a bounce here, and grain prices start climbing, this is the investment you want to be holding, rather than DBA.

But here's the thing to watch. JJG's chart looks a lot like a futures chart for soybeans. Take a look.

Here's JJG:


And here's a chart for soybean futures:


Soybeans have been swinging back and forth for the past six months. One of the reasons for this has been low demand from the investment sector in favor of higher corn investments.

What this means for JJG is that any momentum from a jump in corn has been hampered by waffling soybean prices. On June 30, the USDA will release its Quarterly Stocks and Acreage update. That report could have an impact on where soybeans head from here.

Until then, we're going to keep JJG on our list unless we see its share price drop to $51. At that point we'll reevaluate.

P.S. It's a bit hard to talk about corn and wheat being "down" and ready for a bounce. Wheat is up more than 25% from this time last year. Corn is up an amazing 78% in a year. These kinds of price increases have huge consequences... We've seen food riots and even uprisings that have overthrown governments.

This kind of upheaval isn't over by a long shot. The world is on the edge of a food shortage, and to get ahead of this crisis, you have to have a plan. Safe Haven Investor editor Kent Lucas has one, and everyone should read his letter to get prepared for a food crisis. You can access this letter here.

Still Just A Stock Market Correction


The best thing to do is not be emotional. To write this update from a perspective that has no interference from what seems to be a bear market in the making. It may not be a bear at all, but let's explore what's going on here and what seems to be trying to set up. Let's start with facts. Simple facts. We are seeing unemployment increase. We are seeing unemployment claims rise. We are seeing wages fall because no one has power as a worker to demand more. Employers can fire anyone and find someone in the snap of a finger to replace that worker who wants more. Employees are working out of fear, and thus, accepting whatever comes, even if it means taking on more work for less wages. Just the reality of the world these days. Again, simple truths about what's taking place.

Let's discuss further truths. We know the fed will no longer partake in the QE program. No more easing from him. It's caused inflation without stimulating the economy. The program has been a complete and total failure and now fed Bernanke is admitting to it. Good for him for finally recognizing the error of his decisions. He's hurt the economy, but at least he now sees he has to stop, so that's a good start. More facts. The New York Index report showed we're in a negative growth economy. The Philly fed reported exactly the same down turn. The down turn over the past two months frightening at best. The economy is in free fall. The hope is that we're in a soft patch. That's hope, but not a fact. We're dealing only in facts for the moment. We can deal with fantasy later on in this report.
The manufacturing report fell off a cliff. From 60 to 53 last month. It was expected only to drop to 57. Things are eroding at a very rapid pace. There's more, but these are the facts that are relevant to the real world, and to fantasyland, known as the stock market. None of the news is very good here. In fact, it's just about all bad and why we're close to breaking down into a bear market. But only the facts. WE HAVE NOT BROKEN DOWN INTO A BEAR MARKET. More to come later on in this letter on that.

So we were at 2887 Nasdaq at the top and now we're at 2616. A nice drop of 271 points. 9% isn't terrible when you think about it. Normal bull market correction stuff. Normal would be from 8%-12%. Some are less, of course, but since we had such a bad sentiment problem at the top, and since we also had bad negative divergences on the weekly charts at the top, 9% isn't anything at all really. We have to look at the daily charts and decide whether the market is ready for the big heave lower.

Well, we know that most of the negative divergences have been worked off on the weekly charts. We know the sentiment problem no longer exists. The spread is only 11% percent now after topping out at 41.6% when things were too complacent. The headaches of the past no longer exist. In fact, things are getting a bit too bearish. What is a problem is the economy doesn't mean we're destined to go into a bear market. It could be a slowing down period only, and if the market senses that, the market won't break down.
The market will tell us soon by the way it reacts to suture reports. We'll have the employment report soon and we'll get another report on manufacturing quite soon as well. If those reports show another huge move lower in terms of jobs lost and a slowing of economic activity, the market will have a much tougher time holding up above S&P 500 1249, the line in the sand. It's going to ultimately be decided by the economy and earnings that are about to be reported.

Let's talk now a bit about those earnings to come. What can we expect, or what should we suspect will happen. We know that three months ago when the world reported their last quarterly results, the numbers were good and here's the most important point. There were lots of company's guiding higher for this quarter about to begin. With the rapid diminishing in the economy over the past two months, it's hard to imagine those reports of higher guidance actually being met. You'd have to think that many will say things fell apart in the past two months, and thus, they're going to miss on their earnings report, and more importantly, they'll likely guide lower for the next quarter. You can't think the market will like that very much. A declining economy into negative territory, and a declining earnings environment, is not good for the stock market. We'll get the answers soon enough for sure on that front. The earnings season has a massive red flag attached to it now because of how the economy has faltered recently.

It's very easy to feel negative about everything. The market stinks, and there are many stocks now trading in their own bear markets, including Apple Inc. (AAPL), the leader of leaders. It had a five bottom breakdown of 325 today with high volume making it the real deal. It broke down and recovered yesterday, but didn't come back today at all. A nasty candle stick to end the week. It's hard to envision the market hanging in above bear market territory with Apple in a bear market for the moment at least. However, when looking strictly at the facts, the market is hanging in there above the breakdown levels of 11750 Dow, 1249 S&P 500 and 2600 Nasdaq.

Those are the weekly up trend line figures off the March 2009 lows. That's what basically separates the market from moving out of the bull and into a bear. If those levels get taken out with force it's good-bye time for this market. The Nasdaq, the weakest link, is the leading loser these days as froth is being taken out and shot. The Nasdaq is only half a percent above the breakdown while the S&P 500 is still nearly 2% above. For now, to be blunt and state facts only, the bears have done some good work, but they HAVE NOT taken this market from bull to bear at this moment in time. And that's the bottom line for sure. We're still technically in a bull market until we lose 1249, 2600 and 11,750.

If we study those daily charts for a few moments, you have to say the advantage is on the side of the bulls. Why? Simple. RSI's are near that magical 30 level. Stochastics are near 10 and the MACD's are very compressed low on their scales. Levels that rarely, if ever, get taken out. This definitely gives the bulls hope that we may bottom out soon. Bear markets are notorious for staying oversold and that may be what happens here. Maybe we break below the above listed breakdown levels and those RSI's stay below 30 for some weeks. It can and does happen, but we are at levels on the oscillators where markets normally bottom from. So things are very unclear here.

The action is poor. Leading stocks are breaking into their own bear markets. Economic news is really bad. Things look bad BUT again, we have still NOT broken down into a bear market folks. We have to watch for it, but we're not there yet bears. You're close but not there, and in the end, that's all that matters in the moment. We play according to what is, and not what may happen. Cash is a great position. Some exposure is fine from time to time, but overall, loads of cash is best. Scalp here and there, but lots and lots of cash is best for everyone in this market environment. Take it slow. Relax and let's learn what the market's intent is together over the coming days and weeks.

See the original article >>

Stock Market Has Possibly Bottomed


A volatile week in the US which ended about where it started: SPX/DOW +0.2%. On the economic front positive reports edged out negative ones 9:8. On the positive side: the PPI/CPI remained positive, along with business inventories and industrial production. Improving were housing starts, building permits, weekly jobless claims, leading indicators and the monetary base. On the negative side: capacity utilization, the NAHB housing index, consumer sentiment and the WLEI all turned lower.

Turning negative were retail sales, the NY/Philly FED, and the current account deficit increased. As for the markets. The SPX/DOW were +0.2%, but the NDX/NAZ were -1.2%. Asian markets lost 2.2%, the Commodity equity group lost 2.5%, the DJ World index lost 0.9%, but European markets were up 0.6%. Bonds gained 0.2%, Crude tumbled 6.4%, Gold rose 0.3% as did the USD. Next week we have the FOMC meeting, Q1 GDP and Durable goods orders.

LONG TERM: bull market

In about two months we will have completed our sixth year publishing a blog on the internet. It has been quite interesting. We have had a bull market, then a real nasty bear market, followed by another bull market. For the entire period some EW’ers have remained bearish and many of these have stopped publishing. Some labeled the 2002-2007 bull market as a bear market rally. Just like they are labeling the 2009-2011 bull market as a bear market rally. They did, however, get the 2007-2009 bear market right.

Our record speaks for itself and is documented right here on this blog. When we started in Aug 2005 we were bullish. We remained bullish until January 2008 and turned bearish. We stayed bearish until March 2009 and then projected a 50% rally. When the rally unfolded and then failed to collapse we turned bullish in early 2010, and have remained bullish ever since. The Elliott Wave works! It should! Afterall it tracks investor sentiment as it unfolds. But one has to be objective, and OEW does that for us. The objective is to track the market, quantify the waves, and project the most probable outcome. OEW does that for us too! Project, monitor and adjust.


The weekly chart above speaks for itself. During bull markets the MACD stays above neutral, and then turns and remains negative during bear markets. The RSI constantly hits extremely overbought during bull markets, and extremely oversold during bear. The waves patterns are impulsive five wave structures during bull markets, and corrective three wave structures during bear. With these parameters alone one can easily see we are still in a bull market.

MEDIUM TERM: downtrend low SPX 1258

During bull markets and bear the market unfolds in trends. These trends are the significant waves. These are the waves that are labeled in the weekly chart to track the long term bullish/bearish trend. Yes, bull and bear markets are also trends, but long term trends. Which happens to be the name of a newsletter we published in the late 1980′s: Long-Term Trends.

The current trend/wave has been down, and has been underway since May 2nd when the SPX hit 1371 on the “Osama bin Laden is dead” news. That week commodities collapsed, Crude and Silver especially, and this eventually spilled over into the world’s equity markets. Then the negative news, which was ignored during the previous uptrends, was now big news during the downtrend. Fear begats fear, greed ignores fear. Love conquers fear. But that is another subject entirely.


This downtrend can best be described as part of an ongoing correction from the February SPX 1344 high. Yes, the market did make a new bull market high in April/May and this can occur in EW with what we term an irregular correction. Irregular corrections occur during strong markets. The correction unfolds in a complex ABC, but the B wave reaches a point that is higher than the start of the A wave. The C wave eventually concludes the entire correction usually in a flat (double bottom with waves A and C) and occassionally in a zigzag (when the C wave drops well below the end of the A wave). We believe this correction will end is the usual formation: a double bottom flat.

When we examine this February to June correction, which btw followed a well extended seven month uptrend from July 2010 to February 2011, (SPX 1011 to 1344). We observe the A wave down (Feb-Mar SPX 1344-1249) took the form of a zigzag. The uptrending B wave (Mar-May SPX 1249-1371) also took the form of a zigzag. Now the current downtrending C wave is also taking the form of another zigzag. This is termed an irregular complex correction, or an irregular double three. When this correction concludes the bull maret should resume to our projected target close to, or exceeding, the all time high at SPX 1576 by 2012. This lengthy correction has pushed out our timing from early 2012 to some time in 2012.


Currently the weekly RSI is the most oversold it has been in the entire bull market. This suggests stocks are relatively cheap for this bull market. The daily RSI recently reached the most oversold condition it has had since the July and September 2010 bottoms. The daily MACD is quite oversold and in between those two lows. The monthly RSI is currently reaching levels not seen since last years April-July correction. And, the monthly MACD shows little signs of weakening as it should during a bull market.

SHORT TERM

Support for the SPX remains at 1261 and then 1240, with resistance at 1291 and then 1303. Short term momentum ended the week at neutral after hitting overbought during friday’s gap up. The wave pattern we have been tracking is a zigzag from the uptrend high at SPX 1371. The first five waves down appears to have taken the form of a diagonal triangle from SPX 1371 to 1312. This is the reason it was quite difficult to determine this choppy pattern. This decline we labeled Minor wave A. The Minor wave B rally was quite sharp and quick as the SPX rallied to 1345 in a matter of days. Minor wave C has been a steady decline as most C waves are. We are counting this decline as four completed Minutes waves: 1306, 1317, 1266, and 1293. Minute wave five either bottomed at SPX 1258, or is still in the process of unfolding. At around SPX 1250 Minor wave C = 1.618 Minor wave A. This happens to be the same relationship that occurred during the Feb-Mar ABC zigzag downtrend. That downtrend ended at SPX 1249. A SPX 1250-ish level or even a bit below would conclude the irregular complex flat from February-June.


Currently we are observing positive divergences, at recent lows, from the short term charts all the way up to the daily charts. This suggests SPX 1258 may have been the low or we are getting close to it. SPX 1258, btw, is within the 7 point range of the OEW 1261 pivot. Should this pivot fail to hold the next pivot at 1240 should provide strong support. Overhead resistance is now at friday’s SPX 1280 high and then the 1291/1303 pivots. Short term OEW charts remain negative and the market will need to clear 1280 to turn them positive again. Please review friday’s comments for additional details. Best to your trading!

FOREIGN MARKETS

Asian markets were all lower on the week for a net loss of 2.2%. All remain in downtrends.

European markets were mixed, and had a better week for a net gain of 0.6%. Still downtrends across the board here too.

The Commodity equity group were all lower on the week for a net loss of 2.5%. All are downtrending here as well.

The downtrending DJ World index lost 0.9% on the week.

COMMODITIES

Bonds continue to benefit from the correction in the world’s markets. Up 0.2% on the week while the yield dropped to 2.9%.

Crude resumed its downtrend after a short term rally losing 6.4% on the week.

Gold gained 0.4% on the week and remains in what appears to be a corrective uptrend.

The uptrending USD gained 0.3% on the week, as did the Yen. But the EUR lost 0.3%.

NEXT WEEK

Some interesting events ahead of the markets this week. On tuesday we have Existing home sales and the FED starts its two day FOMC meeting. Then on wednesday the FHFA housing price index and the FED FOMC statement. On thursday, weekly Jobless claims and New home sales. Then on friday the final revision to Q1 GDP and Durable goods orders. The market is expecting GDP to be 1.8%. The FED does not have any speeches scheduled at this time. That may change near the end of the week. Best to you and yours as we enter summer in the northern hemisphere.

Apprenticed Investor: Lose the News

By Barry Ritholtz

Have you ever noticed how the stock market reacts differently to the same reported events?

Why is it that we sometimes sell off “in response to rising oil prices,” but at other times the “market rallied, despite the rise in the price of crude”?

How come a selloff was caused by a suicide bombing in Iraq, but a week later, the markets shrugged off an even larger, deadlier bombing? Is it possible that the markets are responding to forces other than the latest headlines?

Short answer: Absolutely. Yes.

Longer answer: Keep reading.

As we discussed last week, it’s clear that predictions of pontificating pundits have an extremely short shelf life and can be safely ignored. But it’s not just the talking heads who can throw you off your game. The value of the entire financial news complex — both print and electronic — seems to be hugely misunderstood by investors.

Even worse, many investors misapply what they hear; they ignore data, focusing instead on headlines and occasionally, the opinions. There are at least three problems with this approach:


  • First, news is hardly new. The vast majority of it is backward-looking, informing you as to what has happened already. Investing is about what is going to happen; what’s occurred in the past may be of interest, but it’s hardly germane to the investment process. Indeed, by the time the news is “out,” it already has been built into the stock price.


  • Worse yet, old news can have an impact on your thought process. That’s why I read The Wall Street Journal on the train home, and not on the way to work. Why? It forces me to recognize that the news is stale, and I avoid allowing it to influence my decision-making process. Instead, it becomes for informational proposes only (Yes, I really do this).

  • Second, the vast majority of news is irrelevant to your investing.Sure, the data points on occasion may be important, but the rest is essentially infotainment and filler. I find CNBC both informative and entertaining — but it’s not the basis of my investment decisions. This explains why there aren’t any hedge funds running money on the basis of what’s on TV.Even with situations that involve binary events — a yes/no FDA decision, a litigation outcome, an earnings report — it’s not the news coverage of these that matters so much as the actual data point. 

  •  Did the FDA approve a new drug or not? The subsequent reporting is irrelevant; it’s the event that matters.

    Quite often, it’s not the news that matters, but the reaction to the news. Look at Intel’s (INTC) midquarter update. It was good all around, but the stock has since slipped. That’s because the improved environment, especially for laptops, was already well known. It was fully built into Intel shares.

    When we consider events of even greater historical significance, we discover something rather astounding: Over the long haul, the markets ignore things like Pearl Harbor, JFK’s assassination and even the Sept. 11 terrorist attacks. Gary B. Smith showed how after their initial response, the markets resume whatever their prior trend was.

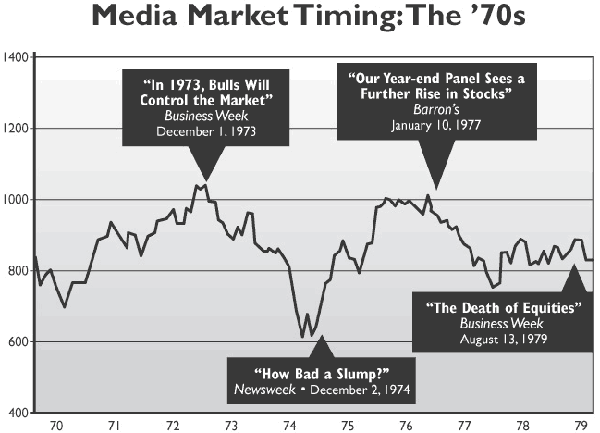
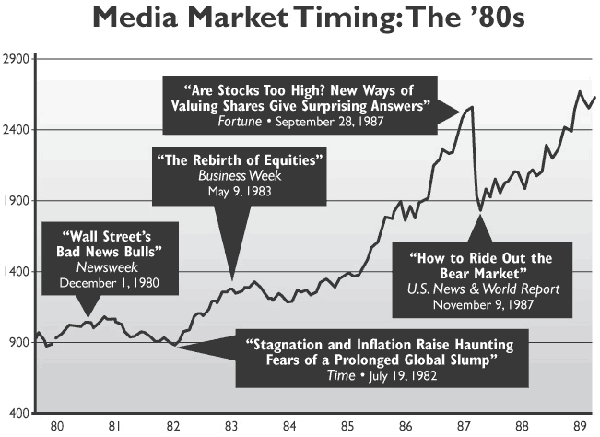
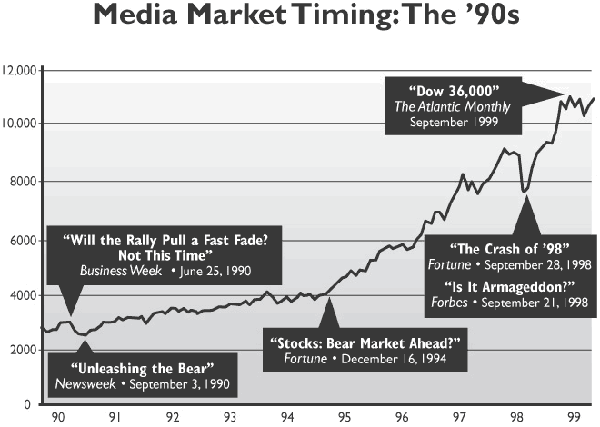
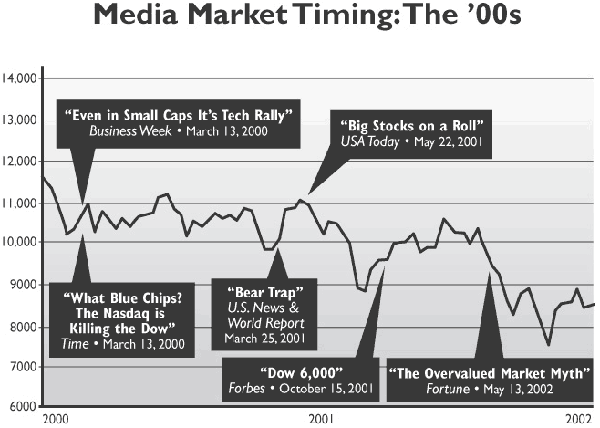
  • Third, because news organizations often try to appeal to as many people as possible, they have a disconcerting tendency to catch various trends just as they are peaking.

  •  
    Have a look at these charts provided by Neal Frankle, author of Why Smart People Lose a Fortune. They offer a compelling explanation as to why the mainstream media should not be the source of your investment strategy; in fact, they can often be a strong contrary indicator.
    Source: Why Smart People Lose A Fortune, by Neal Frankle
    Source: Why Smart People Lose A Fortune, by Neal Frankle
    Source: Why Smart People Lose A Fortune, by Neal Frankle
    Source: Why Smart People Lose A Fortune, by Neal Frankle

    Avoid the Headline of the Day

    The news machine needs to create an enormous amount of content to have product to sell. Hours on TV and radio, pages in print and on the Web. Remember, most media are advertising-driven, and it requires all that content to be able to sell all those ads. (That’s why jokers like me are on so often).Just think about some of the recent headlines and their impact on both markets and individual stocks. The CEO of a major brokerage firm resigns — who cares! Martha gets out of jail: Whoop-de-doo!

    The media focus on the “sensationalistic or scandalous, rather than market-moving,” observes Real Money.com trading diarist James “Rev Shark” DePorre. “Stuff like the firing of a CEO, the housing “bubble” or Martha Stewart’s latest travails may be interesting, but they don’t help you much with your investments.”

    I agree with Shark’s contention that the “media are at their best when they focus on emerging market trends.” You know, the stuff that has yet to make the magazine covers or major headlines. That may give you a push in the direction of an investable theme. Unfortunately, this sort of coverage is rare and often found in specialty magazines such as Wired, CFO and The Economist.

    There are exceptions to every rule, and this one is no different. The most valuable thing the media can do for you is to grant you an audience with people you might not have access to otherwise.

    It’s particularly useful to see or read the wisdom from those people who do not need the publicity and have no agenda. They are merely identifying issues that they believe need to be addressed and that often are not.

    This isn’t to suggest that you should blindly follow the star investors: Simply because former General Electric (GE) chairman Jack Welch or Berkshire Hathaway’s (BRK.A) Warren Buffett say something will happen is no guarantee it’s going to come true. When others are opining about what’s to come — even the greats — you should have a healthy skepticism.

    Still, I will closely listen to any investment giant who has a spectacular track record over long periods of time, meaning his or her performance is not the result of mere chance.

    1. Expect to Be Wrong 2. Your Fault, Reader
    3. The Wrong Crowd 4. Bull or Bear? Neither
    5. Know Thyself 6. Prepare for Battle
    7. Bite Your Tongue 8. Don’t Speak, Part 2
    9. The Zen of Trading 10. The Folly of Forecasting
    Check back for more of Barry Ritholtz’s
    Apprenticed Investor series
    A few examples: T. Boone Pickens on Kudlow & Cramer a year ago saying oil’s price rise was not a temporary phenomena; Julian Robertson on CNBC discussing the dollar; Former Federal Reserve Chairman Paul Volcker identifying structural imbalances in the U.S. economy in The Washington Post; and the Barron’s interviews with folks like Ned Davis, Ray Dalio, Walter Deemer, Seth Glickenhaus and others.Giving you access to such financial luminaries is one valuable service the media provide for investors. As for the rest, savvy investors know it’s mainly just noise and entertainment.

    Bearish Sentiment Continues To Rise


    It is amazing how rapidly the bearish sentiment has increased over the past two weeks while the SP500 is down only 7.2% from its May 2nd high. Fear that the cyclical bull market is over is spreading, and this does not support the bearish case. Those that point to the weak economy as justification for a bearish view are not being rational as the economy has been weak for the last 3 years (ask any small business person). Minor fluctuations in degrees of weakness should not be used to validate stock market forecasts.
     stocks
    The weekly chart shows that there is a strong zone of support surrounding the April and November 2010 highs with the 50 and 200 week emas providing additional support. While anything can happen, it is not likely that this zone will be breached substantially on the first attempt. It is more likely that a significant rally, either a resumption of the bull market or countertrend, will emerge from this zone of support around 1220.
     stocks
    I have labelled the daily chart as a flat correction in wave [X]. The lunar cycle failed to produce a reversal of significance this week with the full moon. Even though the lunar cycle is not very reliable in general, it often occurs that a failed reversal at a full or new moon when the cycle is active ends up being a continuation or acceleration point. So we are likely to see sideways to down action over the next two weeks into the end of the quarter.

    As labelled, the SP500 is probably in minor wave 4 now as a triangle or flat correction to be followed by wave 5 down into a low around mid-July. At that point we would like to see some positive momentum divergences develop, which are not present now, to identify the end of wave (C) down.

    The biggest concern is here is that wave [X] may extend into a combination correction lasting several more months, but even if it does, the impending low should not be breached substantially. We would be looking for a triangle or a zigzag for wave (Y).

    For now, the best thing to do is be patient and wait for a new uptrend to develop. Shorting is probably not the best idea except on an intraday basis.

    See the original article >>

    SPY Trends and Influencers 6/18/2011


    Last week’s review of the macro market indicators highlighted what set up as a bizarro week for any macro economic follower. Gold ($GLD) and Oil ($USO) looked set to consolidate or go lower and the US Dollar Index ($USDX) and US Treasuries ($TLT) looked to continue higher. Both the Shanghai Composite ($SSEC) and Emerging Markets ($EEM) looked lower. Despite falling equity markets Volatility ($VIX) looked to remain subdued. The US Equity Index ETF’s , $SPY, $IWM and $QQQ all looked to have more downside with the weekly charts more ugly than the daily charts. Also all three were moving lower in the same pattern indicating a total equity market selloff, not sector or capitalization specific. 

    The week began The week played out very much as the charts were hinting. Gold played a tight range while Crude Oil moved lower. The Dollar Index continued higher as Treasuries consolidated at their highs. Both the Shanghai Composite and Emerging Markets slid. Volatility remained relatively low but started to pick up mid week. Equity markets ticked higher early only to sell off and end the week lower. What does this mean for the coming week? Let’s look at some charts.

    SPY Daily, $SPY
    spy d3 e1308350243464 stocks
     
    SPY Weekly, $SPY
    spy w3 e1308350268630 stocks
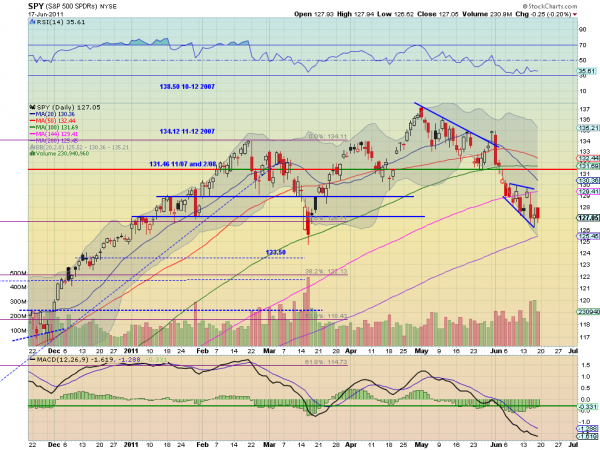
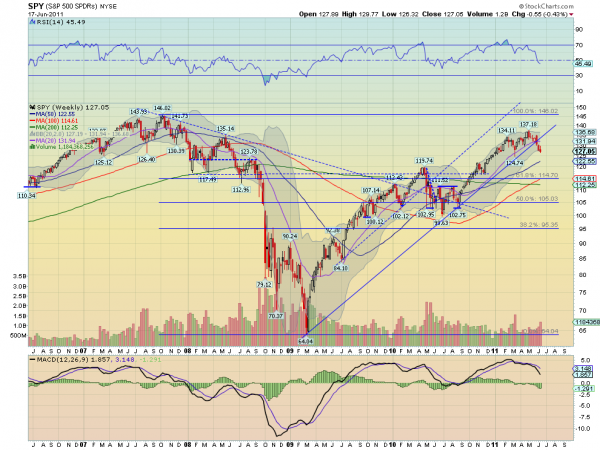
    The SPY tested the top of the expanding wedge and then fell back holding support at the 127.10 area. On the daily chart the RSI looks to be leveling and the MACD is starting to improve. This would give you the impression that a bottom may be in…until you look at the weekly chart. On the weekly timeframe the SPY continued the break of trend support lower with increased volume, a RSI that is sloping lower and through the mid line and a MACD growing more negative. UGLY. Look for next week to bring more downside with support coming at 126.30 and 123.50, which would be a 10% pullback. Upside will find resistance at 128.22 and 128.88 before 130. Over 130 the trend is reversed.

    VIX Daily, $VIX
    vix d2 stocks
    The Volatility Index broke out of the 15 – 20 range it has been in toward the end of the week and ran higher. The RSI and MACD on the daily chart suggest more upside to come. Now above the crucial 21.25 level, look for Volatility to continue to increase with the next critical level being a move over 24, which could trigger a bigger move up.

    Next week looks for Gold to drift higher while Crude Oil heads lower. The US Dollar Index is primed to continue its upside move while Treasuries consolidate with an upside bias. Both the Shanghai Composite and Emerging Markets should see continued weakness. The Volatility Index will be important next week and is poised to move higher. US Equity Index ETF’s, are mixed but generally biased to the downside. The QQQ is the worst looking with the SPY mixed but biased lower and the IWM looking as it may consolidate. Watch for a move in the Volatility Index over 24 to trigger coordination among the Index ETF’s and a a move lower. Consolidation in the weaker Indexes should bring the Volatility Index back under 20 and could lead to a trend change. Use this information to understand the major trend and how it may be influenced as you prepare for the coming week ahead. Trade’m well.

    See the original article >>

    Follow Us