by
Last week’s review of the macro market indicators highlighted what set up as a bizarro week for any macro economic follower. Gold ($GLD) and Oil ($USO) looked set to consolidate or go lower and the US Dollar Index ($USDX) and US Treasuries ($TLT) looked to continue higher. Both the Shanghai Composite ($SSEC) and Emerging Markets ($EEM) looked lower. Despite falling equity markets Volatility ($VIX) looked to remain subdued. The US Equity Index ETF’s , $SPY, $IWM and $QQQ all looked to have more downside with the weekly charts more ugly than the daily charts. Also all three were moving lower in the same pattern indicating a total equity market selloff, not sector or capitalization specific.
The week began The week played out very much as the charts were hinting. Gold played a tight range while Crude Oil moved lower. The Dollar Index continued higher as Treasuries consolidated at their highs. Both the Shanghai Composite and Emerging Markets slid. Volatility remained relatively low but started to pick up mid week. Equity markets ticked higher early only to sell off and end the week lower. What does this mean for the coming week? Let’s look at some charts.

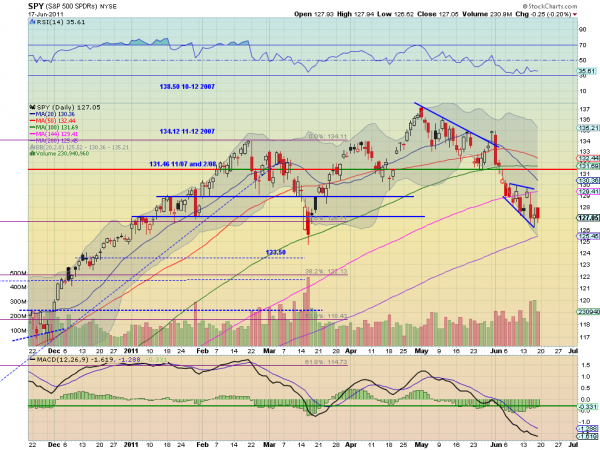
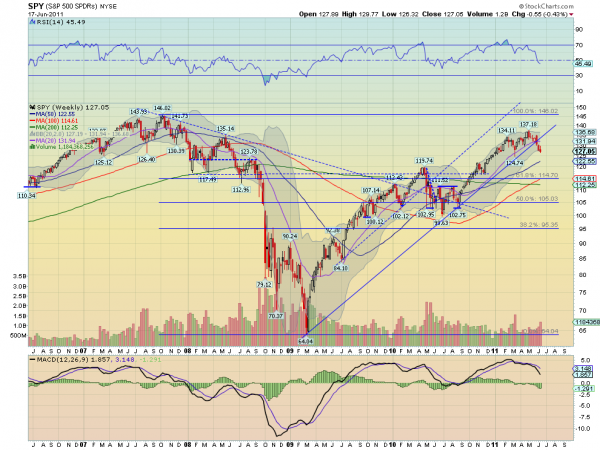
SPY Weekly, $SPY

The SPY tested the top of the expanding wedge and then fell back holding support at the 127.10 area. On the daily chart the RSI looks to be leveling and the MACD is starting to improve. This would give you the impression that a bottom may be in…until you look at the weekly chart. On the weekly timeframe the SPY continued the break of trend support lower with increased volume, a RSI that is sloping lower and through the mid line and a MACD growing more negative. UGLY. Look for next week to bring more downside with support coming at 126.30 and 123.50, which would be a 10% pullback. Upside will find resistance at 128.22 and 128.88 before 130. Over 130 the trend is reversed.
VIX Daily, $VIX

The Volatility Index broke out of the 15 – 20 range it has been in toward the end of the week and ran higher. The RSI and MACD on the daily chart suggest more upside to come. Now above the crucial 21.25 level, look for Volatility to continue to increase with the next critical level being a move over 24, which could trigger a bigger move up.
Next week looks for Gold to drift higher while Crude Oil heads lower. The US Dollar Index is primed to continue its upside move while Treasuries consolidate with an upside bias. Both the Shanghai Composite and Emerging Markets should see continued weakness. The Volatility Index will be important next week and is poised to move higher. US Equity Index ETF’s, are mixed but generally biased to the downside. The QQQ is the worst looking with the SPY mixed but biased lower and the IWM looking as it may consolidate. Watch for a move in the Volatility Index over 24 to trigger coordination among the Index ETF’s and a a move lower. Consolidation in the weaker Indexes should bring the Volatility Index back under 20 and could lead to a trend change. Use this information to understand the major trend and how it may be influenced as you prepare for the coming week ahead. Trade’m well.
No comments:
Post a Comment