Sunday, May 26, 2013

Japan Money Printing Economy - Damn the Torpedoes, Full Speed Ahead!

By: John_Mauldin

Alice laughed: "There's no use trying," she said; "one can't believe impossible things."

"I daresay you haven't had much practice," said the Queen. "When I was younger, I always did it for half an hour a day. Why, sometimes I've believed as many as six impossible things before breakfast."

– Alice in Wonderland, Lewis Carroll

I wrote several years ago that Japan is a bug in search of a windshield. And in January I wrote that 2013 is the Year of the Windshield. The recent volatility in Japanese markets is breathtaking but characteristic of what one should come to expect from a country that is on the brink of fiscal and economic disaster. I don't mean to be trite, from a global perspective; Japan is not Greece: Japan is the third-largest economy in the world. Its biggest banks are on a par with those of the US. It is a global power in trade and trade finance. Its currency has reserve status. It has two of the world’s six largest corporations and 71 of the largest 500, surpassed only by the US and comfortably ahead of China, with 46. Even with the rest of Asia's big companies combined with China's, the total barely surpasses Japan's (CNN). In short, when Japan embarks on a very risky fiscal and monetary strategy, it delivers a serious impact on the rest of the world. And doubly so because global growth is now driven by Asia.

Japan has fired the first real shot in what future historians will record as the most significant global currency war since the 1930s and the first in a world dominated by true fiat money.

At the risk of glossing over details, I am going to try and summarize the problems of Japan in a single letter. First, a summary of the summary: Japan has painted itself into the mother all corners. There will be no clean or easy exit. There is going to be massive economic pain as they the Japanese try and find a way out of their problems, and sadly, the pain will not be confined to Japan. This will be the true test of the theories of neo-Keynesianism writ large. Japan is going to print and monetize and spend more than almost any observer can currently imagine. You like what Paul Krugman prescribes? You think he makes sense? You (we all!) are going to be participants in a real-world experiment on how that works out.

(Note: This letter will print longer than usual as there are a lot of graphs.)

But first, I want to mention a very special event, that is of great relevance to this discussion, and that will be coming your way in just a couple weeks. I'm going to get together in New York with five of the most powerful investing minds in the world – Kyle Bass, Mohamed El-Erian, John Hussman, Barry Ritholtz, and David Rosenberg – and we're going to totally take apart the New Normal environment in which we all find ourselves and then rethink and rebuild it in a way that will help you not only survive it but profit from it. Investing In the New Normal will feature a full hour of our unfiltered conversation and uncensored analysis. It will come to a computer screen near you on Tuesday, June 11, and you will want to be there! The event is free, and you can register here. Seriously, a full hour with those five guys. How cool is that? I will make sure you get a few powerful take-away s that will impact your thinking and your investing. And now, let’s take a look at that hard windshield and that big bug.

The Mother of All Painted-In Corners

In no particular order, let’s look at some facets of the daunting task facing Prime Minister Abe and the country of Japan.

After the collapse of what might still be the largest economic bubble in history, in 1989, Japan is still mired in a 24-year non-recovery. Nominal GDP in 2011 was almost exactly what it was 20 years earlier, in 1991 (MeasuringWorth.com). You can find other ways to measure nominal GDP which indicate limited growth; but compared to the US and China, nominal growth in Japan has been paltry.
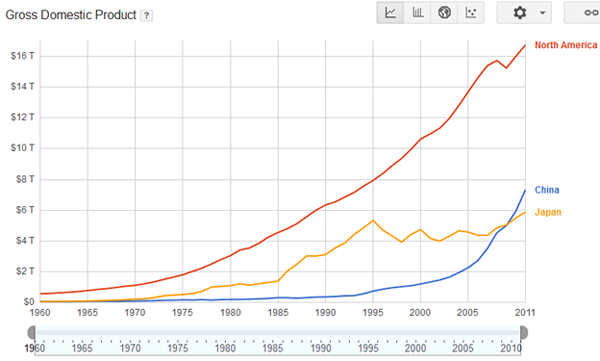
(Google Public Data Explorer)

That lack of growth takes on special importance because when we measure national debt-to-GDP we use nominal GDP as the denominator. If debt is growing and the economy is not, that debt-to-GDP ratio can grow very rapidly. From the Financial Times at the end of March:

Japan’s central bank governor has told parliament that the government’s vast and growing debt is "not sustainable," and that a loss of confidence in state finances could “have a very negative impact” on the entire economy. The warning comes as Shinzo Abe’s administration attempts to drag Japan out of more than a decade of deflation with aggressive monetary and fiscal stimulus.

In January, weeks after taking office, the government unveiled a Y10.3tn ($109bn) spending package while leaning on the Bank of Japan to buy more of its bonds – a strategy described by Morgan Stanley MUFG Securities as "print and spend". Speaking to lawmakers on Thursday, BoJ governor Haruhiko Kuroda noted that, while the government bond market has been "stable," Japan’s gross debt to GDP ratio – expected to top 245 per cent this year, according to estimates by the International Monetary Fund – is "extremely high" and "abnormal".

Japanese households and corporations are saving even as the government runs deficits close to 10%. As a way to compare, a 10% deficit in the US would be $1.6 trillion.
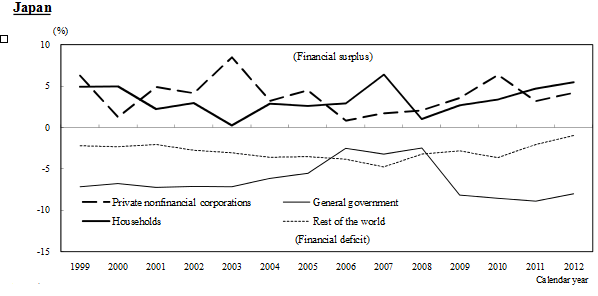
Damn the Torpedoes, Full Speed Ahead!

There are two and only two ways to grow an economy in real terms. You can grow your working population, or you can increase your productivity. That’s it. Japan does not have the option of growing its population (or has not chosen to), and it is actually quite difficult for an industrial economy to grow its productivity. If your population is actually shrinking (see chart below) and productivity growth is less than 1%, then real GDP growth is just not possible. We are going to revisit this uncomfortable fact later.
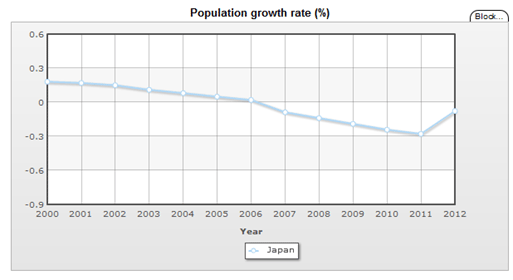
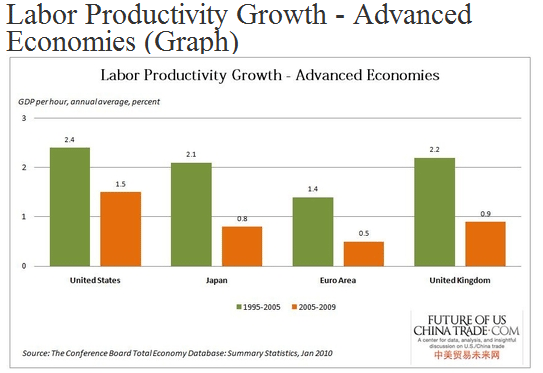
(ChinaGlobeTrade.com)

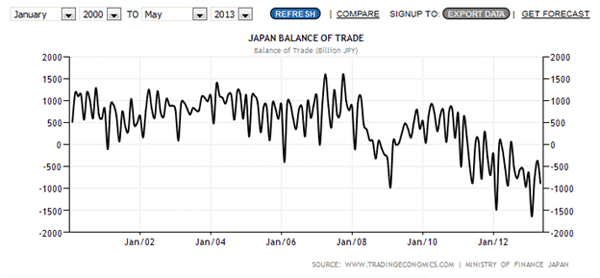
Japan ran a massive trade surplus for years. Now it is running a large trade deficit. If you run a trade deficit and a fiscal deficit, either private savings has to make up the difference, or the central bank has to print massive amounts of money. That is an accounting identity; there are no other choices. Absent massive monetization, you suck all the available investment capital from your private economy. But Japan needs growth to get out of its fiscal and economic morass. That means it desperately needs more exports, since its aging population cannot be the source of significant increases in consumer spending. The Japanese elderly are savers and hoarders, almost by definition.
The Abe government and the Bank of Japan under Kuroda-san have targeted 2% inflation. Even with nominal GDP growth last quarter of 3.6% (annualized), the country was in deflation. They have been trying to generate inflation for 24 years. How will they now get 2% inflation? One way is to increase the cost of their imports. The problem is that Japan imports only about 16% of its GDP, according to recent World Bank data. That means to get to 2% inflation they would need their currency to drop by about 15-20% a year (as the effects are not one-to-one, but that takes a whole letter to explain). Easy enough: the yen has fallen that much since just the beginning of this year (see chart below). The problem is that you have to do that every year, on a trade-weighted basis, with all your trading partners.

This chart shows the fall of the yen against the US dollar. The yen closed around 101 today, from 75 less than a year ago. So mission accomplished, right?
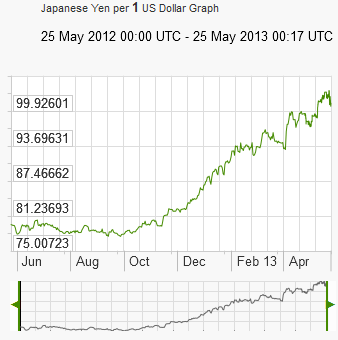
Well, not so fast. Japan trades with the world, and what matters is the trade-weighted yen (just as the trade-weighted dollar is what makes the difference in the trade balance of the US). And while the trade-weighted yen is down over 20% against the average of the currencies of Japan's key trading partners, that is not as much as it is down against the dollar (see chart below). Australia and other Asian countries are just beginning to respond to Japan by lowering exchange rates and by other means, so the “easy” devaluation of the yen has already happened. The hard work is just starting, as other countries will increasingly feel forced to respond. No major country can export its deflation to the rest of the world without the rest of the world seeking to redress the balance.
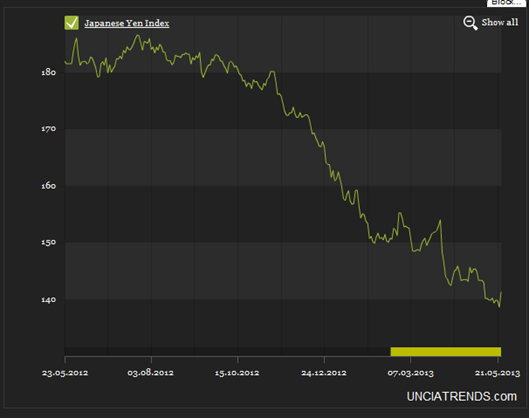
For Japan to get that 15-20% a year currency depreciation for the next five years would be such a tectonic-plate shift for the world that it is difficult to express the magnitude of the task. That would put the yen at 200 to the dollar by 2018 or sooner. If you are Germany, can you deal with that? Korea? China?

It will not be long before you can buy a Lexus cheaper than you can buy a Hyundai, and a Panasonic flat screen will be half the price of a Samsung or LG. But of course Japan does not act in a vacuum. As I wrote last week,

Let's put the recent drop in the yen in context. The Nihon Keizai Shimbun, the main Japanese business newspaper, has reported that every one-yen fall in the yen/dollar rate will translate into a $2.7 BILLION increase in profits for the 30 largest Japanese exporters.

For every one yen the currency drops in value against the dollar, Toyota estimates that its profits will increase by $340 million. PER ONE-YEN DROP! Toyota reported $3.33 billion in profits last quarter, so that additional $340 million of profit per one-yen fall could send its second-half profits – and its stock – to the moon.

But those profits don’t just magically appear; they come from sales. Sales that are in large part due to better terms of trade and lower costs. Those profits are from sales that might have gone to other companies based in other countries and that might have been valued in euros, dollars, yuan, or won. Which is why businesses and finance ministers all over the world are not happy with Japan.

Six Impossible Things

Abe and Japan are in an almost ridiculously impossible situation. Let’s look at what they have to do in the light of what we just read.

They cannot continue to grow their debt at the current rate. There is a limit. No one knows for sure what that is, but it is getting closer. And they know it. So they have to get their fiscal deficit below the growth rate of nominal GDP.

To do that they have to have both real growth and nominal growth. Real growth in a country with a shrinking population requires productivity increases on a scale not seen in any industrial country anywhere for any sustained period of time. So they have to get nominal growth, which means they absolutely must have inflation or their country will collapse in a massive debt deflation, with skyrocketing interest rates.

But 2% inflation implies that interest rates on Japanese bonds must be at least 2% if not 3% or more. That is double what they are now after the recent spike in the yield of JGBs (Japanese government bonds) from 0.5% to 1%, which sent the Japanese stock market into a tailspin on Thursday – down 7.3 percent.

As Kyle Bass and others have amply demonstrated, if JGB interest rates rise 2% in Japan, then the government must pay almost 80% of its revenues (as currently received) just to cover the interest on its debt. That is, of course, not a viable business model. Even a 1% rise would be fiscally devastating.

The Abe government plans to raise taxes. Japan’s current sales tax is 5%, due to increase to 8% next year and 10% by 2015, although they will look at economic data in October to decide whether taxes will indeed rise. That is a large tax increase, and it will, of course, hurt consumer spending. But the government has to reduce its fiscal deficit at some point. The question is when and how. For two decades the answer has been "Next year." Next year may actually arrive ahead of time if the bond market starts to get nervous. Look at the drop in 10-year JGB bond prices this week (through Thursday, hat tip The King Report). While such drops have happened in the recent past, you can be sure this is cause for concern in Tokyo. There are limits, even for Japan, to what bond investors will endure.
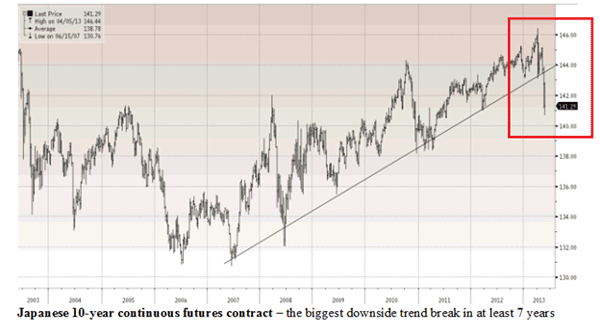
Reducing fiscal spending will by definition (an accounting identity again) reduce GDP or at the very least make it more difficult to attain inflation of 2%. Remember, austerity is not a punishment but a consequence of past failures to control spending.

Unwarranted Humility

The solution that Abe and Kuroda arrived at, to the applause of mainstream economists, is massive quantitative easing. Let’s look at a paper just published by UC Berkeley Professor Christina Romer, former chairwoman of the President’s Council of Economic Advisors. (Hat tip Barry Ritholtz at The Big Picture.) I will summarize, but you can read the paper here.

Basically, Romer (with a nod to Krugman, et al.) suggests that Abe and Kuroda have initiated what she calls a regime shift and that "it just might work." And then she proceeds to compare what Japan is doing to the policies of Roosevelt in the early '30s. Quoting from the introduction:

Last week, we witnessed one of the most exciting developments in monetary policymaking since the 1930s. The Japanese central bank staged an honest-to-goodness regime shift. The Bank of Japan went beyond vague promises and cheap talk. As I will describe in more detail later, it took dramatic actions and pledged convincingly to do whatever it takes to end deflation in Japan. The theoretical reasons why this regime shift may be important are well understood by economists. Persistent deflation and anemic growth suggest that Japan continues to suffer from a shortfall of demand. But their policy interest rate is already at the zero lower bound. Furthermore, riskier, long-term rates are also very low – suggesting that unconventional policies such as large-scale asset purchases are unlikely to do much to further reduce nominal rates. As discussed by Paul Krugman, Gauti Eggertsson and Michael Woodford, and others, if unconventional monetary policy can raise expected infl ation, this can push down real interest rates even though nominal rates cannot fall. This, in turn, can raise aggregate demand by stimulating interest-sensitive spending.

And in the conclusion she suggests that bold policies must be aggressively pursued:

In a recent paper, David Romer and I discuss that such views are potentially very destructive. We show that what are widely viewed as the two largest errors in Federal Reserve history – inaction in the wake of banking panics early in the Depression, and inaction in the face of high and rising inflation in the 1970s – were both borne of unwarranted humility. Fear that policies might not work or might be costly led policymakers to conclude that the prudent thing was to do nothing. Yet there is now widespread consensus that action would have been effective in both these periods.

We have nothing to fear but fear itself: this is the heart of Keynesian thinking. And if it is good for Japan then what of the rest of the world?

Earlier in the paper, Romer writes, after discussing recent US Federal Reserve policy actions:

But the truth is even these moves were pretty small steps. With its most recent action, the Fed has pushed the edges of its current regime. And I am sure that given the opposition in Congress and the difference of opinion within the FOMC, even those measures were a struggle. Nevertheless, the key fact remains that the Fed has been unwilling to do a regime shift. And because of that, monetary policy has not been able to play a decisive role in generating recovery. To paraphrase E. Cary Brown's famous conclusion about fiscal policy in the Great Depression: monetary policy has not been a strong recovery tool in recent years not because it did not work but because it was not tried – at least not on the scale and in the form that was necessary to have a large impact.

Wow. Double wow. Breath-taking triple wow. Read this paper. Absorb it. And then bookmark it and come back in five years. I give Romer this: she shows no unwarranted humility in this paper. She goes “all in” in backing this Japanese policy.

But I do agree with Professor Romer about one thing: this is the most serious and radical economic experiment undertaken in my lifetime by a major economic power. And the rest of the world must pay attention. If this has succeeded in working five years from now, if Japan is growing and its debt relative to GDP is shrinking and the rest of the world has allowed the yen to drop in half, then let me state here and now that I will have to rethink my understanding of economics.

But ironically, if I were Abe and faced with the question, “What do I do now with what I have inherited,” I am not sure that I could do anything else. He is a politician and a Japanese one at that. The Japanese are serious hometown players, as are the citizens of most countries. You do what is best for your hometown and don't worry about the neighbors all that much. You want to stay friends, but your first responsibility is the hometown.

If you're Abe, what are your choices? They are nothing but ugly. Perhaps the best of a very, very ugly-bad lot is that you have to try and inflate away that debt. Monetize as much as you can and then just “poof” it away. You destroy your currency in the process, but you have to destroy something. And maybe your derring do gives your exporters a boost and a competitive advantage, so you at least salvage that. Why not export your deflation? And then gamble that maybe Romer and Krugman are right. It could work! Damn the torpedoes, full speed ahead!

There Is No Turning Back

Now, some investing consequences. Let me repeat what I wrote months ago, that the largest single position in my personal portfolio, since January 1, is short Japan. Let me clarify that, as I am not short Japanese companies or businesses but rather short Japanese government economic policies. (I am executing that trade primarily through hedge funds, although there are ways to explore that trade in a more conventional manner.) I think the yen will still be under pressure for some time (this is a long-term trade) and that Japanese interest rates will be under pressure. But do NOT run out and short JGBs (see below)! First, let me agree with Joyce Poon of GaveKal, commenting on the recent violent moves in the financial markets in Japan (which echoes what I heard from Louis Gave at my conference):

No doubt many investors are wondering if this is the first hint that the emperor in fact has no clothes – that Abenomics is just a flash in the pan. We think it is just a reminder that riding a bull is never smooth; surely more market drawdowns lie ahead. But as Anatole recently wrote in The Arithmetic Of Abenomics, the fiscal and monetary expansion already implemented has been so extreme that there is no turning back from Abenomics. Unless Japan can achieve much faster economic growth, Prime Minister Shinzo Abe’s radical experiment with macroeconomic stimulus will create a debt and monetary overhang so huge that it will bankrupt the financial system and quite possibly trigger hyper-inflation. This is why Abe’s radical reforms will go forward, and in time aggressive monetary policy will be need to be backed up by larger structural reforms.

This brings us to a second, and potentially more dangerous, type of volatility in Japan: in JGBs. With Japanese banks holding huge JGB portfolios, a sharp rise in yields would generate capital losses. Indeed, according to the Bank of Japan, a 100 basis point increase in interest rates across all maturities would lead to mark-to-market losses of 20% of Tier 1 capital for regional banks and 10% for the major banks. As banks play a key role in the transmission mechanism in quantitative easing and reflationary economics, a damaged bank balance sheet can significantly reduce the effectiveness of Abenomics.

One problem is that the BoJ’s purchase operation is also crowding out other players in the JGB market, and this amplifies interest rate volatility. The reduction in JGB liquidity means that financial institutions are finding it difficult to quickly find counterparties to buy or sell large volumes of the bonds. The risk is that higher interest rate volatility could in turn induce further JGB sell-offs, completing a vicious circle of capital destruction for the banks.     

To prevent a catastrophic crash of the JGB market, more BoJ action is needed. This is likely to include increased flexibility in liquidity injections, a broader range of purchase tactics and better verbal communication with the market. But shrinking liquidity, higher volatility, and even potential spillovers from rising yields globally, could continue to put upward pressure on JGB yields. This doesn’t mean the Japan bull market is over. But as we argued in our latest Five Corners, remain hedged! 

Let me repeat the most important sentences, with which I totally agree:

… as Anatole recently wrote in The Arithmetic Of Abenomics, the fiscal and monetary expansion already implemented has been so extreme that there is no turning back from Abenomics. Unless Japan can achieve much faster economic growth, Prime Minister Shinzo Abe’s radical experiment with macroeconomic stimulus will create a debt and monetary overhang so huge that it will bankrupt the financial system and quite possibly trigger hyper-inflation. This is why Abe’s radical reforms will go forward, and in time aggressive monetary policy will be need to be backed up by larger structural reforms.

The government of Japan has no choice. They are painting themselves into the Mother of All Painted-In Corners, yet they must continue to paint or collapse. They have fired the first shot in what will be the first real currency war of our lives, not the little sandbox versions we have experienced so far. There is NO historical analogy. None. The last major currency war, in the 1930s, happened when the world was largely on a gold standard. We now live in a world awash in fiat currency. Can Europe sit by and watch the yen fall 50% from where it is today? Will Germany allow it?

What will China do? If they respond in kind, they risk inflation. If they don’t, they risk losing export sales and jobs. Malaysia is on a borrowing binge to finance its real estate growth. Indonesia? And Korea certainly can’t sit idle and watch its chaibols (the Korean version of the Japanese keiretsu) get hammered, can it?

For a time, then, major central banks are going to have to sit on their hands and do nothing, as they can’t stop printing or using monetary policy to improve their internal economic dynamics. Japan is in reality just catching up in terms of quantitative easing, as I showed last week.

Japan intends to export its deflation. And with the approval of the economic cognoscenti, it is going to do so in a manner and to an extent that the world has never experienced before. The old saw of “in for a dime, in for a dollar” will be the rule of the day. Japan cannot back down without suffering massive financial upheaval. I think they are likely to suffer no matter what they do, but this is the path to suffering they have chosen. So be it. All we can do is try and stay off the dance floor when the elephants are dancing. Or find a really good dance partner who knows the moves and follow! This will not be an environment in which to take dancing lessons. The Arthur Murray Dance School does not know the steps that will be in vogue at this party.

I can’t with any reasonable certainty tell you how all this will play out, as we are simply in uncharted territory. But I do know I want to own assets that central banks can’t print. Their actions will affect those assets, to be sure – we are going to see more volatility than we would like. But that creates opportunity. Of course, we are going to continue to look at the implications of these developments in future letters.

In closing, this is the last call to register for the upcoming webinar with my good friends Kyle Bass and Altegris President and CEO Jon Sundt. Kyle will just be back from Japan, where he has been talking with leaders, and I will be in Brussels, trying to get a view on all this from some of their leaders. I can tell you that I have never had a dull conversation with Kyle!

While we are sure to discuss Japan and the yen, we will also focus in depth on a new fund Kyle manages that was recently added to the Altegris platform. Please join us this Wednesday, May 29. If you are a qualified purchaser or a licensed investment adviser qualified to make private placement recommendations, be sure to register here for this event. Upon qualification by my partners at Altegris, you will receive an email invitation. If you are already an existing Mauldin Circle member, you will receive a separate email invitation to register for the event.

I apologize for limiting this discussion to qualified purchasers and investment advisors, but we must follow the rules and regulations. I look forward to having you at this exclusive Mauldin Circle event. (In this regard, I am president and a registered representative of Millennium Wave Securities, LLC, member FINRA and SIPC.)

Brussels, Washington, DC, NYC, Monaco, and Home?

I am probably on a plane to Brussels as you read this, where I will be with Geert Wellens and his team at Econopolis. They have a fascinating few days lined up for me, and I expect to learn a lot as well. The schedule looks to be quite enjoyable.

Then I am home for a few days before I head off to DC to meet with Newt Gingrich and tape a video or two, in which we will talk about our favorite topic, the positive transformation of society that is happening because of technology. Pat Cox will join us. I also have a few other meetings lined up there, and then I'll take a train with John Hussman to NYC to do the video webinar I mentioned at the beginning of the letter. Then I return home for a few weeks and enjoy Father’s Day before heading off to Monaco to speak at the GAIM conference (June 17-19). They have a nice line-up of speakers, and I get to meet with Nassim Taleb. I really do intend to review his new and very important book, Antifragility, at some point. If you qualify as an investor, you can attend for free by clicking on 19th Annual GAIM International 2013. If you are in the money-management business, you can regist er and get a 15% discount with the code VIP: FKN2355MAUL.

Finally, I will go to Cyprus, where I am hoping to meet with people who can give me insights into what is going on there. If you are in Cyprus the weekend of June 22-23, drop me a note.

I am still homeless and living in a hotel but getting closer to actually closing (or so they tell me) on my new apartments. I hope by the time I get back from Brussels everything will be ready to close. I have leased a small place in the same building to live in while my two apartments are combined into one. Construction will take 3-4 months. I am so ready to move. I am used to hotels, but not having access to my “stuff” is getting old, and the internet here is so slow it is driving me to distraction.

It is late and time to hit the send button. Have a great week!

Your looking forward to a better hotel in Brussels analyst,

John Mauldin
See the original article >>

Gold And Silver Markets Provide Us The Best Information

By: Michael_Noonan

We cannot control the markets, but we can control how to respond to what they are saying. The paper market has been turned into a circus, thanks to JP Morgan, and abetted by the exchanges, COMEX and LME. Focus has to remain on the physical market, for it is where one can expect to find true value for price. What everyone has learned is that as price has declined, demand has disproportionately skyrocketed.

We have written extensively on the acquisition of physical gold and silver, regardless of price, because no one can know when the central bankers will lose control and price will erupt like Eyjafjallajökull. The world is in the middle of a huge central bank bubble, of which there are many sub-bubbles, as it were. [Anyone who pretends to believe whatever information is being disseminated by NWO-owned mainstream media, none of which makes any economic sense, and those who do not fully believe, (or at all), what is being said but do not know where else to turn, stay away from all central banks and central planners news or information.]

In addition to creating bubbles that will fail, the Western central bankers, and their puppet governments, are also doing battle with Eastern countries, mostly BRICS, but more and more countries are aligning with them and against the impending demise of fiat regimes. Western central banks are on the losing end, as their fraudulent rehypothecation of gold, several times over, and the virtually depleted reserves now rest comfortably in the hands of Russia, China, India, Turkey, et al, none of which will tolerate any more of the reckless mismanagement of the West. It will not end well for those of us in the Western sphere of influence.

The most coveted of all assets around the world has been gold, on a grand scale, and silver, on a smaller scale, but grand relative to diminishing supply. As we asserted last time, it does not matter what the fundamental picture says, for now, the moving forces are those in control of the paper market, and the populations of Western countries. The power will not be ceded willingly nor readily, so one cannot rely upon the known demand factors, no matter how bullishly presented. That information is already in the market, and it has not created the large mark-up most have been anticipating. It ain't happening, yet.

The paper markets, however much manipulated or disconnected from the physical, are the only barometer available, for now. Under normal circumstances charts, which reflect the market forces, are the most reliable source of information. Here is what they are saying, at this point in time.

In our last article, we said that time was on the side of those currently in control, and it would take longer than most expect before gold and silver will reach previous highs and yet higher, after that, [The True Story Is About Time, http://bit.ly/12iELsC]. In another previous article, we explained how wide range bars can lead to range control for several more bars to follow, and longer, [It Could Get Uglier And Take Longer, click on http://bit.ly/18AlO9G], and we will give more examples of why any recovery will take more time.

The one caveat would be a V-type bottom, when price takes off from a low. Because Anything Can Happen, and no one knows in advance how a market will unfold, it is mentioned as a possibility.

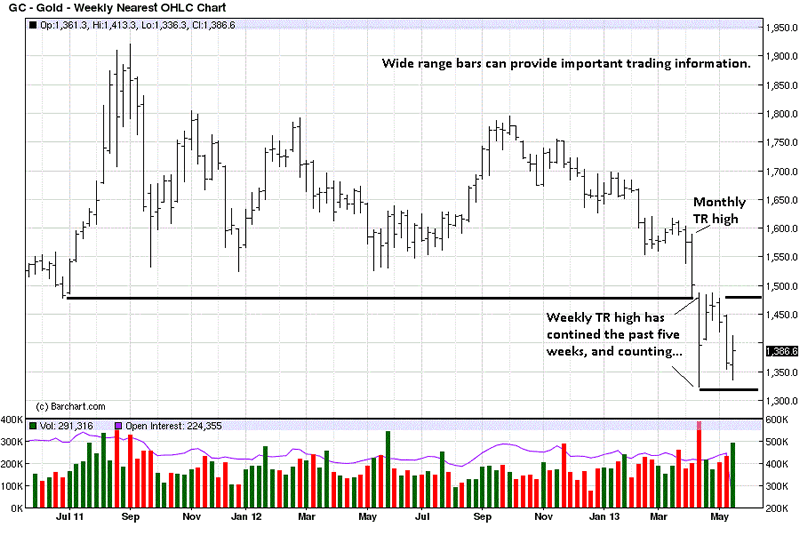
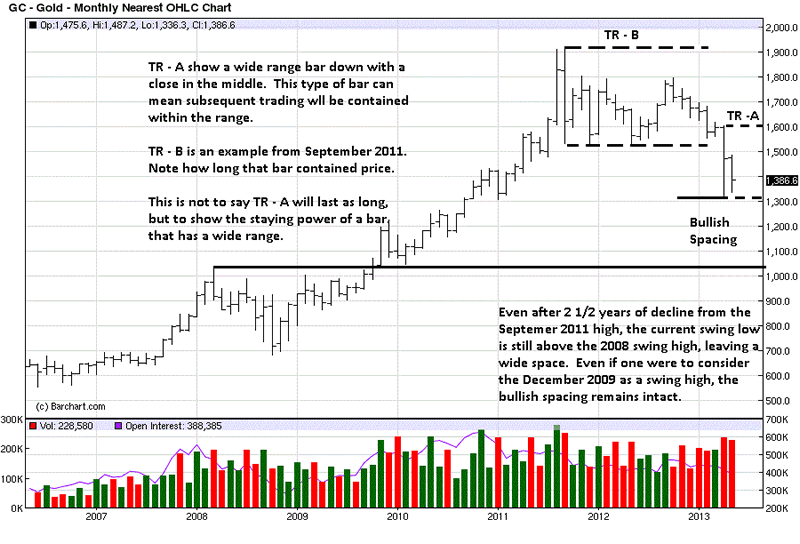
Trading Range, [TR], - A, shows the wide range bar from April, and the close is mid-range the bar. Very often, that bar's range will contain price behavior for several bars into the future. TR - B is pointed out to demonstrate that an ensuing TR can take quite some time. Going into the last week of May, the range has been under the close of April, telling us the attempt to rally has been weak.

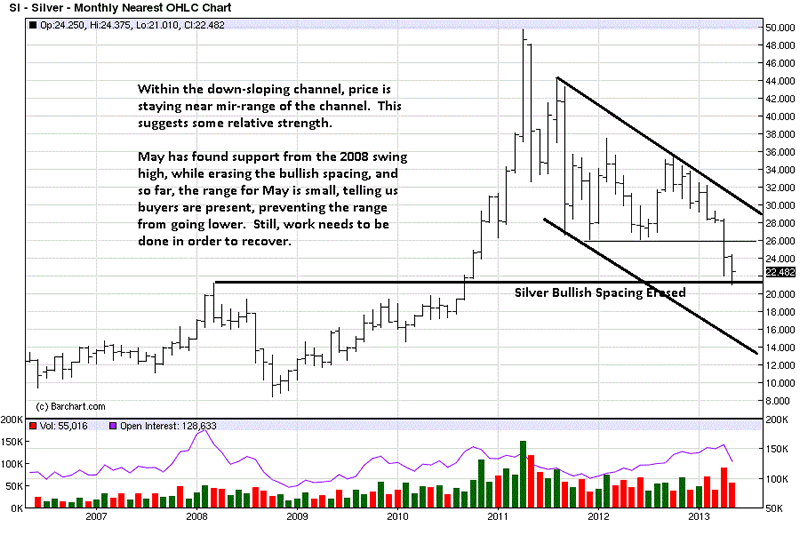
Even with the sharp decline from last month, and the overall decline since September of 2011, there is still bullish spacing. It occurs when the current swing low is above the last swing high, from 2008. It tells us that buyers have been willing to buy into the market without waiting to see how the last swing high will be tested, an overall bullish condition.

Gold Monthly Chart

The importance of a wide range bar is that it tells us of the likelihood of a trading range. One can either sell the top of the range and buy the bottom of the range, or wait, knowing that the market is unlikely to rally higher or break lower, for an unknown period of time and then follow the breakout.

You can see how price has already spent five weeks within the wide range bar with a close in the middle. The high of the range has provided resistance, and the lower portion has been support. Last week's close was in the upper portion of that range, telling us buyers were in control at lower price levels.

Keep in mind, however, that the trend remains down, and the onus is on buyers to show a change in strength. We do not see that, yet, but this is the paper market. Buyers have amply demonstrated demand in the physical market, but it is no avail, for now.

Gold Weekly Chart

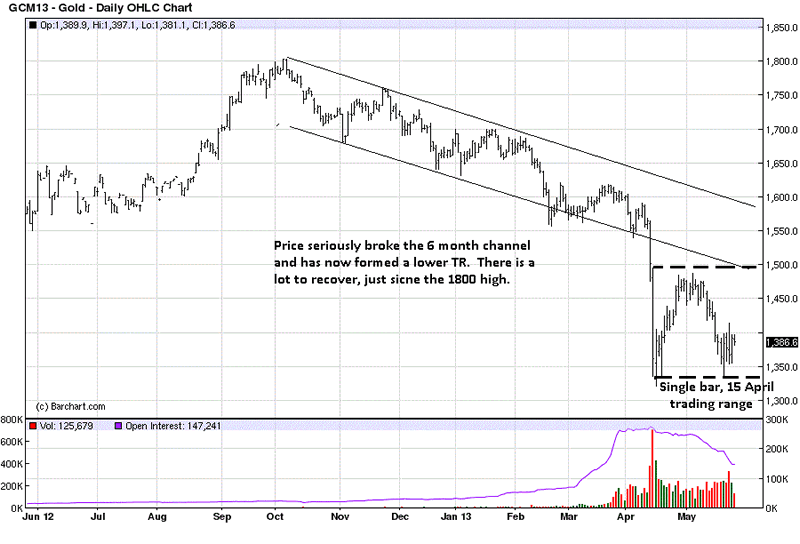
The wide range bar scenario is uniformly persistent over all three time frames. The daily activity looks weakest of all, but still within the range parameters described. Using the "knowledge of the market," from the low of the range, we did use it to advantage to make a short-term trade off the lows, with success. It was an against-the-trend-trade, but we used the smaller time frames and the knowledge that the lower end of the TR would be support, as a basis for it.

Gold Daily Chart

Silver tells a more interesting story. It has been weaker than gold, but the current developing market activity shows promise within a weakened environment. Bullish spacing has been eliminated, and the swing high from 2008 has proven to be support, at least for now.

We drew down sloping channel lines, and interestingly, silver is holding above the 50% of the channel range, not going to the bottom demand line. The underlying implications are bullish, within the context of a prevailing downtrend. It does not mean one should be buying futures, based on this, just that price is holding relatively well in a bear market.

Entering the last trading week for the month, at this late date, the range is relatively small, which tells us that buyers are meeting the efforts of sellers, preventing sellers from moving price lower. It does not mean price will not go lower before month's end, but based on the facts available, it is a positive sign. It could take more time for buyers to turn the futures market around, but it has to start from somewhere.

Silver Monthly Chart

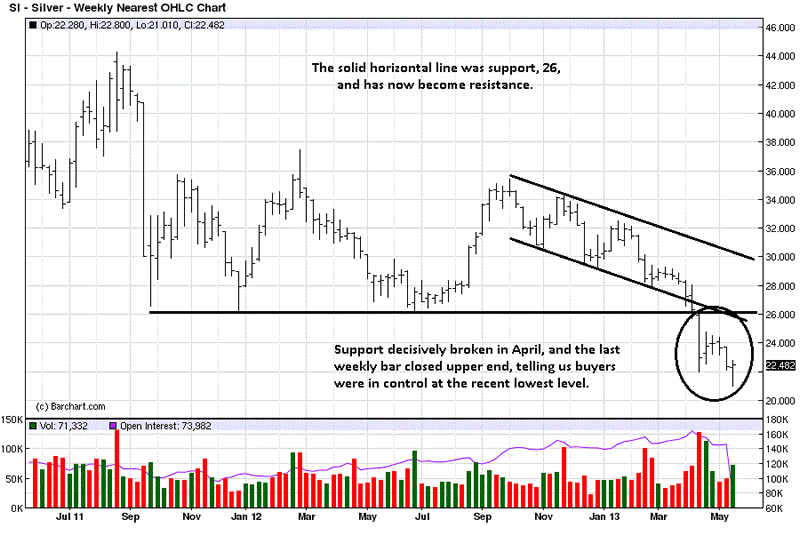
Wide range bars are not inviolate, evidence by the weekly chart. Price did go under the low of the wide range bar, but note the location of the close, at the high of the bar and just above the last week's low-end close of a selloff week.

Siver Weekly Chart

The chart comments relate the current daily activity. Just like TRs reveal important high/low information, failed probes also provide clues about the character of the market. The 3 points made explain what the clues are. The lack of continuation higher speaks to the overall trend being down, weighing on attempts to rally.

We continue to recommend buying the physical, regardless of price, and be very selective if/when trading the futures.

See the original article >>

Cattle Outlook: Retail choice beef up 9% over past 2 years

by Ron Plain and Scott Brown

Today's Cattle on Feed report says the number of cattle in large feedlots at the start of May was down 3.4% from a year ago. April placements were up 15.1% and April marketings were up 2.2%, due to one extra slaughter day.

The average price of choice beef at retail was $5.264 per pound in April. That was down 3.6 cents from March, but up 27.8 cents from April 2012. The average retail price for all fresh beef was $4.853 per pound in April, up 23 cents from a year earlier. Over the last 24 months, the average price of choice beef at retail has increased 9.2%. The average retail price for all fresh beef is also up 9.2%. This implies the demand for choice beef is as strong as for select and ground beef.

The 5 area average price for slaughter steers in April was $127.50/cwt, up a dollar from the month before and up $6.30 from April 2012.

Corn planting is still way behind normal. As of May 12, 28% of corn acres were planted compared to 85% a year ago and a 5-year average of 65% planted by May 12.

Fed cattle prices were lower this week. Through Thursday, the 5-area average price for slaughter steers sold on a live weight basis was $124.79/cwt, down $1.43 from last week, but up $3.36/cwt from the same week last year. Steer prices on a dressed basis averaged $199.76/cwt this week, down $2.98 from a week ago, but up $6.10 from a year ago.

The beef cutout value for choice carcasses reached $200/cwt for the first time two weeks ago and continues to climb. This morning, the choice boxed beef carcass cutout value was $208.96/cwt, up $3.41 from the previous Friday and up $16.45 from a year ago. The select carcass cutout is at $192.52/cwt, up $1.41 for the week. The choice-select price spread is $16.44/cwt, the most since December.

This week's cattle slaughter totaled 652,000 head, up 3.3% from last week and up 1.2% from a year ago. The average steer dressed weight for the week ending on May 4 was 839 pounds, down 1 pound from the week before, but up 7 pounds from a year ago. This was the 69th consecutive week with average steer weight above the year-earlier level.

Oklahoma City feeder cattle prices were $2 lower to $2 higher this week with prices for medium and large frame #1 steers: 400-450# $168-$171, 450-500# $162-$169, 500-550# $150-$169, 550-600# $141-$156, 600-650# $139.25-$151.50, 650-700# $135.50-$143.50, 700-750# $130-$137, 750-800# $131-$135, 800-900# $119-$132.75, and 900-1000# $116-$123.25/cwt.

The June live cattle futures contract closed at $119.40/cwt today, down $1.15 from last week's close. The August fed cattle contract lost $2.22 from last Friday to settle at $118.55/cwt. October fed cattle futures settled at $121.97/cwt.

May feeder cattle futures settled at $133.90/cwt, down $1.47 for the week. The August contract lost $3.25 to close at $143.37.

See the original article >>

Soybeans head for longest rally in 14 months on Chinese imports

By Jeff Wilson

Sharing Services 0

Soybean futures headed for the longest rally since March 2012 on signs of rising demand from China, the world’s largest buyer.

China bought 531,000 metric tons of U.S. soybeans in the week ended May 16 for delivery after Sept. 1, and an additional 115,000 tons of purchases overnight, government reports showed today. Sales last week for delivery before Sept. 1 rose nearly 12-fold to 183,480 tons, and inventories before this year’s harvest will drop to the lowest in nine years, U.S. Department of Agriculture data show. Exports of soybean meal since Oct. 1 are up 33% from the same period a year earlier.

Prices have jumped 8.8% in May, heading for the biggest monthly rally since July, when the worst U.S. drought since the 1930s eroded production and sent soybeans to a record $17.89 a bushel in September. While the USDA forecasts this year’s harvest will jump 12% to a record, farmers in the Midwest won’t collect most of those crops until October.

“China is buying, and that has put a strong bid into the futures market,” Jim Gerlach, the president of A/C Trading Co. in Fowler, Indiana, said in a telephone interview. “Meal exports are superb, and that’s a problem with U.S. soybean supplies falling.”

Soybean futures for July delivery jumped 1.9% to $15.2225 a bushel at 12:38 p.m. on the Chicago Board of Trade, after touching $15.4675, the highest since Nov. 2. Prices are up for a sixth straight session, the longest rally since March 2, 2012.

Soybean-meal futures for July delivery gained 1% to $445 for 2,000 pounds on the CBOT, after touching $451.40, the highest since Dec. 18.

China Imports

China’s soybean imports will start surging from this month and jump 17% in the season beginning Aug. 1 to 68 million tons, Hamburg-based researcher Oil World said May 21. U.S. reserves on Aug. 31 will shrink to 125 million bushels, the lowest since 2004, the USDA predicted on May 10. As a percentage of consumption, inventories will be the smallest since at least 1961.

Prices also rose on speculation that new rules from China to control capital inflows may end commodity-financing deals, forcing the country’s importers to buy futures to lock in purchases, Gerlach said. The National Business Daily reported yesterday some banks have stopped issuing letters of credit for copper importers after a government crackdown on hot-money flows.

“Talk that Chinese crushers are buying futures to lock in shipments because of the crackdown on financing is adding to the surge in prices today,” Gerlach said. “The only way to ration supply is to make it uneconomical to use the commodity. Clearly, we are not there yet.”

See the original article >>

Just Because You Can, Does Not Mean You Should.

By Charles Rotblut

I want to start with a short comment about Japan before moving onto the main subject of this week’s newsletter. As you probably heard, the Topix index plunged almost 7% just yesterday, the biggest drop since 2011’s earthquake and resulting tsunami. According to both Bespoke Investment Group and James Mackintosh of The Financial Times, this was also just the ninth time in the past 50 years that the Nikkei has fallen by more than 7% on a single day. (The Nikkei encompasses 225 stocks; the Topix tracks about 1,700.)

The drop was blamed, in part, on disappointing economic news from China and rising interest rates. Another contributing factor was the magnitude of this year’s rally in Japanese stocks. Even after today’s drop, the Topix is still up 2% this month and up 38% year-to-date, according to Bloomberg News. Volatility goes in both directions, and today was an example of downside volatility occurring after a large degree of upside volatility.
Prior to today’s Japanese market action, I had intended to start today’s commentary with the words, “Just because you can, doesn’t mean you should.” It is a phrase I find myself occasionally tweeting after hearing about a new investment product or strategy, such as a new specialty fund. There is a never-ending list of new products and revived investment ideas whose risks are capable of derailing your long-term plans.
Two of the most recent ones involve real estate and pension and settlement income streams.

CNNMoney published an article on Monday discussing how some investors are using their retirement savings to make investments in real estate. Not in real estate investment trusts (REITs), but directly in individual properties. My presumption is that the practice is not widespread, but there are enough people doing it to prompt an article on a popular website.

For a small portion of the population, direct investments in real estate can make sense. I have two friends who fit into this category. One spent years working for a major homebuilder before starting his own homebuilding business. The other not only had parents who owned rental properties, but also managed rental properties on his own before using his retirement savings to finance the purchase of an apartment complex.

Those of you without these types of backgrounds should tread carefully when investing in real estate. Buildings and land are comparatively illiquid relative to stocks, REITs and funds. Transaction costs are high. Buildings require upkeep. Mortgage payments, insurance, property taxes and any association fees require a constant outflow of cash, regardless if the property is rented or not. Add in the other potential headaches, such as bad tenants and late repair calls, and it becomes clear that considerations other than price appreciation must be factored into the decision process.

There is also a risk if retirement savings are used to fund the down payment on one’s home. If the house falls in value or fails to appreciate faster than the stock market over the long term, a sizeable opportunity cost occurs. If a 401(k) loan is taken, tax liabilities are created if the loan is not repaid by the time the person leaves their job.

The second is pension and settlement income streams, which the Securities and Exchange Commission (SEC) and FINRA recently published an alert about. Often pitched as pension loans, pension income programs, mirrored pensions, factored structured settlements or secondary-market annuities, these are investments intended to provide a stream of income based on someone else’s pension or lawsuit settlement.

The appeal of these investments is the 5.75% to 7.75% yield. The downsides are the high transaction costs, the difficulty of selling them, the risk you may not be paid and the risk that the agreements may not even be legal. In other words, these can be investments that are too good to be true.

Like real estate, buying and selling receivables and cash flow streams (a practice referred to as “factoring”) can be profitable if you know what you are doing, have the contacts and have enough capital to build a diversified portfolio. Factoring can be a challenging business for those who have experience doing it; it is very risky for an investor looking to buy a stream of income from a middleman.

There will always be investments that sound appealing. However, some investments are often pitched to benefit the seller or the company facilitating the transaction, not the investor. This is why just because you can buy an investment, does not mean you should. 


The Week Ahead

The U.S. financial markets will be closed Monday in observance of Memorial Day.

Just four S&P 500 member companies will report earnings next week: Tiffany (TIF) on Tuesday, Joy Global (JOY) on Thursday, and Costco Wholesale (COST) and Pall Corp. (PLL) on Friday.
The week’s first economic reports will be the March S&P Case-Shiller Housing Price Index and the Conference Board’s May consumer confidence survey. Both will be released on Tuesday. Thursday will feature the April pending home sales index and revised first-quarter GDP. The final May University of Michigan consumer sentiment survey, April personal income and spending and the May Chicago PMI will be published on Friday.
The Treasury Department will auction $35 billion of two-year notes on Tuesday, $35 billion of five-year notes on Wednesday and $29 billion of seven-year notes on Thursday.

See the original article >>

Can The U.S. Grow by Printing More Money?

By Michael Lombardi

A recession for the global economy is becoming an increasingly likely scenario.

The Chinese economy, the second-biggest in the world, witnessed a contraction in manufacturing in May. The HSBC Flash China Manufacturing Purchasing Managers’ Index (PMI) registered 49.6 for May, declining from 50.4 in April. (Source: Markit, May 23, 2013.) Any number below 50 represents contraction in the manufacturing sector.

The Chinese economy exports a significant amount of what it produces to the global economy. Contraction in Chinese manufacturing shows exports are falling—the global demand for goods is falling.

Similarly, Germany’s Flash Manufacturing PMI showed continuous contraction in the manufacturing sector. The index stood at 49.0 in May. (Source: Markit, May 23, 2013.) The German economy is important to observe, because it’s the largest economy in the eurozone and an economic slowdown in the nation can send the common currency region into another downward spiral, again affecting the global economy.

Looking at other key indicators, they are pointing to an economic slowdown ahead in the global economy. Consider the copper market. Demand for copper is suggesting activity in the global economy is sluggish, even deteriorating.

Copper prices are down more than 10% since the beginning of 2013, and stockpiles of the brown metal, tracked by the London Metals Exchange (LME), are up a staggering 95% this year! (Source: Bloomberg, May 23, 2013.)

Other industrial metal prices, such as aluminum, lead, nickel, and zinc, are in decline as well.

How can the U.S. economy possibly improve when the global economy is in trouble?

The U.S. is highly affected by any shift in demand in the global economy.

After the financial crisis of 2008, U.S.-based companies were able to show growth because of robust demand in the global economy. Some say the growth in the global economy pulled the U.S. out of recession in 2008.

Now, the economic indicators clearly point to diminishing global demand. Will U.S.-based multinational companies be able to show profit growth under the scenario of global manufacturing contraction? Of course not! (Someone tell stock market investors!)

During the first-quarter earnings reporting season, some of the biggest big-cap companies in the key American stock indices displayed concerns regarding the crisis in the eurozone. I expect more companies to start blaming the economic slowdown in the global economy as they report lower second-quarter corporate earnings.

Michael’s Personal Notes:

As I have been writing in these pages, economic growth in the U.S. economy won’t happen by printing more paper money—it’s a short-term fix that creates more long-term problems.

According to data compiled by Bloomberg, 2,267 non-financial constituents of the Russell 3000 index saw their cash holdings increase by 13% to $1.73 trillion in the first quarter of 2013 compared to the same period a year earlier. (Source: Bloomberg, May 23, 2013.)

As the cash hoard continues, business spending declined 21% in the first quarter compared to the last quarter of 2012. This was the biggest decline since the financial crisis of 2008.

To top this off, business executives in the U.S. economy are worried about troubles in the global economy, and they don’t have a very optimistic view on conditions here at home. A CEO Confidence Survey conducted by the Conference Board suggests only 29% of executives believe conditions in their industries have improved in the first quarter; going forward, only 32% expect the U.S. economy to improve in the next six months. (Source: Conference Board, April 25, 2013.)

Looking at all of this, how can you not question the effectiveness of quantitative easing in the U.S. economy? The problem at hand is businesses shying away from spending in the U.S. economy and hoarding cash. To my standards, quantitative easing is failing at making businesses more confident about spending as it was promised.

Dear reader, for economic growth to take place in the U.S. economy, businesses must be willing to spend and make investments; we are seeing the opposite of that. This isn’t rocket science; once businesses start to spend and make investments, we will see recovery in the jobs market and economic growth will eventually follow.

The U.S. economy is at a vulnerable stage. I am paying extra attention to business spending because troubles from outside the U.S. economy are brewing quickly, and as a result, multinational businesses may make further cutbacks on their spending.

Where the Market Stands; Where It’s Headed:

We are putting the finishing touches on “A Dire Warning for Stock Market Investors,” a forecast we will present in video format. Please see your e-mail inbox tomorrow for this presentation. It’s important you watch it to see where the stock market is really headed next.

What He Said: 

“As for the stock market, it continues along its merry way oblivious to what is happening to homebuyers’ wealth. (Since 2005 I have been writing about how the real estate bust would be bigger than the boom.) In 1927, the real estate market crashed and the stock market, even back then, carried along its merry way for two more years until it eventually crashed. History has a way of repeating itself.”  ~ Michael Lombardi in Profit Confidential, November 21, 2007.

This was a dire prediction that came true.

See the original article >>

The Headline Data that Financial Media Ignored on Wednesday

by J.W. Jones

Wednesday was a wild trading session where we saw the largest intraday selloff in the S&P 500 E-Mini futures that we have seen in some time. Intraday price action was driven largely by statements made by Chairman Bernanke and the release of the Federal Reserve Meeting Minutes which saw some monster intraday moves and a large spike in the Volatility Index (VIX).

While the world is focused on when the Federal Reserve is going to taper their Quantitative Easing program and the impact those actions will have on financial markets, I wanted to look at another divergence in the economic data which is supported by market action.

Instead of trying to determine how or when the Federal Reserve will taper or end their monetary experiment, I wanted to juxtapose statements that were made today with the actual facts. Readers can draw their own conclusions.

Recently, we have been told that the housing market is in the early stages of recovery. Unfortunately due to low interest rates housing has turned back into a speculative market. Consequently, a lot of so-called fast money is flowing into housing which in many cases is either being purchased for rentals or by foreign investors as a speculative investment.

At present the housing market is not being driven by capital formation at the household level and data indicates that construction jobs are under pressure and affordability is reversing. The chart below illustrates what has recently transpired in the 10 Year Treasury Yield:

Chart1(1)

As can be seen above, the 10 Year Treasury yield has risen considerably since the beginning of the month of May. Normally when interest rates are rising and Federal Reserve policy is indicating that a form of tightening seems likely we typically see a rush of mortgage applications and home starts as borrowers try to lock in lower interest rates. Furthermore, the spring and early summer months are generally considered a very favorable time to sell existing homes in the United States.

In light of all of the above mentioned facts paired with our Federal Reserve Chairman stating that housing is starting to recover, readers would expect that housing starts and mortgage applications would be jumping higher.

Unfortunately the mortgage application data came out on a day when the Federal Reserve was controlling the headlines. The mortgage application data indicated the largest 2-week rate of decline in mortgage applications since the housing bubble popped.

Furthermore, this is supposed to be a strong seasonal time for real estate and interest rates are rising as shown above. If readers look at recent price action in the Spiders Homebuilders ETF (XHB) or Home Depot (HD) it would appear that all is well in the land of housing and Chairman Bernanke and the Federal Reserve are spot on with their bullish analysis.

Chart2(1)

Until the past few trading sessions, the homebuilders have been in an obvious bullish run to the upside. The rally that transpired since the late February 2013 lows tacked on close to 20% gains in XHB. However, as noted above, the past few trading sessions’ price action appears to have stagnated and we saw new recent lows on Wednesday.

Home Depot (HD) is another stock that relies heavily on home construction and improvement and would likely benefit from both new home building and existing home purchases which typically require immediate customization or improvements. The recent price action in Home Depot is shown below.

Chart3(1)

Home Depot has had an impressive rally since the beginning of 2013. HD has tacked on over 20 points on its share price representing a near 30% move higher year to date. However, exuberance on Tuesday after earnings were released saw a spike Wednesday morning which was promptly reversed intraday.

Based on the recent price action in both the homebuilders ETF (XHB) and Home Depot (HD) readers would tend to agree with Chairman Bernanke that housing was recovering and that the recent mortgage application decline was merely “transitory.”

However, there is one eye-opening concern that does not support Chairman Bernanke’s position about a housing recovery and unfortunately points to less demand in the immediate future. While many investors do not track lumber prices, the chart below demonstrates the sheer bear market that has befallen lumber futures prices.

Chart4(1)

As can be seen above, random length lumber futures have gotten crushed to the downside over the past two months. In early March, lumber futures were trading up around the 410 price point. At the close on Wednesday, random length lumber futures closed at 305.20, a more than 25% drop in price in roughly 2 months.

How is housing rebounding with lumber prices falling? While Home Depot sells many products, most major remodeling projects and even smaller upgrades require the purchase of lumber. Have logging companies discovered an untapped lumber resource?

I will let readers decide whether to believe the price of lumber and mortgage application data or a Federal Reserve Chairman that declared on January 10, 2008 that “The Federal Reserve is not currently forecasting a recession.”

For those paying attention, the macroeconomic data is crumbling in the United States and Europe. The printing press and monstrous liquidity can only fuel markets for so long. Can Chairman Bernanke and the Federal Reserve print Cap-EX spending increases and rising profitability? I think we all know the answer. In the end, when the Federal Reserve is printing $85 billion dollars per month to buy U.S. government debt perhaps fundamentals are largely irrelevant.

See the original article >>

Apocalypse, not yet

by The Economist

Bond yields are very low, but Japan’s example shows they may stay low

IS THERE a bond bubble and is it going to burst soon? The Spectator, a British political weekly, ran a cover story citing the existence of a bubble back in September 2011. Yields are even lower now than they were then.

Calling the top of an asset bubble is extremely hard, as sceptics of the dotcom boom in the late 1990s will recall. History suggests that buying government bonds at yields of 2% or less is a losing proposition in real terms; those who bought American Treasury bonds on a yield of 2% in 1945, for example, did not see a gain in their purchasing power until 1989.

But there is one important exception to the rule. Japanese ten-year bond yields fell below 2% in 1998 and have stayed below that level almost ever since. Thanks to deflation, investors have still managed to earn positive real returns. Betting against the Japanese bond market has been a losing game.

In a sluggish economy, it is quite plausible that rates will stay low. Paul Krugman, an American economist, points out that bond yields are essentially a forecast of future short-term rates. Since a return of these rates to pre-crisis levels (4-5%) looks highly unlikely in the near future, there can hardly be a bond bubble.

Others see the recent rise in bond yields as a sign that the tide is turning, particularly in Japan. But as the chart shows, yields have only pushed up from remarkably low levels. In Germany and Japan yields are still lower than they were at the start of 2012. Abenomics, and the 2% inflation target, must have encouraged some Japanese investors to sell bonds and switch to equities (a sell-off on May 23rd came only after a long rally); foreigners may also be less keen to buy Japanese bonds while the yen is sliding. At any rate, the vast scale of the Bank of Japan’s quantitative-easing programme means that the authorities have plenty of firepower to drive yields back down again, if they feel these have risen too far.

The apocalyptic view of government-bond markets is that a combination of high fiscal deficits and central-bank money-printing will eventually cause a rapid rise in inflation. This may prove to be true in the long run, but there is little sign of it yet. Inflation rates are generally falling and the same is true for inflation expectations, as measured by the gap between the yields on conventional and inflation-linked bonds. In fact, Japan’s economic policy might act as a deflationary force in the rest of the world, since the lower yen will allow Japanese exporters to undercut their competitors. Albert Edwards, a strategist at Société Générale who has been pushing his “ice age” thesis of falling bond yields and lower equity valuations since the late 1990s, argues: “We are now only one short recession away from Japanese-style outright deflation.”

The big fall in government-bond yields has had a similar impact on corporate borrowing costs. The polite term for junk bonds, the riskiest part of the market, used to be “high-yield”, but that is now a misnomer. American firms without an investment-grade rating borrow at less than 5%—a record low. As Jeremy Stein of the Federal Reserve noted in February, speculative elements have returned to the markets, including “covenant-lite” loans and payment-in-kind debt (where interest is paid not as cash but as more debt). Bond issuance has boomed, with $1.2 trillion-worth of bonds sold in the first four months of the year, according to Standard & Poor’s, a ratings agency.

Still, a recent research paper by Moody’s, a rival to S&P, argues that all this is not necessarily evidence of a bubble. First, the spread, or excess interest rate, paid by companies compared with governments is not as low as it was in 2006-07, when most people think a credit bubble emerged. Second, companies have been issuing bonds as a way of refinancing previous debts, rather than gearing up their balance-sheets. Third, corporate default rates are low by historic standards and, particularly in America, profits are holding up well.

Nevertheless, corporate bonds are inherently more vulnerable than government debt. If the world does shiver in Mr Edwards’s ice age, government bonds will keep their appeal but defaults on corporate bonds will rise. And if the inflationary school is right, corporate bond yields will soar (and prices plummet) along with government bonds.

So bond investors might face apocalypse, but predicting timing is tricky. A surge in inflation, a sudden change in central-bank policy and (for corporate debt) a relapse into deep recession could prove ruinous. But probably not this year.

See the original article >>

Platinum and Palladium: A Fundamental Shift

By: Jeff_Clark

Platinum is a precious metal, as is palladium, though to a lesser degree. However, like silver, both are also industrial metals. Unlike silver, it's their industrial use that is the primary price driver for both platinum and palladium – and that use is undergoing a fundamental shift.

The largest source of demand for platinum and palladium is the automotive industry, for use in autocatalysts. In turn, the fortunes of the auto industry are sensitive to the health of the world's major economies. We've been bearish on platinum-group metals for years, primarily because we weren't convinced a healthy – much less roaring – world economy could be sustained when so many governments continue spending beyond their means.

We reconsidered the market last year, when strikes in South Africa – home to 75% of global platinum production and 95% of known reserves – threatened supplies. But as we wrote last December, the strikes ended without great impact on long-term supply.

Since then, however, the fundamentals of this market have changed. Others may disagree with our economic outlook, which is still bearish, but it's due to supply issues – not demand – that our interest is now drawn to these metals, and particularly to palladium.

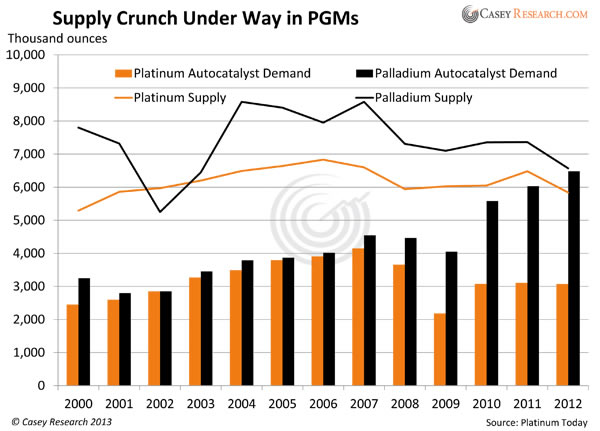
Here's a look at global supply against auto-industry demand for both metals.

Approximately 55% of platinum and the bulk of palladium supply was used in catalytic systems last year. The shrinking supply that's under way with both metals is obvious, and palladium is approaching a supply/demand crunch.

Here's what's going on…

Platinum

The fall in platinum supply has been so great that it moved from a surplus in 2011 to a deficit in 2012, with Johnson Matthey estimating that deficit to hit 400,000 ounces, the highest level since 2003.

Why the shift?

  • Labor strife and power outages. The mining industry in South Africa is, frankly, a mess. Labor strikes continue to haunt the platinum mining companies. The largest mining union in South Africa, AMCU, recently refused to sign a collective bargaining agreement on worker compensation, and CNBC is predicting a massive strike. Amplats, the world's largest platinum producer, is threatening to cut 14,000 jobs and mothball two operating mines due to various issues. Meanwhile, power outages, a longstanding problem, continue unresolved; they have already forced the closure of some mines and are widely expected to cause further cuts in production. As a result, supply from mining is expected to decline another 10% this year.
  • Recycling. This important source of supply is falling in reaction to lower metals prices. It is estimated that recycling fell by 11% in 2012.
  • Emission systems. Demand for platinum in autocatalysts dropped by 1% in 2012, mostly due to lower vehicle production in Europe and lower market share of diesel engines. However, emission-system demand from Japan and India is expected to increase, and diesel-emission controls recently introduced in Beijing will also support industrial demand for both metals. Auto sales in China rose a whopping 19.5% in the first two months of the year and are 6.5% higher in the US than a year ago.
  • Jewelry. Worldwide demand for platinum jewelry rose last year, with strong demand coming from China and growth in India, and is mainly the consequence of lower prices. Jewelry accounts for 30% of total platinum demand.
  • Investment. Although it represents just 6% of total demand for the metal, investor demand nonetheless grew 6.5% last year, adding to pressure on supplies.

Given these factors – primarily the first one – a supply deficit stretching into 2014 seems almost certain. Until South Africa can resolve its labor and power issues, pressure on platinum supply will remain, producing a favorable environment for rising prices.

Palladium

Palladium, platinum's "little brother," also faces a market imbalance. In 2012, the deficit totaled 915,000 ounces, the highest level since 2001.

  • Supply. Russia is the second-largest producer of palladium, and some analysts report that rumors of its stockpile being close to depletion are true. Recycling is also falling, and production disruptions in South Africa – the largest producer of palladium – are the same as outlined for platinum. Overall supply of the metal is falling.
  • Demand. Autocatalytic demand rose by 7% in 2012, as palladium can be easily substituted for platinum in emission-control systems for gas-powered motors (but not diesel-powered ones), such as are favored in China and India. In fact, several experts we consulted were more bullish on palladium than platinum due to this "substitution factor" – and China just mandated catalytic systems for all cars in the country.

Palladium investment demand was positive last year, though palladium jewelry has yet to gain traction in China, one of the world's biggest jewelry markets. Total jewelry demand for palladium was 11% lower in 2012. However, we expect a greater shift to palladium in the expanding Asian automotive market, which in turn will boost palladium prices.

The fundamental drivers of the palladium market are similar to those for platinum, which makes the palladium market an equally attractive investment.

If this all weren't bad enough, most companies' production costs are now above current platinum and palladium prices. This can only be solved one way: higher metals prices.

Bottom Line

The supply disruptions in South Africa combined with secondary factors have led to deficits in both metals that won't be erased overnight. Such imbalances, together with mainstream expectations of global economic growth, create a favorable environment for PGM price appreciation.

This much seems like a safe bet. There is, however, a great deal of speculative upside in the not-inconceivable case of South Africa going off the rails in a major way. Massive – not marginal – supply disruptions in the world's main source of both metals would send their prices through the roof. You get this speculative potential "for free" when you bet on the more conservative projections that call for rising prices regardless.

See the original article >>

Japan - A Few Thoughts On The "Crash"

by Lance Roberts

CNBC:  Global Markets Roiled by Nikkei's 7.3% Slide  "Financial markets around the world were roiled Thursday after Japanese stocks suffered their biggest slide since the country was hit by a devastating tsunami more than two years ago.  Several reasons have been blamed for the 7.3 percent fall in the Nikkei index to 14,483.98, including a spike in Japanese government bond yields and unexpectedly weak Chinese manufacturing figures."

That was the news that dominated the financial headlines today around the globe this morning.  However, while the selloff was certainly large in magnitude, the largest since the nuclear disaster in 2011, it must be put into some sort of context.  The chart below shows the Nikkei 225 going back to 1981.

Nikkei-MarketExtremes-052313

There are numerous points that are worthy of consideration:

1) While the Nikkei has had a parabolic rise since the implementation of "Abe-nomics" the current rally failed at the long term downtrend resistance.

2) As shown in the callout - while the Nikkei did suffer its largest drawdown since 2011 it has hardly registered a blip when compared to the entirety of the recent advance.  If this did indeed mark the top in the Nikkei the correction still has a long way to go just to reach the 12-month average.

3) The rise in the Nikkei pushed the markets well beyond 3-standard deviations above the 12-month moving average which is simply unsustainable.  As with the U.S. markets - such extensions will ultimately lead to a reversal.  However, reversals do not occur without a catalyst.  The problem is that by the time you realize what the catalyst is - it will be too late to react.

4) The extreme divergence from the 12-month moving average, as shown at the bottom of the chart, is at levels that have normally been associated with major market tops.   While such extreme deviations are important it does not mean that the markets are going to crash immediately.  It does mean, generally speaking, that the majority of the advance is already complete and the risks, without a correction first, outweigh the potential for returns.

The Big Picture

While Japan has entered into an unprecedented stimulus program (on a relative basis twice as large as the U.S. on an economy 1/3 the size) there is no guarantee that such a program will result in the desired effect of pulling the Japanese economy out of its 30-year deflationary cycle.  The problems that face Japan are similar to what we are currently witnessing in the U.S.:

  • A decline in savings rates to extremely low levels which depletes productive investments
  • An aging demographic that is top heavy and drawing on social benefit schemes at an advancing rate.
  • A heavily indebted economy with debt/GDP ratios above 100%.
  • A decline in exports due to a weak global economic environment.
  • Slowing domestic economic growth rates.
  • An underemployed younger demographic.
  • An inelastic supply-demand curve
  • Weak industrial production
  • Dependence on productivity increases to offset reduced employment

The unanswered question remains as to whether, or not, monetary policy can generate economic recovery.  The world's central banks have "bet it all" that it will indeed work.  The problem, as is always the case is such monetary experiments, remains the unintended consequences.

The lynch pin to Japan, and the U.S., remains interest rates.   If interest rates rise sharply it is effectively "game over" as borrowing costs surge, deficits balloon, housing falls, revenues weaken and consumer demand wanes.  It is the worst thing that can happen to an economy that is currently remaining on life support.  Japan, like the U.S., is caught in an on-going "liquidity trap"  where maintaining ultra-low interest rates is the key to sustaining an economic pulse.  The unintended consequence of such actions, as we are witnessing in the U.S. currently, is the ongoing battle with deflationary pressures.  The lower interest rates go - the less economic return that can be generated.   An ultra-low interest rate environment, contrary to mainstream thought, has a negative impact on making productive investments and risk begins to outweigh the potential return.

Japan-InterestRates-Vs-US-052313

The mistake that Japan is likely going to make is believing that if they can generate some inflation for the economy that they will have the ability to cap it at 2%.   This is beyond naive and is likely to end very badly.   The following video from Christine Hughes sums the entire situation up very well and is worth watching in its entirety.


The point here is that the current blip in the Nikkei is likely going to be short lived as liquidity injections continue to artificially inflate assets.  However, as in the U.S., parabolic rises in asset prices eventually lead to extreme corrections.  If the "grand experiment" in Japan does indeed fail, which is what I suspect will eventually happen, the ramifications on the U.S. markets are likely to be quite severe.

The two charts below show the current extension of the S&P 500 Index.  The first chart shows the S&P 500 as compared to its 3-standard deviation range above and below the 50-week moving average.   Currently, the index is at levels, much like the Nikkei, that have denoted major market peaks.

S&P-500-BollingerBands-052313

The next chart shows the deviation of the S&P 500 price above its 50-week moving average.  Here, also, the index is at historically high levels.

S&P-500-Deviation-50WMA-052313

So, what does the "crash" in the Nikkei mean?  Most likely not much in the near term as long as "Abe" and Bernanke continue to push liquidity into the financial markets.  The current bias for assets prices remains to the upside as investors remain completely agnostic towards risk.  Despite a threat of war from North Korea, weakening global economics, deterioration in the Eurozone, a slowdown in China or a slowdown in corporate earnings - investors remain solely focused on Central Bank interventions as a driver of asset prices and a complete hedge against investment risk.

"With central banks fully engaged in lifting asset prices through monetary policy - what could possibly go wrong?"

However, in the end, it will be the realization of "fear" that drives volatility substantially higher leading to the rapid deflation in asset prices.   In this case Roosevelt was wrong - it is the "lack of fear" that we should fear the most.

See the original article >>

The Fed's Real Worry - A Pick Up In Deflation

by Lance Roberts

In several of my recent missives I have made several references to the wave of deflationary pressures that are currently encircling the globe. 

In "Japan: A Few Thoughts On The Crash" I stated:

"The unintended consequence of such actions, as we are witnessing in the U.S. currently, is the ongoing battle with deflationary pressures. The lower interest rates goes the less economic return that can be generated. An ultra-low interest rate environment, contrary to mainstream thought, has a negative impact on making productive investments and risk begins to outweigh the potential return."

Also, in "Bernanke's Link to "Mother Nature"

"How many more natural disasters will come to offset the negative economic impact of a zero interest rate environment coupled with a wave of deflationary pressures is unknown."

But most importantly in "Why Bonds Aren't Dead & The Dollar Will Get Weaker" I stated:

"A wave of 'disinflation' is currently engulfing the globe as the Eurozone economy slips back into recession, China is slowing down and the U.S. is grinding into much slower rates of growth. Even Japan, despite their best efforts through a massive QE program, cannot seem to break the back of the deflationary pressures on their economy. This is a problem that has yet to be recognized by the financial markets.

The recent inflation reports (both the Producer and Consumer Price Indexes) show deflationary forces at work. Wages continue to wane, economic production is stalling and price pressures are falling. More importantly, there are downward pressures on the most economically sensitive commodities such as oil, copper and lumber all indicating weaker levels of economic output. The battle against deflationary economic pressures has been what the Federal Reserve has been forced to fight since the financial crisis. The problem has been that, much like 'Humpty-Dumpty', the broken financial transmission system, as represented by the velocity of money, can't be put back together again."

The last paragraph above is particularly important.  The biggest fear of the Federal Reserve has been the deflationary pressures that have continued to depress the domestic economy.  Despite the trillions of dollars of interventions by the Federal Reserve the only real accomplishment has been keeping the economy from slipping back into an outright recession.  However, when looking at many of the economic and confidence indicators, there are many that are still at levels normally associated with previous recessionary lows.  Despite many claims to the contrary the global economy is far from healed which explains the need for ongoing global central bank interventions.  However, even these interventions seem to be having a diminished rate of return in spurring real economic activity despite the inflation of asset prices.

Despite the ongoing rhetoric of those fearing inflation due to the Fed's monetary interventions the reality is that such actions have, so far, failed to overcome the deflationary forces of weak global demand.   The chart below is the spot price of copper.   Copper, often dubbed "Dr. Copper", is very sensitive to economic growth as copper is used in everything from production, to manufacturing, transportation, housing, etc.   So goes copper - so goes the economy.   Copper is currently confirming the peak in economic growth for the current cycle.

Copper-vs-GDP-052413

However, the question remains, do we have inflation or don’t we?  Are we experiencing the 1970’s all over again as inflation kills the economy, or in the words of Ben Bernanke, have we entered an era of low inflation and interest rates that will last for some time as the threat of deflation remains a prevalent enemy to the economic recovery? 

3 Components Of Inflation

I believe that there are three components required to create a truly inflation environment.

Commodity price inflation is certainly one of them as it does immediately impact the consumptive capability of the average consumer.   However, in order to see true pricing pressures across the economy there are two other factors that are critical; 1)the velocity of money, or how fast money is flowing through the system from the banks to small businesses and ultimately consumers, and; 2) wage growth which gives the consumer increased purchasing power.

Why are these two factors so critical to overall inflation question?   In the most recent  NFIB survey only a small fraction of respondents stated that this was a “good time to expand their business” while the majority of respondents stated that their major concerns were “poor sales, taxes and government regulations”.  If you are a small business, who coincidently creates roughly 70% of all new jobs in the economy, and you are worried about poor sales prospects and a weak economic environment, it is highly unlikely that you are going to borrow money to expand your business or extend credit to customers.  Businesses in turn choose to hoard cash as a hedge against a weak economic environment instead of making productive investments that will lead to more jobs and higher wages.

Besides the rise and fall of commodity prices, which do indeed contribute to the inflationary backdrop, the demand for money to make productive investments by businesses which leads to higher levels of production, wage growth and, ultimately, consumption is what drives overall inflation.  It is important to remember that in economics inflation is:

"...a rise in the general level of prices of goods and services in an economy over a period of time.  When the general price level rises, each unit of currency buys fewer goods and services. Consequently, inflation reflects a reduction in the purchasing power per unit of money – a loss of real value in the medium of exchange and unit of account within the economy."

It is very difficult to have a "general rise in price levels" amidst a lack of consumer demand driven by suppressed wages, high levels of unemployment and little demand for credit by businesses. The lack of demand exerts downward pressures on the pricing of goods and services keeping businesses on the defensive.  This virtual spiral is why deflationary environments are so dangerous and very difficult to break.

I have constructed a composite "High Inflation Index" in an attempt to measure these three legs of inflationary pressures.  The purpose, of course, is to visualize the data to determine if inflation is prevalent in the current economic cycle or not.   The index is equally weighted of the M2 Velocity of Money, the Year Over Year (YOY) percent change in wages and the YOY percent change in the Consumer Price Index (CPI).  The first chart shows the historical levels of each of the three components.

High-Inflation-Index-052413-2

Notice that there is a very tight relationship between the rise and fall of compensation of employees and the velocity of M2 money supply.  With M2 velocity plunging to historically low levels this does not bode well for sustained increases in either employment or compensation as the demand for money simply does not exist currently.  The next chart is the weighted average of the three components into an index.

High-Inflation-Index-052413

The index clearly shows the "high inflationary" pressures that were prevalent in the 1970’s as the economy suffered real inflation and rapidly rising interest rates.   Recently, inflationary pressures rose as economic growth surged from the lows of the financial crisis as the economic system was flooded by trillions of dollars of stimulus, bailouts and financial supports.  However, that surge, in both the economic growth and the inflationary pressures, peaked in early 2011 and have been on the decline since.  This is why the Federal Reserve remains extremely worried about the diminishing rate of return on their monetary experiments as it relates to the economy.  Inflating asset prices higher have increased consumer confidence but has had little translation into the creation of underlying economic growth.

With the index clearly warning of rising deflationary pressures in the economy, which has recently been seen in many of the manufacturing reports that have shown downward pricing pressures both on prices paid and received, there is no "exit" currently for the Federal Reserve to reduce its monetary supports.  The real concern is that with the index at just 4.88%, which is well below the long term average of 11.63%, that the economy is far to weak to handle much of an exogenous shock.

The risk, as discussed recently with relation to Japan, is that the Fed is now caught within a "liquidity trap."  The Fed cannot effectively withdraw from monetary interventions and raise interest rates to more productive levels without pushing the economy back into a recession.  The overriding deflationary drag on the economy is forcing the Federal Reserve to remain ultra-accommodative to support the current level of economic activity.  What is interesting is that mainstream economists and analysts keep predicting stronger levels of economic growth while all economic indications are indicating just the opposite.

Despite the Fed's recent communications that they are planning to "taper" the current monetary program by the end of this year - the index is suggesting that their interventions, in one form or another, are unlikely to end anytime soon.  The threat of "deflation" remains the Fed's primary concern.

See the original article >>

SPY Trends and Influencers May 25, 2013

by Greg Harmon

Last week’s review of the macro market indicators suggested, running into the Memorial Day Weekend that the equity markets continued to look strong but with the potential for rotation into the small caps noted the previous week still showing. It looked for Gold ($GLD) to continue the trend lower while Crude Oil ($USO) was biased higher in its neutral channel. The US Dollar Index ($UUP) was on the verge of a full blown bullish move higher while US Treasuries ($TLT) were biased lower. The Shanghai Composite ($SSEC) also looked to be ready to move back higher while Emerging Markets ($EEM) were biased to the downside as they consolidated. Volatility ($VIX) looked to remain a non factor and should be ignored until it breaks above 22 keeping the bias higher for the equity index ETF’s $SPY, $IWM and $QQQ, despite the moves to new highs. Their charts agreed although the SPY was showing the most signs of caution as the IWM and QQQ plow forward.

The week played out with Gold holding its ground while Crude Oil moved up early, only to pull back later in the week. The US Dollar consolidated higher while Treasuries did the same at their recent lows. The Shanghai Composite made a higher high before pulling back while Emerging Markets broke there consolidation lower. Volatility bounced off of the lows again but remained subdued. The Equity Index ETF’s made new all-time and closing highs on the SPY and IWM with multi-year highs on the QQQ before starting a pullback mid-week. What does this mean for the coming week? Lets look at some charts.

As always you can see details of individual charts and more on my StockTwits feed and on chartly.)

SPY Daily, $SPY
spy d
SPY Weekly, $SPY
spy w

The SPY made new all-time highs Monday, Tuesday and Wednesday, before pulling back to end the week less than 1% lower. The pullback nearly made it to the 20 day SMA on the daily chart, and Thursday and Friday printed Hollow Red Candles. This two days of bullish intraday action (I posted on Hollow Red Candles Thursday night). The RSI on the daily chart is pulling back and the MACD is moving lower off a new high. These all bode for more downside price action. Notice that the volume is slowing again though. Out on the weekly chart the Evening Star is a potential reversal candle if confirmed lower next week. The RSI on this timeframe remains bullish and hovering around the technically overbought level. The MACD is continuing to rise. This timeframe looks higher still. There is support lower at 163 and 159.72 followed by 157 and 153.55. Under 153.55 and this turns bearish. Resistance is found at 166.50 and 167.50 followed by 169.07. Short Term Consolidation or Pullback in the Uptrend.

Heading into the shortened unofficial first week of Summer there is some nervous caution in the markets. Gold looks to consolidate with a downward bias while Crude Oil churns in the tightening range. The US Dollar Index seems ready for a pullback in the recent uptrend while US Treasuries are biased lower in their consolidation. The Shanghai Composite looks strong but Emerging Markets are biased to the downside. Volatility looks to remain benign keeping the bias higher for the equity index ETF’s SPY, IWM and QQQ, despite short term pullbacks and recent new highs. Their charts show more caution with a further pullback or consolidation likely. Use this information as you prepare for the coming week and trad’em well.

See the original article >>

Follow Us