
by Roberto Perotti e Filippo Teoldi
Un censimento dei sussidi alle imprese in Lazio rivela una proliferazione straordinaria di programmi, enti gestori, e beneficiari. Tra le sorprese, quasi una ventina di programmi per startup, alcuni con una dotazione di soli 400 mila euro. O un bando per l’internazionalizzazione di 150mila euro
Lo Stato, gli enti locali, e una miriade di enti e agenzie pubbliche e semi-pubbliche ogni anno elargiscono alle imprese centinaia di milioni come sussidi a fondo perduto, prestiti a tasso agevolato, investimenti partecipativi nel capitale, ecc. Nessuno sa esattamente il valore effettivo di questa cifra, e nessuno sa che effetti abbiano avuto questi sussidi.
Vi sono stati numerosi tentativi di ricognizione della spesa complessiva per sussidi alle imprese, a vario titolo. Il rapporto Giavazzi del luglio 2012 è probabilmente il caso più noto. Il rapporto Giavazzi si riferiva in gran parte ai fondi statali, ad esclusione quindi dei fondi regionali e locali; la grande maggioranza dei programmi da esso considerati non sono stati rifinanziati, e ciò che è rimasto è stato in gran parte accorpato nel Fondo per lo Sviluppo Sostenibile, che all’epoca non esisteva. Questo Fondo rilascia principalmente garanzie e prestiti agevolati, quindi la sua spesa annuale effettiva è una parte molto piccola della sua dotazione. Come ormai è stato chiarito, la grande maggioranza dei fondi rimasti del rapporto Giavazzi si riferisce a trasferimenti a public utilities nazionali, come ferrovie etc.
Vi sono però due fonti di sussidi alle imprese che sono ancora largamente inesplorate: gli enti locali (regioni provincie e comuni) e le innumerevoli agenzie e società per azioni di proprietà pubblica. Una ricognizione sistematica ed accurata di queste fonti richiederebbe anni di lavoro. In questo contributo documentiamo queste spese per una regione, il Lazio, con le sue provincie, comuni e agenzie e società per azioni pubbliche.
I SUSSIDI REGIONALI ALLE IMPRESE
Abbiamo preso in considerazione tutte le iniziative di queste entità che comportasssero dei sussidi a fondo perduto, oppure finanziamenti a tassi agevolati, garanzie, partecipazioni di minoranza o maggioranza, fondi di venture capital, startup, e simili. I beneficiari sono imprese, associazioni di persone, enti locali, università. Per il momento abbiamo escluso l’agricoltura, l’artigianato, il turismo, e contributi agli enti locali (soprattutto comuni) non specificamente dedicati all’ innovazione locale.
Molti di questi progetti sono finanziati dal FESR, il Fondo Europeo per lo Sviluppo Regionale. Questo è un fondo analogo al FSE (il Fondo Sociale Europeo, su cui abbiamo scritto qui), ma si occupa di incentivi alle imprese e finanziamenti infrastrutturali invece che di lavoro e formazione.
La Tabella 1 illustra i diversi bandi (che chiameremo anche “programmi”) che sono stati attuati dal 2007 in poi, e di cui abbiamo trovato traccia nei documenti ufficiali disponibili. La Tabella è certamente una sottostima dei programmi messi in atto dal 2007 ad oggi: è molto probabile che ci siano sfuggiti alcuni bandi, soprattutto negli anni meno recenti, e soprattutto quelli indetti da comuni, provincie e camere di commercio. Inoltre, il database OpenCoesione riporta pagamenti da parte di alcuni programmi, di cui però non abbiamo trovato alcuna notizia ufficiale, di alcun tipo; in questi casi abbiamo scelto di non riportare questi programmi nella tabella.
Tabella 1 


* FP: fondo perduto; PTA: prestiti a tassi agevolati; G: garanzia
§ “Aperto” significa bando aperto al 31/08/2014
Colonna (3) in milioni di Euro.
Fonti: vd. file Excel
La colonna 1 mostra il nome di ciascun programma. La colonna 2 mostra l’ente finanziatore e/o gestore dei vari programmi. La maggioranza dei programmi è gestita da tre finanziarie, Sviluppo Lazio, Filas e BicLazio, possedute interamente o quasi dalla Regione. Recentemente è stato deciso che le ultime due verranno incorporate in Sviluppo Lazio; ma continueranno a gestire i bandi originariamente indetti, fino ad esaurimento. Alcuni bandi verranno probabilmente accorpati: le nostre tabelle riflettono la situazione al 16 settembre 2014. Si noti che molti programmi sono finanziati e/o gestiti anche da provincie, comuni, camere di commercio, e altre entità.
La colonna 3 mostra tipo di programma: “FP“ denota erogazioni a fondo perduto; “PTA” denota a prestiti a tassi agevolati; e “G” denota un programma che fornisce una garanzia su prestiti erogati da altri.
La colonna 4 riporta la dotazione del programma come risulta dal bando. (1) La cifra sulla dotazione, come quelle successive della Tabella 2 su finanziamenti e pagamenti, comprendono sia la quota europea sia il dofinanziamento regionale.
Il totale delle dotazioni è di 822 milioni di Euro. Ricordiamo che questa è solo una piccola fetta dei finanziamenti regionali: oltre ai programmi di formazione e agli altri programmi co-finanziati dal Fondo Sociale Europeo, di cui ci siamo occupati in passato, vi sono i finanziamenti all’agricoltura, all’artigianato, al turismo, e altri finanziamenti agli enti locali di cui non ci siamo occupati qui.
La colonna 5 mostra la scadenza del bando. All’interno di ciascuna categoria, i bandi sono elencati in ordine decrescente di scadenza. Infine, la colonna 6 indica se il programma appartiene al FESR.
LA PROLIFERAZIONE DEI PROGRAMMI
La Tabella 1 si presta ad alcune considerazioni. Nel 2013 e nel 2014, si è assistito al proliferare di una miriade di bandi rivolti principalmente alle startup e all’innovazione nelle micro imprese e nelle PMI. Quest’attività frenetica è probabilmente dovuta in parte alla necessità di “rimodulare” i fondi FESR del periodo 2007-13 per utilizzarli entro il 2015, altrimenti dovranno essere restituiti all’Europa.
Quale che sia la ragione, la Tabella 1 sembra indicare un enorme numero di iniziative e programmi. Sembra che ogni assessorato, ogni provincia, ogni Camera di Commercio, e ovviamente le tre finanziarie, abbiano bisogno di uno o più programmi per finanziare “idee innovative” e per le PMI. Così, nell’ultima infornata per spendere i fondi rimasti, vediamo un “Bando delle Idee” della regione Lazio, con una dotazione di 820.000 Euro e importo massimo per progetto di 20.000 Euro; un “Contributo a fondo perduto sotto forma di voucher per sostenere interventi di sviluppo organizzativo e produttivo”, con una dotazione di 720.000 Euro e importi massimi per progetto di 12.000 Euro; il programma “Valorizziamo il territorio” della Provincia di Roma, con una dotazione totale di 50.000 Euro; un “Contributo a fondo perduto per favorire la crescita delle imprese sui mercati internazionali.” della Camera di Commercio di Frosinone, con una dotazione totale di 150.000 euro; i programmi “Io leggo” e “Io scrivo” della Regione Lazio, con dotazioni di 300.000 e 200.000 Euro, rispettivamente, per promuovere il libro; il “Progetto Zero” della Filas, per finanziare startup, con una dotazione di 400.000 Euro.
UN PAESE DI FONDI PER STARTUP …. PUBBLICI
Per essere più specifici, prendiamo le iniziative per le startup, il fenomeno più recente. Dalla tabella ne risultano almeno 14, anche se in realtà sono molte di più perché molte delle iniziative che si rivolgono alle PMI sono aperte anche alle microimprese e alle startup. Quasi tutte erogano contributi a fondo perduto, che finanziano percentuali altissime dei costi, in alcuni casi fino al 100 percento. Vi è poi addirittura un fondo di venture capital per startup, gestito da Filas Spa, una delle società finanziarie della Regione.
Qual è il problema? Far decollare le startup è molto difficile. Nessuno conosce il segreto, ma come ha sottolineato un recente studio della McKinsey ciò che è cruciale, più dei finanziamenti, è fornire l’ambiente adeguato, in cui ricercatori di tutto il mondo siano disposti a trasferirsi con le loro famiglie; mettere a disposizione delle aziende persone con esperienza diretta della problematica delle startup, che sappiano svolgere il ruolo cruciale di mettere in collegamento e in comunicazione gli imprenditori con il settore pubblico; e soprattutto, essendo per definizione il mondo delle startup in eterno movimento, è necessario fornire un ambiente di contatto con gli sviluppi internazionali. Poco o niente di tutto questo avviene nelle decine di programmi attuati nella Regione Lazio. È molto difficile immaginare che i funzionari della regione e delle finanziarie abbiano un’esperienza diretta del settore delle startup, e l’expertise necessaria per individuare i progetti promettenti e accompagnarli nel processo di internazionalizzazione.
CHI DECIDE COSA SUSSIDIARE?
C’è poi un problema inerente all’erogazione di sussidi che non avrà mai soluzione, nonostante ogni volta si sostenga che “questa volta è diverso”. Per evitare di dare sussidi a tutti, è necessario specificare chiaramente chi ha diritto al sussidio e chi no. Si può sostenere che passare dal sussidiare settori specifici decotti al sussidiare l’innovazione in generale può sembrare un progresso, e probabilmente lo è. Ma si prenda la descrizione dei settori ammissibili ai finanziamenti per il bando “Knowledge management e processi di innovazione produttiva” del 2010:
È interessante notare che un’impresa che avesse prodotto tablet (l’Ipad fu introdotto proprio nel 2010) non sarebbe rientrata in alcuna di queste categorie. Questo dimostra ancora una volta la vacuità dell’ eterno sogno di politici e burocrati di indovinare i settori “del futuro”.
SOLDI REGALATI, INCENTIVI SBAGLIATI
Molti programmi forniscono finanziamenti a fondo perduto. Alcuni di questi sussidi finanziano una percentuale enorme dei costi di una PMI o di una start-up: in alcuni casi si arriva all’80 percento o anche al 100 percento. Per questo è molto difficile comprendere l’entusiasmo della regione Lazio e dell’assessore Fabiani per il successo del programma “ICT per tutti”, che paga fino al 70 percento dei costi per aggiornare le proprie information technologies. Si legga il comunicato della Regione Lazio del 24 gennaio 2014: “ Attivo dalle ore 9.00 del 20 gennaio, alle 10.00 di mattina del 21 gennaio risultavano essersi registrati per accedere alle agevolazioni ben 586 utenti [….] per un totale di contributi richiesti di 21.279.818,65 €, ossia oltre il 210% dello stanziamento del bando che è di 10 milioni. In poco più di un giorno, quindi, si sono registrate richieste per oltre il doppio delle risorse disponibili, un dato che, in particolare, conferma la grande vivacità e propensione all’innovazione del tessuto delle Pmi locali [....]. ‘Il successo incontestabile del bando Ict per tutti – ha dichiarato l’assessore allo Sviluppo economico e Attività Produttive, Guido Fabiani – è il segno evidente che stiamo procedendo nella giusta direzione dando risposte alle esigenze reali delle piccole e medie imprese del Lazio.’“
Se un bando praticamente regala fondi pubblici, come è possibile sorprendersi ed esaltarsi perché esso ha avuto molte domande? In che senso è questo un segno del “successo” del bando? Cosa vuol dire avere “successo” nel caso di un bando che regala soldi pubblici?
FINANZIAMENTI A PIOGGIA O CONCENTRATI?
La Tabella 2 riporta alcuni dati finanziari.
Tabella 2

Colonna (2): milioni di Euro
Colonne da (3) a (6): Euro
Fonti: colonna (2): vedi file Excel; colonne (3) e (4): OpenCoesione; colonne (5) e (6): regione Lazio
Le colonne 3 e 4 mostrano il contributo pubblico assegnato e quello effettivamente pagato fino ad ora, secondo i dati di OpenCoesione. Come si vede, gli importi effettivamente pagati sono solitamente inferiori alla dotazione del bando. In molti casi questo è dovuto al fatto che i bandi non sono ancora chiusi, o si sono chiusi di recente.
Le colonne 5 e 6 mostrano il contributo medio (cioè, il contributo totale diviso per il numero di progetti accolti) finanziato e pagato, rispettivamente. Per molti bandi i dati sono mancanti, ma quelli esistenti ci permettono di affrontare, seppure in modo non scientifico, una questione che ha ricevuto molta attenzione nel dibattito recente: se siano meglio i sussidi “a pioggia” o “concentrati”. La vulgata corrente è che in passato abbiano prevalso i sussidi a pioggia, e che abbiano largamente fallito; adesso il paradigma prevalente sembra essere quello dei sussidi concentrati. Purtroppo non è chiaro cosa si intenda precisamente con i termini “a pioggia” e “concentrati”. Il primo termine sembra riferirsi alla nozione di tanti sussidi di piccole dimensioni concessi a centinaia o migliaia di imprese. Il secondo termine sembra riferirsi invece alla nozione di sussidi di dimensioni maggiore, concessi a pochi progetti, presumibilmente dopo un esame più approfondito.
Abbiamo già osservato la frammentazione die programmi, alcuni dei quali piccolissimi. Anche i dati sui finanziamenti medi non sembrano confermare la nozione che i sussidi siano più concentrati negli ultimi anni. Per quei pochi bandi per i quali abbiamo questa informazione, non c’è alcuna evidenza che il contributo medio sia aumentato negli ultimi anni: anzi, dalla Tabella 2 risulta che il contributo medio dei primi bandi (del 2009) sia di oltre 100.000 euro, più alto che nei bandi più recenti (eccetto i bandi destinati quasi esclusivamente ai comuni, perché in quest’ ultimo caso ovviamente si tratta di finanziari progetti urbani che hanno un costo tipicamente superiore ai 100.000 euro).
Ma il problema è che, nonostante la retorica sui “sussidi a pioggia”, non è ovvio che sia meglio concentrare le risorse su pochi progetti. Anche in questo caso ci sono dei vantaggi nel diversificare il rischio.
Scarica il file excel con l’elenco di tutti i bandi
(1) Per un programma che fornisce contributi a fondo perduto, la dotazione rappresenta il totale dei contributi che il programma può erogare nel corso della sua esistenza. Per un programma che eroga prestiti a tasso agevolato, la dotazione si riferisce alla cifra massima di prestiti in essere in un dato momento. Per un programma di garanzie creditizie, la dotazione rappresenta l’ ammontare di prestiti totali che il fondo può garantire in un dato momento. Per esempio, se il tasso di default medio sui debiti delle aziende è il 5 percento, e il fondo ha una dotazione di 10 milioni, esso può garantire debiti di imprese fino a 200 milioni totali (200 = 10/0,05), assumendo che il fondo garantisca l’ intero ammontare del prestito.
by Doug Short
The August Consumer Price Index for Urban Consumers (CPI-U) released this morning puts the August year-over-year inflation rate at 1.70%, off the May 19-month high of 2.13%. It is well below the 3.87% average since the end of the Second World War and 28 percent below its 10-year moving average.
For a comparison of headline inflation with core inflation, which is based on the CPI excluding food and energy, see this monthly feature.
For better understanding of how CPI is measured and how it impacts your household, see my Inside Look at CPI components.
For an even closer look at how the components are behaving, see this X-Ray View of the data for the past six months.
The Bureau of Labor Statistics (BLS) has compiled CPI data since 1913, and numbers are conveniently available from the FRED repository (here). My long-term inflation charts reach back to 1872 by adding Warren and Pearson's price index for the earlier years. The spliced series is available at Yale Professor (and Nobel laureate) Robert Shiller's website. This look further back into the past dramatically illustrates the extreme oscillation between inflation and deflation during the first 70 years of our timeline. Click here for additional perspectives on inflation and the shrinking value of the dollar.
Alternate Inflation Data
The chart below (click here for a larger version) includes an alternate look at inflation *without* the calculation modifications the 1980s and 1990s (Data from www.shadowstats.com).
On a personal note, I believe the current BLS method of calculating inflation is reasonably sound. As a first-wave Boomer who raised a family during the double-digit inflation years of the 1970s and early 1980s, I see nothing today that is remotely like the inflation we endured at that time. Moreover, government policy, the Federal Funds Rate, interest rates in general and decades of major business decisions have been fundamentally driven by the official BLS inflation data, not the alternate CPI. For this reason I view the alternate inflation data as an interesting but ultimately useless statistical series.
That said, I think that economist John Williams, the founder of Shadow Government Statistics, to which I subscribe, offers provocative analysis on a range of government statistics. While I do not share his hyperinflationary expectations, at least not based on current economic conditions, I find his skeptical view of government data to be filled with thoughtful insights.
For independent evidence that the Consumer Price Index is a reasonably accurate representation of the prices we pay, see the MIT Billion Prices Project US Daily Index.

For a more detailed independent analysis of US inflation and the official Consumer Price index, visit PriceStats.com.
For a long-term look at the impact of inflation on the purchasing power of the dollar, check out this log-scale snapshot of fourteen-plus decades.
Information received since the Federal Open Market Committee met in July suggests that economic activity is expanding at a moderate pace. On balance, labor market conditions improved somewhat further; however, the unemployment rate is little changed and a range of labor market indicators suggests that there remains significant underutilization of labor resources. Household spending appears to be rising moderately and business fixed investment is advancing, while the recovery in the housing sector remains slow. Fiscal policy is restraining economic growth, although the extent of restraint is diminishing. Inflation has been running below the Committee's longer-run objective. Longer-term inflation expectations have remained stable.
Consistent with its statutory mandate, the Committee seeks to foster maximum employment and price stability. The Committee expects that, with appropriate policy accommodation, economic activity will expand at a moderate pace, with labor market indicators and inflation moving toward levels the Committee judges consistent with its dual mandate. The Committee sees the risks to the outlook for economic activity and the labor market as nearly balanced and judges that the likelihood of inflation running persistently below 2 percent has diminished somewhat since early this year.
The Committee currently judges that there is sufficient underlying strength in the broader economy to support ongoing improvement in labor market conditions. In light of the cumulative progress toward maximum employment and the improvement in the outlook for labor market conditions since the inception of the current asset purchase program, the Committee decided to make a further measured reduction in the pace of its asset purchases. Beginning in October, the Committee will add to its holdings of agency mortgage-backed securities at a pace of $5 billion per month rather than $10 billion per month, and will add to its holdings of longer-term Treasury securities at a pace of $10 billion per month rather than $15 billion per month. The Committee is maintaining its existing policy of reinvesting principal payments from its holdings of agency debt and agency mortgage-backed securities in agency mortgage-backed securities and of rolling over maturing Treasury securities at auction. The Committee's sizable and still-increasing holdings of longer-term securities should maintain downward pressure on longer-term interest rates, support mortgage markets, and help to make broader financial conditions more accommodative, which in turn should promote a stronger economic recovery and help to ensure that inflation, over time, is at the rate most consistent with the Committee's dual mandate.
The Committee will closely monitor incoming information on economic and financial developments in coming months and will continue its purchases of Treasury and agency mortgage-backed securities, and employ its other policy tools as appropriate, until the outlook for the labor market has improved substantially in a context of price stability. If incoming information broadly supports the Committee's expectation of ongoing improvement in labor market conditions and inflation moving back toward its longer-run objective, the Committee will end its current program of asset purchases at its next meeting. However, asset purchases are not on a preset course, and the Committee's decisions about their pace will remain contingent on the Committee's outlook for the labor market and inflation as well as its assessment of the likely efficacy and costs of such purchases.
To support continued progress toward maximum employment and price stability, the Committee today reaffirmed its view that a highly accommodative stance of monetary policy remains appropriate. In determining how long to maintain the current 0 to 1/4 percent target range for the federal funds rate, the Committee will assess progress--both realized and expected--toward its objectives of maximum employment and 2 percent inflation. This assessment will take into account a wide range of information, including measures of labor market conditions, indicators of inflation pressures and inflation expectations, and readings on financial developments. The Committee continues to anticipate, based on its assessment of these factors, that it likely will be appropriate to maintain the current target range for the federal funds rate for a considerable time after the asset purchase program ends, especially if projected inflation continues to run below the Committee's 2 percent longer-run goal, and provided that longer-term inflation expectations remain well anchored.
When the Committee decides to begin to remove policy accommodation, it will take a balanced approach consistent with its longer-run goals of maximum employment and inflation of 2 percent. The Committee currently anticipates that, even after employment and inflation are near mandate-consistent levels, economic conditions may, for some time, warrant keeping the target federal funds rate below levels the Committee views as normal in the longer run.
Voting for the FOMC monetary policy action were: Janet L. Yellen, Chair; William C. Dudley, Vice Chairman; Lael Brainard; Stanley Fischer; Narayana Kocherlakota; Loretta J. Mester; Jerome H. Powell; and Daniel K. Tarullo. Voting against the action were Richard W. Fisher and Charles I. Plosser. President Fisher believed that the continued strengthening of the real economy, improved outlook for labor utilization and for general price stability, and continued signs of financial market excess, will likely warrant an earlier reduction in monetary accommodation than is suggested by the Committee's stated forward guidance. President Plosser objected to the guidance indicating that it likely will be appropriate to maintain the current target range for the federal funds rate for "a considerable time after the asset purchase program ends," because such language is time dependent and does not reflect the considerable economic progress that has been made toward the Committee's goals.
by Chris Kimble
Year-to-date, the Russell 2000 (RUT) has lagged the S&P 500 by almost 8%, a fairly wide divergence. This divergence has a few investors concerned that this is a sign of weakness to come in the broad markets. But an interesting technical development highlights an important near-term intersection of time and price.
The chart below takes a technical perspective of how the bulls & bears could be looking at small caps. And perhaps this is why the small caps have endured so much volatility this year!
Russell 2000 Long-Term Chart with Support/Resistance

CLICK ON CHART TO ENLARGE
Bears like this: Back in early March the Russell 2000 came upon a 14-year resistance line. Since then the Russell is down 3%, while the S&P is up almost 8%.
Bulls like this: 6 weeks ago small caps hit a rising 5-year support line and have moved higher since, moving in sync with the broad market.
As you can see these two support/resistance lines have seemed to impact small caps over the past few months, as they have mostly chopped back and forth between these lines.
The bottom line here is that the Russell 2000 is in a tight technical jam that looks like it will resolve soon. Whether you are bullish or bearish small caps, an interesting technical intersection awaits the small caps! And it should pay to follow the coming breakout/breakdown. Thanks for reading.
By Fernando Losada
Fixed-income investors often divide emerging markets into commodity exporters and commodity importers. We think this overlooks an important reality: commodity wealth is not the sole—or even the most important—driver of EM performance.
It’s certainly true that a decade of increases in energy, metal and agriculture prices have swelled national incomes in commodity-rich countries in Latin America, Europe, Africa and Central Asia. Display 1 shows what some of those countries’ real gross domestic incomes would have been without the terms-of-trade shock caused by the commodity boom (the dark green bar) and what it was when accounting for it (the light green bar).
 As expected, commodity-rich countries such as Venezuela and Russia saw a boost in their terms of trade—the relative difference between import and export prices—and, consequently, their real income. Turkey, South Korea and other commodity-dependent countries, on the other hand, took a hit.
Yet our research shows that being a commodity producer didn’t guarantee improved credit fundamentals or stronger growth during that time. In fact, some of the commodity “winners” are actually worse off today. Many commodity importers, on the other hand, weathered the storm and saw their economies strengthen.
Why didn’t the last decade’s unprecedented commodity boom have a uniform impact across emerging markets? The reason is simple: Only a handful of commodity-rich countries took advantage of the windfall and the fiscal flexibility it provided to push reforms that would improve their growth potential and diversify their economies away from excessive dependence on commodities.
Instead, many boosted spending on social programs, public sector wage hikes and other initiatives designed to gain political favor. When commodity prices stabilized, they were left with gaping fiscal holes and little political room to cut expenditures. In short, some of the commodity “winners” ended up on the losing end.
Struggling with the Commodity Boom
Venezuela may be the best example. The energy price increases helped boost gross domestic income in the country by a whopping 240% over the past decade. But the government squandered most of the windfall, leaving the country just as vulnerable now as it was in 2003.
The story was similar in Ukraine, a large metals producer, where the potential positive impact of the commodity boom was neutralized by capital flight and increased spending by the governing elite.
Ukraine may be an extreme example, but it’s worth pointing out that broad indices of government effectiveness and accountability declined over the past decade across all regions. In fact, the strength of institutions deteriorated more in commodity exporters than commodity importers.
Put another way: Too many commodity exporters behaved as if the commodity windfall were permanent. This can be seen in EM public finances. While government balances have improved across emerging markets over the last decade, they deteriorated, on average, among primary commodity exporters (Display 2).
 Sound Policies Key to Success
On the other hand, commodity boom “losers”—or net importers of commodities—behaved in a more disciplined manner on the whole. For example, the run-up in commodity prices forced Turkey—a net commodity importer—to make policy adjustments to cushion the blow of higher food and energy costs. Today, the country runs a more responsible fiscal policy than it did in 2003.
Among the resource-rich countries, only Kazakhstan, Mexico, Colombia and Indonesia demonstrated an ability to improve fundamentals over the last decade of commodity price gains.
In our view, strength in EM economies ultimately boils down to smart policy choices. We found that countries that embraced prudent macroeconomic management and pushed through unpopular reforms saw the quickest rise in real incomes and the biggest improvements in credit quality, irrespective of commodity wealth.
That’s important for investors to know, because it’s the countries that were most proactive on the reform front who are best positioned to grow and prosper—especially if commodity prices remain stagnant or decline in the next decade.
Our findings also underscore just how important it is to be selective when investing in EM fixed income. Emerging markets are not a homogenous asset class, and commodities, while an element in overall performance, are certainly not the main drivers of economic success.
by Tyler Durden
It was over a year ago, when contrary to the propganda spewed on a daily basis by the Japanese government hell bent on destroying the domestic economy, now suffering its Keynesian death rattle, just to push stocks to highs which nobody except for a few thousand people will be able to monetize on, that the CEO of Sony explicitly warned that "the preconception is that a weaker Yen is good overall. Unfortunately for us, versus the USD, it goes the other way... we are actually at a disadvantage." He wasn't kidding and just under a year later, back in May, Sony shocked everyone when the electonics giant not only posted a massive net loss of $1.3 billion, far worse than previously expected, but also slashed its profit outlook by 70%.
Fast forward to today, when minutes ago the Yen hit another multi-year low against the dollar, which sure enough, is great for the nominal value of Japanese stocks, if horrible for the actual Japanese companies, the Japanese middle class, and pretty much everyone except for a few superrich people. Such as Sony. Because the (now former) electronic giant, which once upon a time was the target of an activist campaign by none other than Dan Loeb who mysteriouly saw value in the company, once again stunned everyone when it reported overnight that it expects its annual loss to swell to $2 billion, but, far worse, canceled the payment of its dividend for the first time ever after writing down the value of its troubled smartphone business.
Needless to say, Sony's stock which doubled in 2013 for the completely wrong reasons, is now crashing.
And while guiding lower is a staple of virtually all companies in the New Normal, halting dividends can mean only one thing: the end of the road may finally be in sight.
For the first time since going public in 1958, the Japanese electronics and entertainment conglomerate canceled dividend payments for the half- and full-year. "This is the very first time we ever eliminated a dividend," said Sony's president Kazuo Hirai. "For more than 50 years we always paid a dividend. The entire management takes this very seriously."
The company plans to cut staff in its mobile communications business by about 15 percent, or roughly 1,000 people, Hirai said. Details of that plan are to be announced later.
But... Abenomics is an economy-boosting miracle. Oh wait, there we go again confusing the economy with a stock market priced in devalued currency terms.
Sony has been trying to reshape its business after years of red ink and has repeatedly promised turnarounds without delivering. It said the bigger loss for the current fiscal year stems from a lower valuation of its mobile phone business due to weaker than expected sales. The company is recording an "impairment charge" of 180 billion yen ($1.7 billion) in the July-September quarter.
The charge is purely an adjustment to the company's balance sheet, involving no cash, but it reflects that the mobile business is far less valuable and will generate lower profits than previously thought.
The smartphone business has proven particularly tough for Sony. Apple and Samsung dominate at the top end while Chinese and other Asian manufacturers are hogging the market for cheaper phones that are most likely to appeal in fast-growing developing countries. Hirai said Sony had not managed to stay ahead of sea changes in the industry.
"The Chinese smartphone manufacturers have made great strides and are expanding outside their own market, and this has caused a shift in the pricing," he said. "Meanwhile, Apple and other manufacturers are launching strong, innovative products. The changes are very rapid and dramatic." Hirai said Sony expects a loss in its mobile business this year, but would return to profit by cutting costs and focusing on higher end devices. It is also positioning itself for future growth in smartphones and mobile technology.
"We have to be in the competitive landscape in the next stage and be ready for that evolution," he said. Sony intends to leverage its vast archive of music and movies, network services and technology to compete.
But... we thought all it took to boost trade, sends exports soaring and raise your GDP, was to crush your currency, while obliviously keeping everything else unchanged and telling corporate CFOs to just hang tight and that any minute now EPS nirvane would be upon them.
It there really more to being competitive in today's world than selling products at a low, low FX-adjusted price. Oh, forgot to mention: products which nobody wants regardless of the price?
Could it be that finally Japan is waking up to what we said in January of 2013, namely that just crushing your currency will do nothing for the underlying economy, and as Sony has shown, actually lead to ongoing corporate devastation and soon, widespread bankruptcies?
In a parallel note, Bloomberg reports something else we warned in January of 2013, namely that "business leaders in Western Japan warned central bank chief Haruhiko Kuroda that the yen’s slide to a six-year low is boosting costs of imported raw materials and fuel and may spell trouble for the economy."
Companies in the industrial city of Osaka report that their profit margins are deteriorating as they can’t pass along the higher costs even as sales rise, Osaka Chamber of Commerce and Industry Chairman Shigetaka Sato told Kuroda at a gathering yesterday. Kansai Economic Federation Chairman Shosuke Mori said the rise in fuel costs warrants close monitoring.
“It is a source of concern, that given the recent rapid yen weakness, the negative aspects such as rising import costs will become more prominent,” said Sato, who is also chairman of Keihan Electric Railway Co.
The comments underscore the burden that the cheaper yen is putting on the world’s third-biggest economy even as it gives a tailwind to the Bank of Japan’s effort to spur inflation. Kuroda said the currency moves don’t pose a problem for Japan and that it’s natural for the dollar to rise against the yen as the U.S. economy improves.
Golfclap. Now we just wonder how long it will take Japan to figure out the last thing we said in January 2013, namely that Abenomics was never meant to boost the Japanese economy, and was entirely geared to boosting the global, and mostly the US stock market, courtesy of some $75 billion in fungible liquidity thanks to the BOJ every month. Of course, if and when Japan does figure out what was painfully obvious to anyone who is not an idiot, Abe may need something far stronger than diarrhea to escape the rightful vengeance that the people will demand upon his head and other parts of his body.
Sadly for Sony, it will probably be too late.
by Mark Roe
CAMBRIDGE – Last month, at a US Federal Reserve Bank conference on the money market, officials lamented the market’s enduring fragility. Indeed, six years after a run on the money market nearly brought the United States – indeed, global – financial system to its knees, critical risks that underpinned that crisis still have not been brought under control.
At its core, the money market serves the need of a firm or nonprofit institution to store cash that it can access on a moment’s notice. A university, for example, must set aside a portion of students’ tuition payments to cover unexpected expenses. But the sum is larger than $250,000 – the maximum that the government insures in a single account. Seeking more security for its cash, the university may turn to US Treasury bonds.
The process is simple. The university deposits the money in a bank for a short period – often just one day – with the bank providing a US Treasury bond as collateral. If the bank does not return the cash the next day, the university can sell the bond, keep the cash it is owed, and return any excess to the bank. It is almost as safe as a government-insured bank deposit.
If only universities engaged in such practices, the money market would not have grown large enough to damage the economy so deeply in 2008 and 2009. But large businesses waiting to invest excess cash make the same types of cash deposits with banks – millions of dollars at a time – owing to the same unwillingness to rely solely on a bank’s promise to safeguard anything over $250,000.
Moreover, ordinary savers use their cash to buy shares in money-market funds, which lend that cash to financial institutions, getting long-term US Treasury bonds as collateral and promises of next-day repayment. And hedge funds park the cash that they receive from investors in the money market while waiting for promising long-term investments to arise.
In short, the money market is not just a few institutions managing a few billion dollars of cash. It is a massive multi-trillion-dollar market. Indeed, it was a $4 trillion market just before the financial crisis, with its reduction to less than $3 trillion during the crisis disrupting real economic activity.
But the money market’s size is not the only reason for its fragility. Another problem is that banks are not the only institutions managing it.
The key to making money-market transactions work is the borrower’s ownership of a Treasury bond that it can offer to the “depositor” as collateral. Given this, any sufficiently large institution with such bonds can imitate the bank’s lending role – and many non-bank institutions do, often obscured from the watchful eye of regulators. The money market thus extends well beyond the regulated banking system into so-called “shadow banking.”
The final problem is that such thinly capitalized non-banks do not just offer solid US Treasury obligations as collateral; they also provide weaker securities, such as aggregations of mortgages. These securities are not US obligations, carry no government guarantee, and do not retain their intrinsic value in a crisis.
When a crisis erupts and lenders cannot return the cash, “depositors” prepare to sell the collateral. But while prices for US government bonds can withstand a large-scale sell-off, those for mortgage bonds cannot – especially if, as during the recent financial crisis, the housing market is weakened. The prospect of that sell-off put the solvency of many financial institutions at risk, leading the US government to bail out the money market, the mortgage-bond market, and the infamous Fannie Mae and Freddie Mac, which backed many of the mortgage securities.
There are three ways to make the money market safer. The first is to make the institutions providing the quasi-money safer by increasing their capital. The second is to limit the total size of unregulated transactions that any one institution can conduct.
The third is to allow this kind of lending only against rock-solid collateral, such as Treasury bonds – not mortgage-backed securities, which can lose value quickly during a crisis, requiring a government bailout. The government should decide up front which types of collateral it will guarantee in a crisis, instead of being backed into a corner when markets, institutions, and collateral that it never pledged to support are on the brink of collapse.
Money-market institutions cannot be counted on to take these systemic safety-oriented steps themselves. The transactions are too profitable in ordinary economic times, and they know that, if another crisis arises, the government will again be compelled to support the market and shore up weakened financial institutions.
It is therefore up to policymakers to reduce the financial risk that the money market generates. But the prevalence of shadow banking institutions, which do not hold traditional bank charters and are not subject to bank regulation, complicates such efforts.
A full solution would focus on preventing all institutions from offering weaker forms of collateral. As Ed Morrison, Christopher Sontchi, and I proposed at the end of last month’s Fed conference, US regulators must change the rules to prohibit mortgage-backed and other weak securities from being used so extensively in the money market, unless the government decides up front to back them fully. The weaker collateral could be used elsewhere – just not for parking money overnight. For that, safer securities should be required.
If US policymakers adopt this approach, the tone of the Fed’s next money market conference could be much more optimistic.
By: Dan Hueber
Wheat
Generally quiet news morning as we reach mid-week with many traders/investors as concerned about the Fed Reserve Open Market Committee meeting that is being held as anything Ag related. As has been the case when this group meets, everyone will be scrutinizing each and every word for a hint as to when they may begin boosting interest rates, or maybe better stated if there is a possibility that it could occur sooner than later. A rise in rates would not only potentially stall the equity markets but should send the U.S. Dollar higher, which of course is not a positive for commodities export business.
As expected, the Egyptian wheat tender went to France who is aggressively marketing their crop. Turkey, the T in the MIST countries, was in for 200k MT of US wheat and Morocco is tendering for 386k MT. Weekly sales will be released tomorrow morning.
The ranges for wheat overnight are quite small at this point and we currently hover around the unchanged mark but this of course after dropping to lower lows once again yesterday. I continue to believe December futures have room to slip down to at least the June 2010 lows at 4.73 between now and the beginning of October.
Corn
Well, the FSA acreage bump faded rather quickly yesterday as ongoing reports of big yields occupied the minds of traders. While I suspect we will eventually see the USDA adjust corn acreage lower, considering that the FSA data is evidently still incomplete and may not be finalized until December, that would mean changes will not be made until the final reports in January. Of course the horses are long out of the barn by then so closing the door a touch may not be much of a market mover at that time. We did still manage to close right around the unchanged market so it was a victory of sorts.
At this point lower prices do not appear to have stimulated any exceptional export interest for new corn. The only tender lining up overnight is Israel looking for 70k MT and it would appear the report tomorrow morning will not hold any positive surprises. You have to imagine that outside of immediate needs, buyers will be content to allow the market to come to them. Also consider the fact that since July, new crop corn futures have lost around 17% and during the same time the dollar index has gained over 5% so all the flat price decline is not being reflected in other countries.
While I am not sure if this qualifies as new or old news but it was reported overnight that China and the US failed to reach any kind of agreement on the testing for and acceptance of certain GMO’s in DDG’s as well as corn. This effectively continues to lock us out of the majority of the Chinese market at least until they suffer a crop problem. You have probably all read that Cargill has now filed a suit against Syngenta over unapproved GMO varieties which will be very interesting to watch unfold.
The corn market has actually been quite stable now for the past 5 sessions which is not unexpected but I cannot imagine we will hold this range for any extended period. A push through exiting lows in December corn at 3.35 ¾ should open the door for a slide down to the targets between 3.10 and 2.90 most logically in October.
Soybeans
The early bean strength yesterday fizzled quickly after touching the 10.00 mark in November futures. It would appear we know where the sell order will be sitting is at this point. We have tried to stabilize and bounce overnight but without a fresh positive story soon, I suspect the expanding harvest and consistently solids yield being reported will overwhelm the support once again.
According to the Ministry of Agriculture in Argentina, farmers in that nation have sold just 58% of this years’ crop. Last year at this time they had sold around 66% which was also at a slower pace than usual and I have to believe heavily influenced by the troubled political/economic situation down there. It is better to hold a commodity than a worthless Peso. There are two negatives for the US with this situation though. First, it means there is a larger current world inventory just as our new beans are becoming available and hence, greater competition. Second, this means the Argentine farmer is probably cash strained moving into the spring season, which would suggest they will plant crops that require less money, i.e., more soybeans.
As with the corn, the FSA data released yesterday would hint that we could see acreage adjustments on future reports but if that does not happen until January, it could be anti-climatic. I continue to believe we will see November beans slide down to at least the 9.50/9.40 zone and if yields continue to come in a solid as the early numbers, a push down against 9.00 would not seem unreasonable.
by Chris Kimble

CLICK ON CHART TO ENLARGE
The Gold Bugs index remains above support that dates back 10-years.
Over the past year and a half, the index has created a pennant pattern, a series of lower highs and high lows, teasing both the bulls and bears. As you can see, this pattern will be coming to an end soon.
Pennant patterns are popular for suggesting that a large move is ahead, yet which direction is a different story. This pattern does fall under the continuation of trend category, anything is possible though!
After years of disappointment, bullish miner investors should be treated to some fun upside-action if the pattern breaks out to the upside. The best plan for a pennant most often is to set back and watch for the breakout and then follow it.
This pattern would appear investors won't have to wait long for the outcome.
by Daniel W. Drezner
MEDFORD, MASSACHUSETTS – As the latest G-20 meeting of finance ministers starts in Cairns, Australia, the Legion of Gloom is at it again. Their conventional wisdom is that “the system” – global governance structures ranging from the World Trade Organization and the G-20 to the major central banks – is badly broken and in desperate need of repair. In fact, the global economic order has worked remarkably well since 2008.
True, the first year of the Great Recession was more severe than the first year of the Great Depression. But, despite this initial shock, the system responded in a surprisingly nimble fashion. Compared to previous global downturns triggered by a financial crisis, the global economy bounced back robustly. Trade and output levels exceeded pre-crisis levels in most countries a few years ago, and global poverty continues to decline rapidly.
One key to this rebound was that, in contrast to the 1930s, the global economy maintained existing conditions: trade barriers remained low, as did restrictions on foreign direct investment, and cross-border exchange continued to spread with the Internet.
As the McKinsey Global Institute noted, with the exception of cross-border finance, global flows are just as robust now as they were before the crisis. There has even been a partial revamping of key global institutions, from the rise of the G-20 to reform of the International Monetary Fund. Indeed, the resiliency of markets to geopolitical tensions in Ukraine or the South China Sea has begun to worry some Fed officials.
By any reasonable metric, multilateral institutions and great-power governments did what was necessary to preserve the global economy’s openness. So why the widespread misperception that the system failed?
Here, we run into a dirty little secret of world politics: many commentators on international politics do not know much about economics or economic policy. International-affairs professionals frequently talk about “high politics” and “low politics,” and they usually relegate economic issues to the latter category.
This ignorance matters when political commentators try to write about the global economy. They will naturally rely on the most accessible facts as their guide.
To be fair, some of the most obvious data have indeed suggested fragmentation of the global economic order. The dormancy of the Doha Round of WTO talks, the public deadlock of some G-20 summits, and stalemates at the United Nations Security Council seem like sufficient evidence to proclaim that the status quo is imperiled – even if facts beyond the headlines belie that consensus.
Consider the kerfuffle over “currency wars.” In 2010, the Fed began hinting at a second round of quantitative easing, or QE2. One of the policy externalities of QE – the Fed’s purchase of long-term financial assets – was a depreciating dollar. Fearing domestic asset-price bubbles and upward pressure on their currencies from an inward rush of capital, many emerging-economy leaders complained loudly about what Brazilian Finance Minister Guido Mantega called an “international currency war.”
Lost in all of the hype was the fact that neither markets nor financial analysts were terribly perturbed about excessive exchange-rate volatility or the possibility of an actual currency war. After the autumn of 2008, exchange-rate volatility slowly receded toward pre-crisis levels.
Another common reason for the collective misperception is misplaced nostalgia. Former US National Security Adviser Brent Scowcroft encapsulated the post-crisis conventional wisdom in 2012: “The postwar leaders set up the International Monetary Fund, the World Bank, and the General Agreements on Tariffs and Trade to develop rules of the road. The new G-20 is but a pale reflection of that once-brilliant institution building.”
But past efforts at building a global order have had their share of futility. Anyone familiar with the history of the Bretton Woods institutions knows that they experienced as many misses as hits. Compared to the past, the current order performed well above average.
Perhaps the deepest explanation for the Legion of Gloom’s strength is where they live. According to the Economist Intelligence Unit, the OECD economies averaged annual GDP growth of 0.5% from 2008 to 2012, whereas non-OECD economies averaged 5.2% growth.
This matters because analysis of the international order remains anchored in the West. It is a general rule of political science that a faltering economy causes greater distrust in institutions. A weak economy feeds perceptions that the system is broken, and that those in authority are not to be trusted. So greater skepticism about all levels of governance in the OECD economies is not surprising.
Analysts might be looking first at their local circumstances, and then extrapolating from that to their assessments of global institutions. Pessimism about slow national recoveries in the developed world is causing analysts to conflate poor domestic and regional governance with poor global governance.
But the primary causes for domestic economic weakness in Japan, the US, the United Kingdom, and the eurozone are not global in origin. Japan’s economy had been stagnating for almost two decades when the 2008 crisis erupted. Likewise, domestic policy stalemates and political uncertainty acted as a significant drag on the US recovery from the Great Recession.
Does the system’s remarkable resiliency since 2008 mean that it can withstand the next crisis? In theory, yes – many of the post-2008 reforms have been designed to add shock absorbers to the global economy. But, in international relations, collective misperceptions can create their own reality. If pundits continue to insist that the system failed, wonks will devote time and effort to figuring out how to fix what is not broken.
Moreover, it is extremely difficult to correct misperceptions once they ossify – particularly if the topic in question is outside a pundit’s range of expertise. Ironically, the only thing that might stop the system from continuing to work is the low confidence of its greatest proponents.
By: Bloomberg
Corn fell for the first time this week in Chicago as farmers in the U.S., the world’s top grower, begin harvesting what’s expected to be the largest crop on record. Wheat also dropped.
Four percent of corn in the main U.S. growing area was harvested as of Sept. 14, in line with last year’s pace, the U.S. Department of Agriculture said two days ago. Farmers may collect 14.395 billion bushels this season, the most ever, the agency said last week. Futures have tumbled 19 percent this year. Frost in parts of the Midwest last weekend probably didn’t cause significant damage, and the region should experience a warming trend this week, forecaster DTN said today.
"The weather remains nearly perfect," economist Dennis Gartman wrote in his daily Gartman Letter. "The harvest that is beginning in the South can and will be sped along."
Corn for December delivery fell 0.6 percent to $3.4175 a bushel at 7:12 a.m. on the Chicago Board of Trade. The grain rose 1.6 percent in the prior two sessions amid concerns cold weather in parts of the U.S. and Canada would hurt crops. Prices still touched $3.3575 on Sept. 15, matching a four-year low reached on Sept. 11.
Soybeans for November delivery rose 0.2 percent to $9.83 a bushel. Prices fell to $9.695 on Sept. 11, the lowest since July 2010. The oilseed has slumped 24 percent this year as the USDA forecasts farmers in the U.S. will harvest a record crop of 3.913 billion bushels.
Wheat for delivery in December dropped 0.2 percent to $4.955 a bushel after touching $4.91 yesterday, the lowest for a most-active contract since July 2010. Prices declined for an eighth session today. In Paris, milling wheat for November delivery fell 0.3 percent to 161.50 euros ($209.26) a metric ton on Euronext. Egypt, the world’s biggest wheat importer, bought 180,000 tons of French supplies in a tender yesterday.
By: Money_Morning
Dr. Kent Moors writes: This isn’t the first time the devolution movement has threatened to break up the United Kingdom.
Scotland and Wales were considering their independence when I was living in London and lecturing at the London School of Economics almost forty years ago.
These days it seems like “déjà vu all over again.”
On Thursday, there will be a vote in Scotland to decide whether it will separate from the rest of the UK, and the latest polls are too close to call.
On the previous occasions, London always provided some concessions and the moves to break away failed. This time, however, the drive for an independent Scotland is better organized, led, and financed.
Either way, the latest vote appears to be a tight one.
For the government, Scottish independence would be a direct rejection of Prime Minister David Cameron. Yet on the other side of the aisle, the Labour Party would lose a significant number of Scottish seats in the UK Parliament, reducing its chances of unseating the Conservative-Liberal coalition anytime soon.
And there are numerous implications for the energy sector throughout if the vote succeeds…
The Prospect of Higher Energy Prices
Of course, the frustrations leading up to this moment have been building for some time. In fact, it began in earnest with the major oil and gas finds off the coast in the North Sea.
Scotland has benefitted from North Sea oil and gas, turning declining cities like Aberdeen into world-leading centers for offshore technology and services. Yet, the north has long argued that London benefitted more from the offshore flow than Scotland did.
To some, the huge gains in oil revenue just bailed out a struggling central budget at the expense of renovating the local Scottish economy. But on the other side, as “unionists” point out, Scotland has also received stipends covering about 90% of the electricity generated from renewable sources, especially wind power.
This has significantly offset the actual costs of energy in wide areas of Scotland where the effective unemployment rate remains the highest in the UK. When I was in Dundee last year, the employment rate was a staggering 63% and the situation has deteriorated since then.
The lag in economic development in most sectors, other than oil and gas, has been an increasingly strong point for separation. As a consequence, the Scottish National Party (SNP) has experienced a windfall of support
However, the vote has caused concerns among Scottish consumers. According to UK government reports, average yearly energy bills for Scots will go up by £189 (over $306 at current exchange rates) if independence occurs. That’s because bill payers in the rest of the UK effectively subsidize the cost of investing in renewable energy in Scotland.
Yet Scots themselves are hardly alone in their energy concerns as the vote approaches.
English households to the south are worried that consumer bills will rise if the SNP succeeds, since the UK as a whole would be stripped of Scotland’s oil reserves and wind energy.
The truth is nobody really knows how much the average household on either side of the border would pay. On the other hand, there are few who believe either Scots or English consumers will see their bills reduced.
All of this has brought more attention to the wind power subsidies. Scotland has substantial wind power already in place (both inland and offshore), but that electricity is still expensive to produce and requires government support to make it affordable to the market.
Independence would require that Edinburgh (the capital of Scotland now and certainly after separation) pick up a bill currently covered by the UK budget. Just about everybody has concluded this will take place through either higher energy bills, higher taxes, or both. Proponents and opponents of independence differ markedly on how much the bill and/or tax hikes would be, but not on whether they will be coming.
A separate scenario has emerged in which Scotland could actually make some revenue from selling its wind-generated power to England and Wales. Edinburgh would still need to develop the wind network and pay for its operations.
Here is where the European Union comes in. The EU now mandates that 15% of energy is to come from renewable sources. Whether a newly independent Scotland would petition to become an EU member is one thing. That it would allow the UK to meet its obligations is another. This has prompted some analysts to believe the two independent countries would have to end up sharing the costs of Scottish wind production.
But the EU is hardly static on such matters. Commentators have pointed out that Brussels could well mandate a higher percentage for Scotland, given its greater capacity for wind power and the virtual certainty that it would possess a surplus. The EU already does that with Sweden and its hydropower targets.
Even the ability to sell wind-generated electricity south is not automatically beneficial. Economists have noted that during warmer months of the year Scotland would be forced to sell electricity to England at a steep discount, losing money in the process.
Meanwhile, the concerns in the south seem clearer. Losing control over North Sea production almost certainly will increase prices for energy in England and Wales. Those in Scotland opposed to independence, therefore, still believe London will sweeten the pot with concessions in other areas to avoid a split.
The Big Risk in the “Independent World”
The big unknown is what will happen to gasoline and other oil product prices. The UK still relies on Scottish access to the North Sea but would no longer administer it. Quid pro quo price adjustments might add to the uncertainties in an “independent world.”
And it is here where a greater impact may be felt by the UK as a result. Oil and oil products sold internationally are denominated in US dollars. Even domestic sales of gasoline, diesel, and heating fuel are impacted by the “dollar effect,” regardless of the currency in which a retail sale is actually made.
As speculation increases over the Scottish vote, the Great British pound sterling has fallen to its lowest level against the dollar in almost a year. Now the overwhelming assumption points to an even steeper drop if Scotland goes its own way.
Two things will happen if this occurs. First, it will cost more for individuals and businesses to acquire fuel throughout the UK and in a new independent Scotland. Second, it will affect the price of the Brent crude benchmark price set each day in London.
Brent is now the dominant benchmark rate against which daily oil trades are priced worldwide. It is also denominated in dollars. But as the price is set in London, based on the price of a basket of North Sea production, the new uncertainty factor will place even greater pressure on the currency values underpinning that price.
This latter consideration will have an immediate impact on oil pricing volatility in many global regions well distanced from London or Edinburgh.
Meanwhile, other consumer considerations are also being debated. Providers of cell phone, postal, and Internet services have not commented (officially, at least) on whether the cost of communication services would increase between what would be separate countries in the wake of independence.
For instance, would calling Glasgow from just across the border now incur roaming costs?
This is not simply an example of fear mongering by those opposed to independence. In this case there is a precedent. The UK’s three biggest mobile providers – EE, O2, and Vodafone – offer services in Northern Ireland (a part of the UK) and the Republic of Ireland (and independent country), but charge their respective customers for roaming on either side of the border.
Every time I am in the UK my cell phone bill goes through the roof anyway. And now I may also feel a pinch in the wallet from going online as well.
Mel Gibson may be famous for yelling “Freedom” at the end of Braveheart. But if Scotland takes the same course, it will have another effect.
It is going to cost me more money!
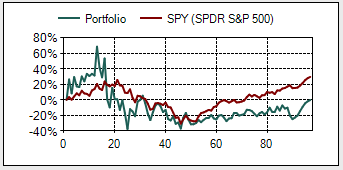
by Dale Roberts
The market bottoms are when and where the you-know-what hits the fan. All investors approach a massive line with a sign that reads "winners to the right, losers to the left." That sign might also read "buyers to the right, sellers to the left."

Where will you be heading in the next stock market correction? Do you even have a good guess, about what you might do? The most predictive tool might be by asking the question "what did you do in the last correction"? If you panicked and sold some assets, then there's the probability that you might once again panic and sell and create real losses. History has a habit of repeating itself; or as Mark Twain quipped:
History doesn't repeat itself but it does rhyme.
Now history is certainly the best teacher, and perhaps the only teacher that investors pay real attention to. So it is certainly possible that if you panicked and sold, you learned a real tough and expensive lesson in the Great Recession or perhaps in the tech-induced meltdown of 2000-2002.
Those two market corrections were sizeable and a very tough test for investors. Those of us in our 40s and 50s might say that we have had one of the most trying investment periods in history. With the Great Recession, we just went through the most severe market correction since the great depression. And the 2000 correction was perhaps even more severe to those who were overweight to the can't-miss-it's-a-brand-new-world tech darlings. Ha.
Here's the S&P 500 (NYSEARCA:SPY) from January of 2008 to the end of 2010. All total return calculations are courtesy of low-risk-investing.com and the x axis represents duration in months.
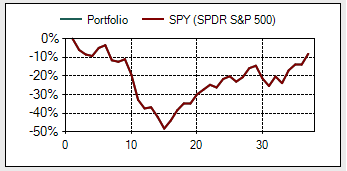
And here's SPY from January of 2000 through to the end of 2003.
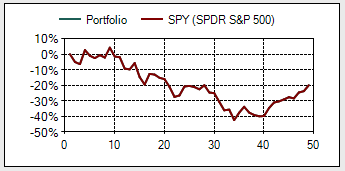
And again those of us who were seduced by the World Wide Web and the new technology and the endless growth potential of all of these companies were introduced to declines that make the S&P 500 look like a kiddie ride. Here is the Nasdaq 100 (NASDAQ:QQQ) vs. SPY from 2000-2003. Yes that's SPY in the red (pun intended) and the Nasdaq having a good look from below.

Full disclosure, I have to admit that my idea of diversification back in 1999 was holding Microsoft (NASDAQ:MSFT), Nortel, Cisco (NASDAQ:CSCO) AND JDS Uniphase (NASDAQ:JDSU). What could go wrong? There is no relevant ticker for Nortel as that company is no more.
I got slaughtered on my tech holdings but I was also very patient as I did have a very high risk tolerance level. I remember holding Microsoft for what felt like forever. I finally sold MSFT and booked a $100 gain, just to say I made money on Microsoft and to be a really stubborn investor. Seven years is a long time to wait to make a few bucks.
Here's Microsoft from January of 1999 to December of 2006. That's MSFT in racing green. Tough lessons indeed.
Those lessons served me well and that created the situation and emotional training where the period heading into, through and out of the Great Recession was our most profitable investing experience. I had generous income at the time, I just kept buying save for a U.S. financial that "had to go." I even took on higher risk assets such as sector funds and small cap. I was into gold as Barrick (NYSE:ABX) was one of my clients, and they told me I should be into gold. I got lucky on that call or suggestion.
The real test for investors will come along again, market corrections always seem to appear to cleanse the market, return valuations to more normalized levels. And along the way the market shakes out the winners and losers; those who move to the right and those who move to the wrong, or left. The corrections separate those who drastically underperform the market, and those who outperform the historical market returns.
As we know, the "average" investor is able to reduce long term 9-10% average annual market gains to 2-3% annual gains. Investors have a habit of buying at or towards the tops of the markets when they feel more comfortable, and then selling at the bottom when they are gripped with fear. As Warren Buffett will tell you, that fear creates a wonderful opportunity for the intelligent investor. There will be investors selling (potentially in a loss position) and there will be buyers picking up the markets and companies at perhaps more attractive long-term valuations.
Decide now if you will be a buyer or a seller. Ask yourself if you can withstand a 20%, 30%, 40%, 50% or 60% decrease in the value of your holdings? Can you stomach your $800,000 portfolio that then shows up on your statement as a $500,000 or $400,000 portfolio? Can you stomach your portfolio reaching a new top and then going under water and staying under water for 2, 3, or 5 years? If any of the above scenarios make you nervous just thinking about the possibility, imagine how it will "FEEL" when those portfolio drops are for real.
If you have never been through a market correction, your guess may not be that accurate - err on the side of caution. You don't know how long you can hold your hand submerged in ice water until you stick your hand in that icy bucket and try to keep it in there for a few minutes. The crippling, cold "feeling" can be a surprising shock.
If you have the suspicion that you might not respond well in a modest to severe market correction, you might consider reducing the risk or volatility of your portfolio. Traditionally, that is created by adding bonds and cash, and perhaps lower volatility stocks or indices. Bonds typically or historically lower the portfolio volatility during a market correction and bonds are typically more stable as they are fixed income instruments, and they also offer the potential to be inversely correlated to stock markets. Ideally, the balanced portfolio sees the bonds go up in price when the stocks go down.
As a general rule of thumb, 70% bond exposure might turn a 50% stock market correction into a 9% or less portfolio draw down. A 40% bond allocation might turn that 50% market correction into a 20% or less portfolio decline. And a 25% bond allocation might turn that 50% market correction into a 35% or less portfolio decline.
In addition to the immediate price (and emotional) hit, there's also the duration of the downturn that can gnaw away at your confidence and investor resilience. This chart from my article, "How Long Can You Afford To Be Under Water?"
Performance returns are from October of 2007 to May of 2014 (the date the article was published). The portfolio consists of the broad market index S&P 500 and the broad bond index (NYSEARCA:AGG). Total return calculations courtesy of low-risk-investing.com.
As we can see a 50% bond allocation can cut the time under water by almost half from 4.5 years to 2.5 years. The cost by way of reduced returns was minimal. And as I wrote in this article, entitled "There's Little Chance of Beating a Balanced Portfolio From Here", it may be likely that once again from today's valuations one can lower the volatility of the portfolio and produce market beating returns over the next several years. There may be little or no cost to creating a lower volatility portfolio in September of 2014.
That lower volatility and less time spent "under water" has the potential to help many investors stay the course and avoid selling equities when they fall precipitously in price. It is my opinion that it is a very small and select group of investors who could hold an all stock portfolio (with meaningful monies) through a severe and lasting market correction of 40% to 50%.
Stock market corrections and major declines or bear markets are just a normal and natural and healthy component of investing. They are a cleansing, and they are the greatest opportunity for investors. Don't fear a correction, confidently whisper "bring it on." When the markets fall they are going on sale and you can typically purchase long-term value. Your dollars will buy more purchasing power from the bottoms. When the masses run away from the companies they own, they are typically willing to sell at fire sale prices. Get your wallet ready and line up to the right.
As always if you are dollar cost averaging on a regular schedule, with meaningful monies, carry on. You are on auto pilot that is programmed to buy the markets at, towards, and coming out of the market bottoms.
I would also add that this may be a time to consider international exposure. Many U.S. investors have a home bias (as is the norm for investors on any continent), but it may turn out that international exposure turns out to be the play of the decade. Many U.S. investors suffered the lost decade of the 2000's when very generous gains were available in Canada and around the globe. Let history and experience be your guide there as well. There is also U.S. currency risk to consider.
Happy investing, be careful out there, and always know your risk tolerance level.
By: Axel G. Merk
“Bullying” by the Fed, ECB, Bank of England and Bank of Japan has been in place for up to six years, forcing not-so-mighty central banks, savers and investors to deal with the consequences. Understanding the dynamics may help investors to navigate what’s ahead.
First, let’s get one thing straight: it matters little what you; we; or anyone in the blogosphere thinks policy makers should do. We are bystanders that have to deal with the consequences of their actions. The cheapest action undertaken by policy makers is to coerce the markets with verbiage. Their words matter, as they control the printing presses. Having said this, if the words are not followed by action, at some point, the markets may call their bluff.
Not all policy makers are created equal. Some grab the headlines simply because their leaders have access to a microphone, such as Christine Lagarde of the IMF. But the IMF only sets policies for countries that are receiving funds from the IMF aid program. For all practical matters, we would like to encourage anyone to tune out when Madame Lagarde tells the Fed or the ECB what to do. Similarly, the OECD just doled out some advice for the ECB, but – frankly – their input is rather irrelevant. Just as irrelevant as yours or mine would be.
Let’s move a step up from the supra-national organizations to small countries. Now we are firmly in bullying victim territory. When large central banks unleash their printing presses, what are smaller countries to do? We have all been told never to blame the victim, but countries have a choice:
And then there are the big boys – and girls, the bullies. When the Fed sneezes, the rest of the world catches a cold. When the ECB or BOJ act, it sends ripple effects around the world. We are told extra-ordinary measures are temporary. Is seven years (since 2008) temporary? Pensioners have been deprived of income. Easy money has pushed up global real estate prices. Buying a home has become unaffordable to ever more people, even as rates hover at or near historic lows.
One could argue that we, as investors, are also “victims.” But just as any country has a choice on how to react to the bullying of central banks, so does any investor. We can’t print our own money, but we can choose where to place our money. Browsing through stories in recent weeks, one can read that the verdict is out: the bullies have been right. After all, stocks have gone up - a bull market creates many smart people.
Things must be great, what could possibly go wrong? Well, Bloomberg reported on Monday that 47 percent of stocks in the Nasdaq Composite Index are down at least 20% from their peak in the last 12 months. No, not all is well. We have argued for a while that the biggest threat we may be facing is that the policies we have in place are actually working, namely that we are getting economic growth. That’s because throughout the world, we have mostly kicked the proverbial can down the road. Should we get economic growth, the cost of borrowing is likely to move higher, making it ever more apparent that we cannot sustain our deficits. Not in the U.S; not in Japan; and not in the Eurozone. But fear not, the bullies of the world may keep rates low. It’s just that something has to give – we think it will be the currency, with the dollar and yen particularly vulnerable.
In our assessment, odds are high that the bullying will continue. That is, central banks won’t allow asset prices to be reflected by fundamentals, but ‘extraordinary’ measures of some form will persist. For countries being bullied, this means they better be in it for the long haul.
For investors, they have to figure out how to navigate these waters. Many have simply gone along for the ride. And why not, if things go wrong, we can simply ask for another bailout, right?
We propose investors to consider what might be a better alternative: how about contemplating what might be a prudent policy for policy makers to pursue, then putting one’s money on the long-term winner? Of course this requires answering the question: what does it mean for a country to win? You see, with both consumers and government heavily in debt, the U.S. might call itself a “winner” if it can devalue the value of this debt; the ones holding the bag are, after all, foreigners. Is a country a winner that provides the best social services? Is a country a winner that allows market forces to play out? Or is a country a winner that minimizes inflation or maximizes employment or GDP?
We believe in the old adage that the best short-term policy may be a good long-term policy. That’s true if for no other reason that businesses are more likely to invest if they know what policies will be in place in the future. As such, we encourage anyone to look at which countries have sustainable policies. Having said that, any such assessment has to be put in the context of valuation because the best values are sometimes found with countries that are about to turn the corner, meaning the market may re-price better times ahead.
Putting money with a country pursuing “good” policy rather than one pursuing “bad” policy may sound well, but will an investor benefit? And if so, what does it mean to put money into a country? Does one buy the currency, stocks, or bonds?
Since we put this in the context of central bank bullying, let’s consider a “good” policy to be sound monetary policy. Sound monetary policy, namely one that fosters price stability, may bode well for a currency. In the context of other central banks trying to debase their currencies, it may lead the currency of a country pursuing sound monetary policy to appreciate. Those fighting the hardest against currency appreciation may win the currency war, but impose losses on those buying the currency.
The call for currency debasement is usually associated with the fear that a strong currency suffocates a domestic economy. As such, at first blush, equity markets in such a country might be at risk. But small countries can have rather odd mixes of domestic versus international revenue for large players. Take New Zealand for example, whose fate is mostly dependent on soft commodities (notably milk powder exports to China); or Switzerland that houses headquarters of various multinational companies, although much of the revenue is from abroad. Many of these countries also have sophisticated currency-hedging operations in place. Importantly, we believe the countries that embrace their strong currencies and adjust accordingly will be better equipped as the bullying of large central banks may continue.
The good news about the recent run-up in the dollar is that it may provide an opportunity for investors to diversify outside of the dollar. Notably, just as the dollar has appreciated with rising equity prices of late, the dollar may not be the safe haven should equity prices fall back down to earth. Given that a downturn in equity prices in the U.S. may drag down equity prices worldwide, investors might want to consider staying on the cash side of things, outside of the dollar, thereby embracing currency risk as a potential opportunity.
Sterling's worst moments in the past 100 years have generally come in this month, so Scotland's vote could not be worse timed
Black Wednesday - 16 September 1992. How newspapers reported the sterling crisis. Photograph: Harris/PA Archive/Press Association Ima
April is the cruellest month, TS Eliot once wrote. Not for the pound, it isn't. Without question the month that holds the maximum danger for sterling is September. What's more, this week – the week in which Scotland decides whether it wants to become an independent country – tends to be the scariest week of the scariest month.
Consider the evidence. There were five big sterling crises in the 20th century, and four of them came to the boil in September. In the circumstances, it's not hard to see why foreign exchange dealers will be at their desks early on Friday morning to await news from Edinburgh about the referendum vote.
The story starts in 1931, two years after the Wall Street Crash and six years after Sir Winston Churchill had, with some misgivings, put Britain back on the Gold Standard at its pre first world war rate. This involved a revaluation of the pound, a move that made UK exports more expensive. Industry's pain intensified when global trade started to contract in the early years of the Great Depression.
The Labour government of James Ramsay Macdonald found that it could only balance the budget by imposing spending cuts that led to a split in the party and the formation of a coalition. International investors were spooked by a mutiny of sailors at Invergordon and capital flight was not staunched by an austerity budget. Sterling left the Gold Standard forever on 21 September 1931.
Roll forward 18 years and Labour is back in power, this time led by Clement Attlee. An ailing Sir Stafford Cripps is chancellor of the exchequer and the British economy has been hit hard by the cost of six years of total war, and is struggling to meet the twin commitments of high military spending and the welfare state.

Sir Stafford Cripps, former chancellor of the exchequer, discussing aspects of the devaluation of the pound. Photograph: Planet News Archive/SSPL via Getty Images
With the German, French, Italian and Japanese economies all in much worse shape than Britain's, the Attlee administration sees an opportunity to rebuild the economy through an export drive. This though is hampered by the level of the pound, pegged at too high a level against the dollar. Eventually, with Britain's gold and foreign currency reserves dwindling, Cripps agrees to a 30% devaluation. The date: 19 September 1949.
In 1949, Denis Healey was a would-be Labour MP, yet to enter parliament. Twenty-seven years later he was at the centre of the next big September meltdown for sterling, one that eventually resulted in Jim Callaghan's government seeking financial help from the International Monetary Fund.
Just as George Osborne was due to attend a meeting of G20 finance ministers this week, so Healey was due to be out of the country in late September 1976. Unlike Osborne, who scrapped his planned trip a week in advance, Healey was on his way to Heathrow for a flight to Manila, where the annual meeting of the IMF was being held, when he got the news that the pound was coming under intense pressure on the foreign exchanges. The chancellor decided to abort his trip and instead travelled up to Blackpool to attend Labour's annual conference. On the last day of September, Healey urged a sceptical party to get behind the government. The humiliating terms of the IMF loan were announced just before Christmas.

A man weighing gold after the lifting of the Gold Standard in 1931 encouraged people to sell. Photograph: Hulton Archive/Getty Images
The last major trauma was in the 1990s, 16 September 1992 to be exact. This was the date when John Major's government abandoned attempts to keep the pound in the European exchange rate mechanism. It was the date the Bank of England took on the currency speculators led by George Soros and lost. It was the date when the Treasury, then responsible for setting interest rates, announced two increases in the cost of borrowing.
That morning the chancellor, Norman Lamont, pushed official rates up from 10% to 12%. When that failed to ease pressure on the pound, he said the afternoon that rates would be raised to 15% the next morning. The second increase never occurred because by that time, sterling was out of the ERM.
Although there have been no sterling crises since the turn of the millennium, September has continued to be the month when bad stuff happens. September 2007 saw queues outside branches of Northern Rock, the first run on a major high street bank in the UK since the 1860s. A year later, on 15 September 2008, Lehman Brothers went bankrupt, leading within a month to the near-collapse of the western financial system.
That, of course, was in October 2008. But the moral of the story is that even when things don't go pear-shaped in September, there's a good chance of them doing so – 1929, 1987, 2008 – in October. History is just one of the reasons the Bank of England and the Treasury will be ready for action come Friday morning.
Follow Us


