Saturday, August 13, 2011

Macro Week In Review/Preview August 13, 2011


Last week’s review of the macro market indicators looked interesting on many levels. Gold appeared ready to consolidate, if only for a couple days within the uptrend while Oil could consolidate before continuing the fall. The US Dollar Index looked to drift higher in the 73 to 76 range while US Treasuries pullback. The Shanghai Composite appeared headed lower toward support and Emerging Markets might consolidate or bounce a bit before doing the same. The spike in Volatility looked to have more room to the upside but showed signs of pulling back at least early in the week. The Equity Index ETF’s SPY, IWM and QQQ appeared set to bounce early next week, but the SPY and IWM charts look broken on many timeframes and headed lower. The QQQ was a bit of an enigma as it had maintained a hold at support. The QQQ’s continuing to hold and move higher would be a signal that the broad downturn may be ending. On the other hand if the SPY and IWM continue lower as expected in the intermediate term the QQQ will likely join them lower.

The week began with a bang as S&P downgraded the US debt late last Friday, removing the expected consolidation. On Monday Gold moved higher quickly and Crude Oil fell. Treasuries ran higher with the added catalyst of European fears and the US Dollar Index held steady but printing wide range doji days. The Shanghai Composite fell and Emerging Markets followed. Volatility spiked and the equity indexes SPY, IWM and QQQ pushed lower fast. By Wednesday morning a lower support area was forming for equities and Oil with higher resistance for Treasuries and Gold. Thursday began the reversal for all which then continued Friday in a narrow range. What does this all mean for the coming week? Let’s look at some charts.
As always you can see details of individual charts and more on my StockTwits feed and on chartly.)

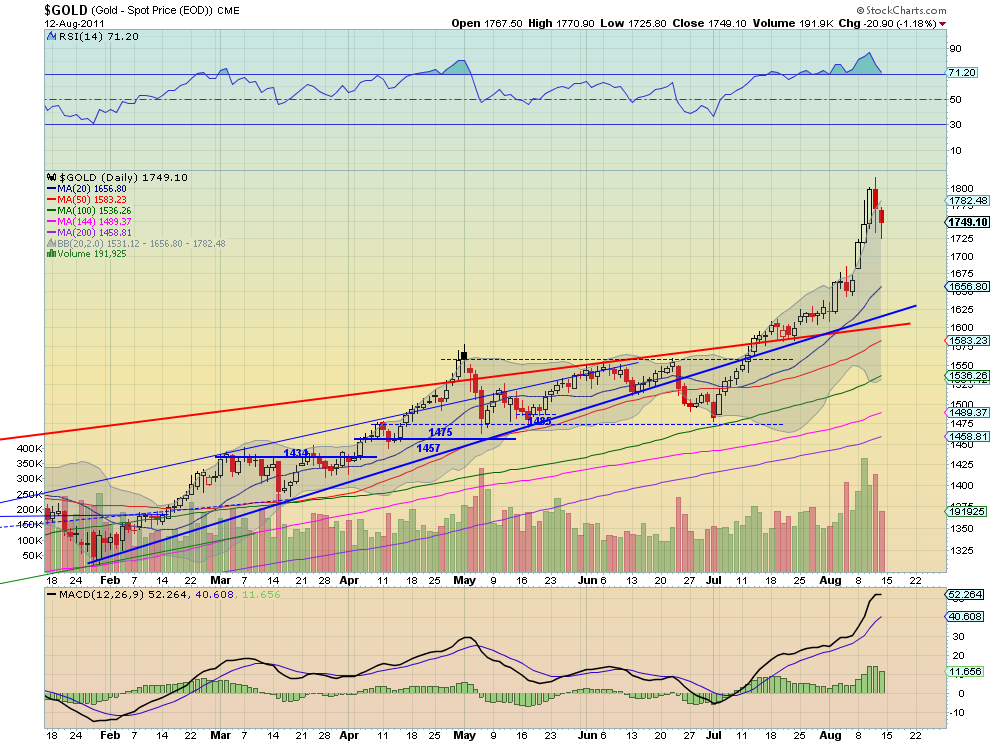
Gold Daily, $GC_F

Gold Weekly, $GC_F

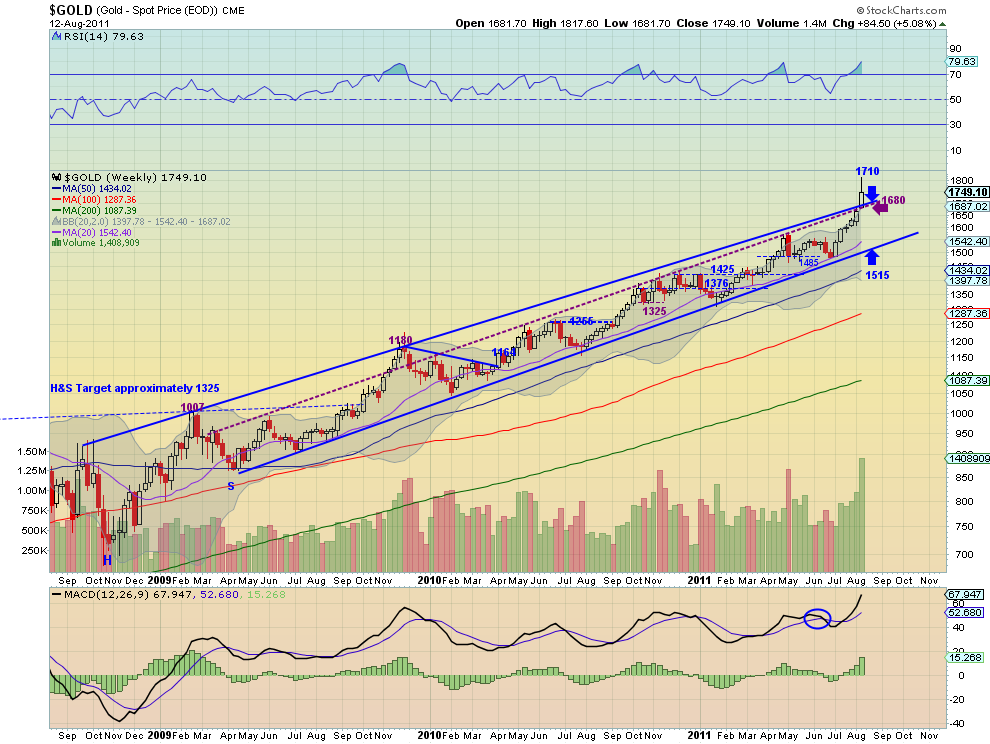
Gold gapped higher Monday and ran through the end of Wednesday, closing outside of the Bollinger bands each day. Then it pulled back to support at 1748. The Relative Strength Index (RSI) on the daily chart has moved from overbought to near the 70 line and the Moving Average Convergence Divergence (MACD) has come off of its peak as the price is retreating towards the 20 day Simple Moving Average (SMA). The weekly chart shows the first breach of the rising channel from 2008 to the upside. The RSI is at levels where it has retreated from the last 3 times it has reached and the MACD is high. The shooting star print closing out of the Bollinger bands adds to the possibility of more downside. Look for more of a pullback in the uptrend in the coming week with support at a back test of the weekly channel at 1710 followed by 1700 and 1680. A hold at 1748 could lead to another move to 1800 and higher.

West Texas Intermediate Crude Daily, $CL_F

West Texas Intermediate Crude Weekly, $CL_F

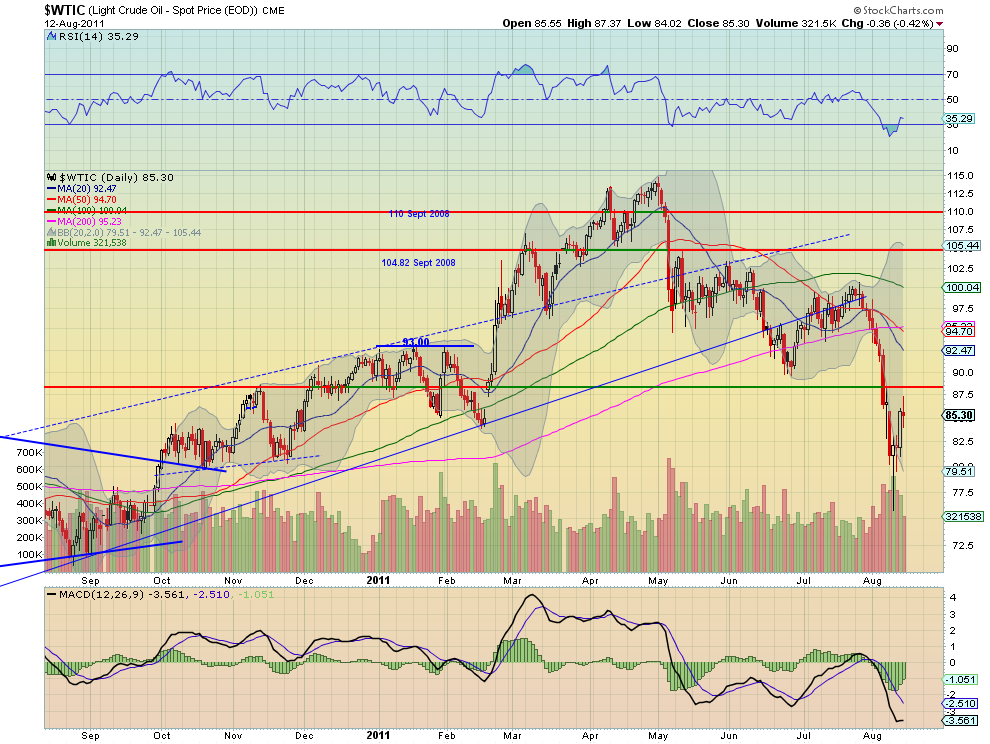
Crude Oil broke the doji from last Friday lower and drove to a test of support at 81. By the end of the week it was retesting that doji area with another doji. The daily chart shows the RSI bottomed in the 20′s and is moving higher again, and the MACD has been improving since Wednesday. The weekly chart shows a fall out of the rising channel but a promising Hammer candle after a retracement to the 38.2% Fibonacci level of the move off from the 2008 high to the 2009 low at 76.99. The RSI is still falling and the MACD has is growing more negative again on the weekly chart. The combination suggest a short term move higher but there is resistance at the channel at 87 and then the support/resistance at 88.50, but more downside in the intermediate term with support at 81 and 77.

US Dollar Index Daily, $DX_F

US Dollar Index Weekly, $DX_F

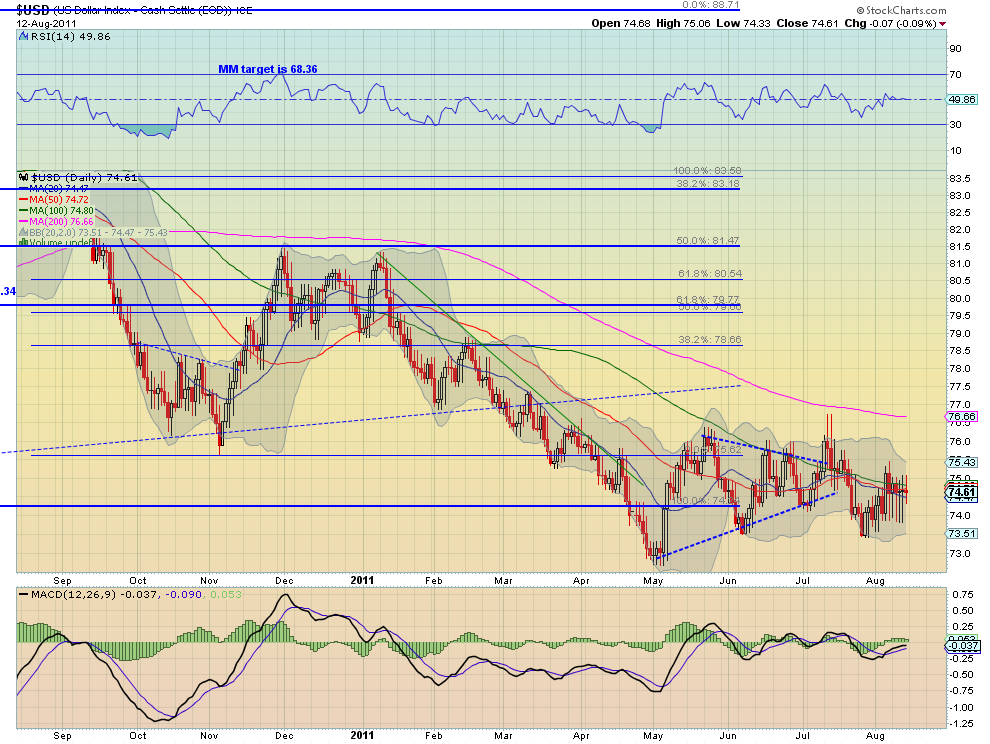
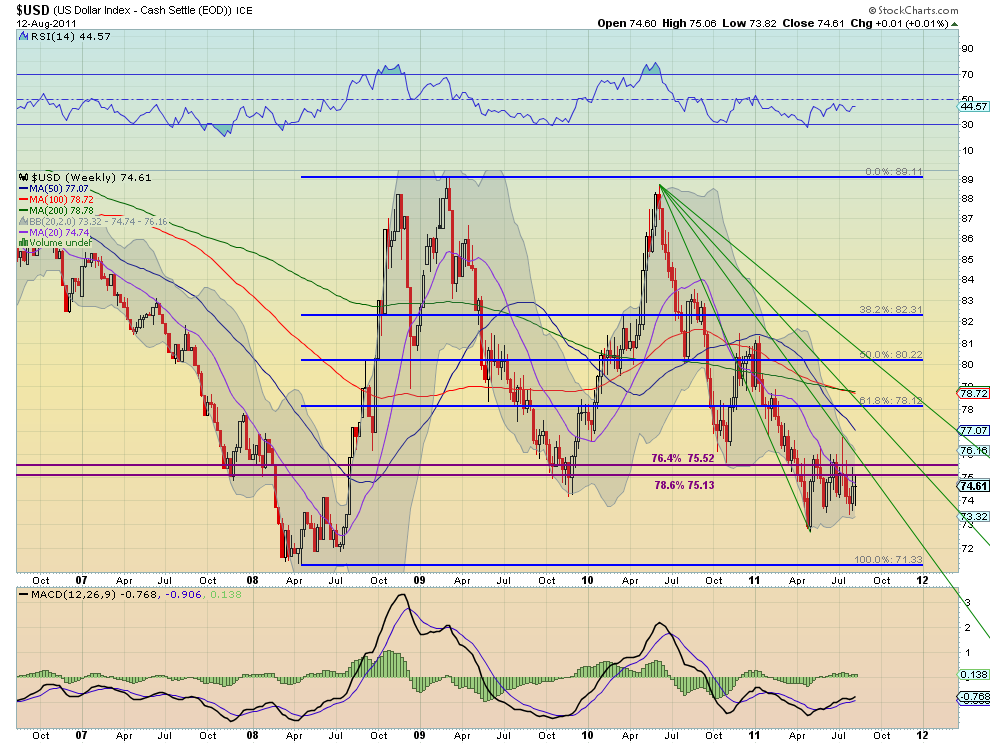
The US Dollar Index continues to move sideways in the upper end of the consolidation range from 73.50 to 76. Despite the daily range being bigger the real body’s of the candles have been shrinking, suggesting indecision coming to a head. The RSI and MACD on both the daily and weekly time-frame continue to provide little information about the next move. The weekly time-frame shows that the upside resistance at 75.13-75.52 coincides with the Fibonacci levels retracing from the move higher from 2008 to 2009. On this time-frame the trend continues to be down. Look for more sideways action in the 73.50-76.00 range in the coming week as it approaches the Fan line in September.

iShares Barclays 20+ Yr Treasury Bond Fund Daily, $TLT

iShares Barclays 20+ Yr Treasury Bond Fund Weekly, $TLT

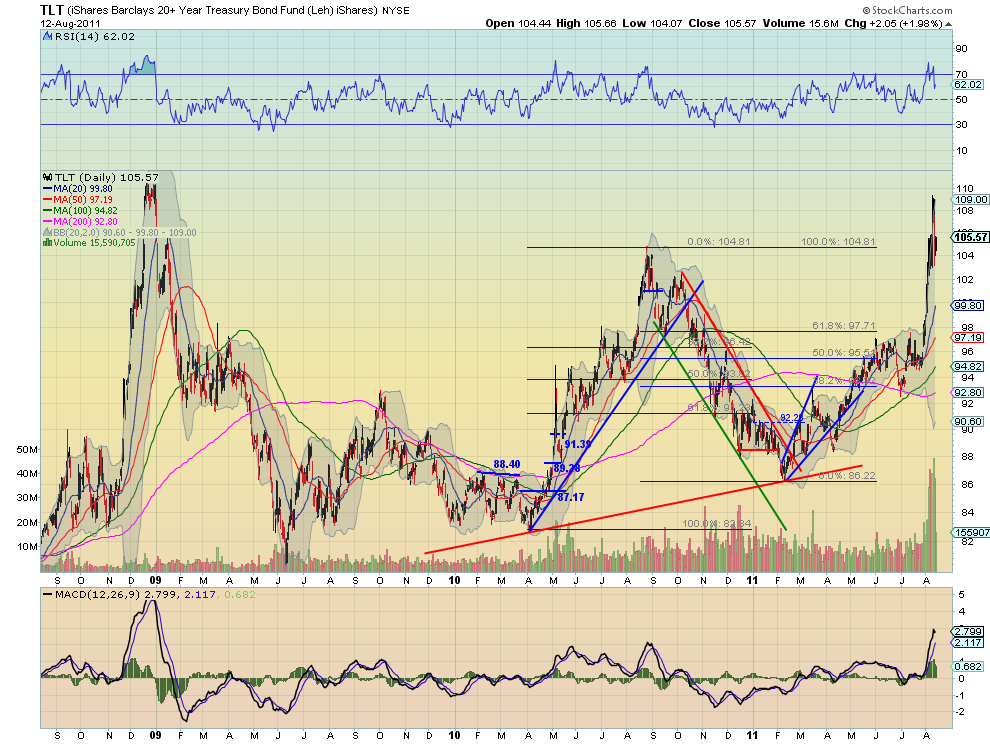
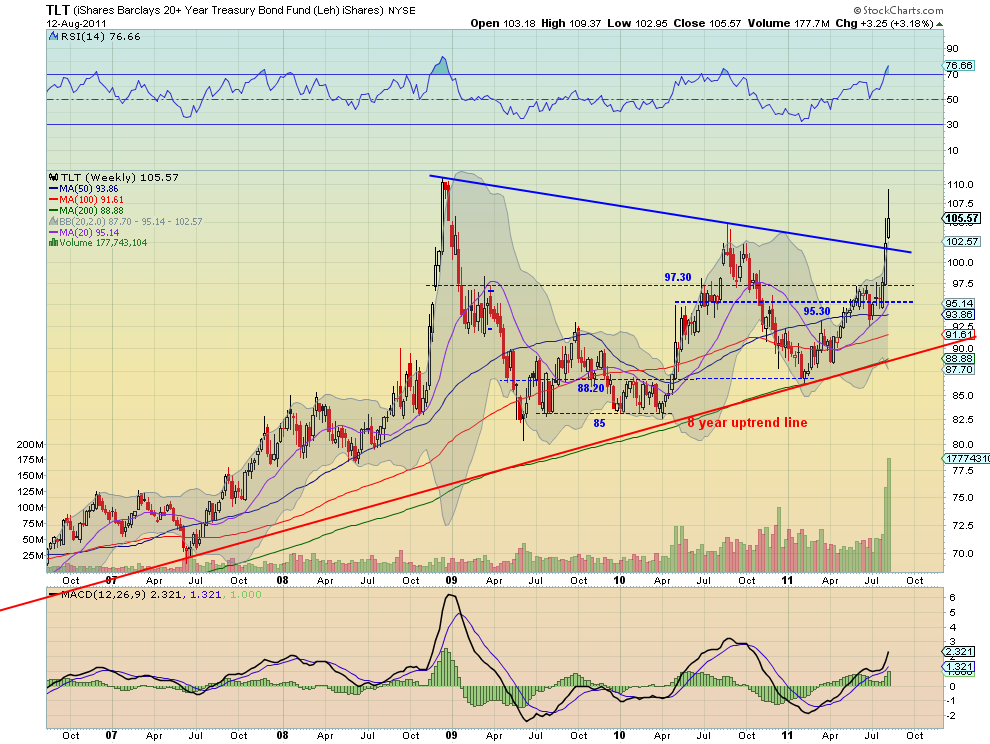
Treasuries, as measured by the ETF $TLT, had a massive week up over 3% even after selling off by over 3.5% from the top. Friday found support at the 104.80-105.20 area, the August 2010 high, but the RSI and MACD on the daily chart are diverging and suggest more downside. The weekly chart shows a shooting star print out of the Bollinger bands that launched on a break of the symmetrical triangle. The RSI is pointing higher and the MACD is growing on the weekly time-frame, and volume on the move higher has been very large. This combination suggests that we may see a retest of the triangle upper rail or lower before a move higher on the intermediate time-frame. Look for support at the 104.80-105.20 area or at 102 and 100 lower to hold to continue the upside. A move above 110.65 confirms a target on the triangle pattern at 136.

Shanghai Stock Exchange Composite Daily, $SSEC

Shanghai Stock Exchange Composite Weekly, $SSEC

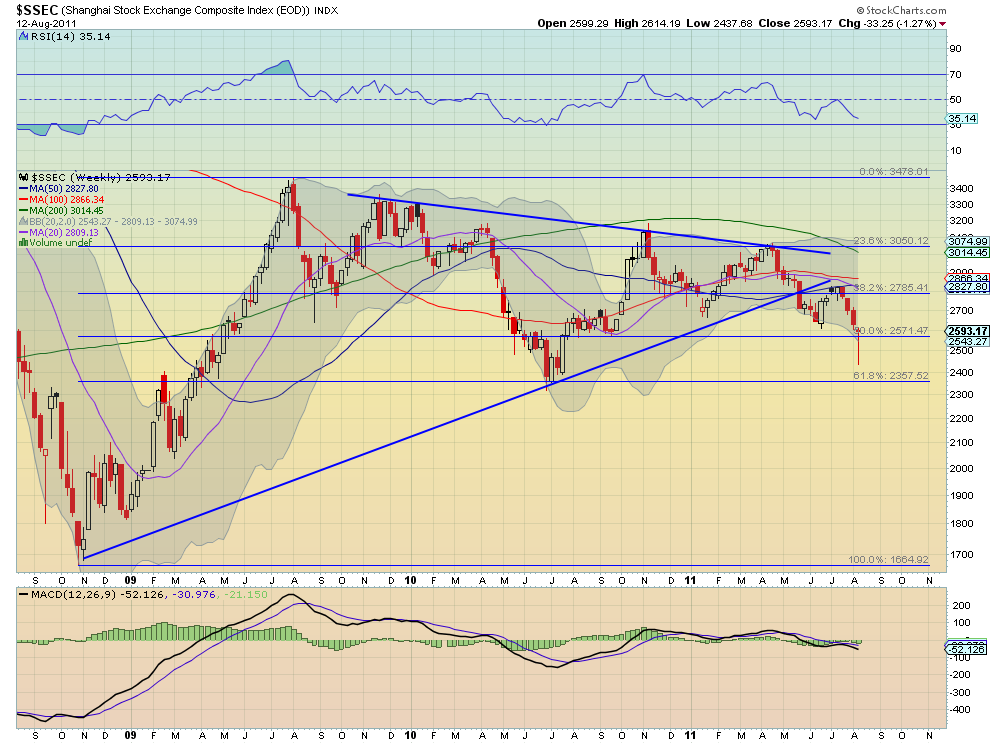
The Shanghai Composite found support at the 2500 area after testing lower. The daily chart shows the RSI bottomed and sloping higher with the MACD moving steadily towards the zero line, while price now tests the bottom of the late 2010 channel between 2590 and 2695. The weekly chart printed a near Dragonfly doji with a long shadow, but with the RSI still falling and the MACD flat-lined. In the end this is at least a lower low after a lower high, still a down trend. Look for next week to continue the short term move higher with resistance above at 2695 and then 2800, with a move above 2840 negating the down trend. A move lower sees some support at 2500 and 2450.

iShares MSCI Emerging Markets Index Daily, $EEM

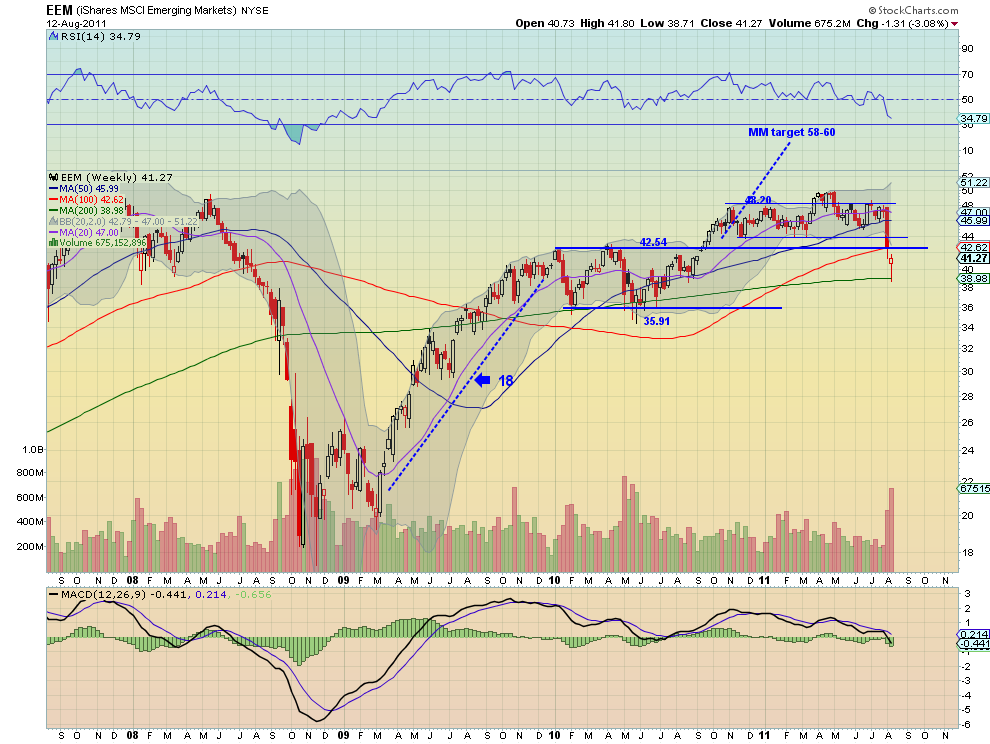
iShares MSCI Emerging Markets Index Weekly, $EEM

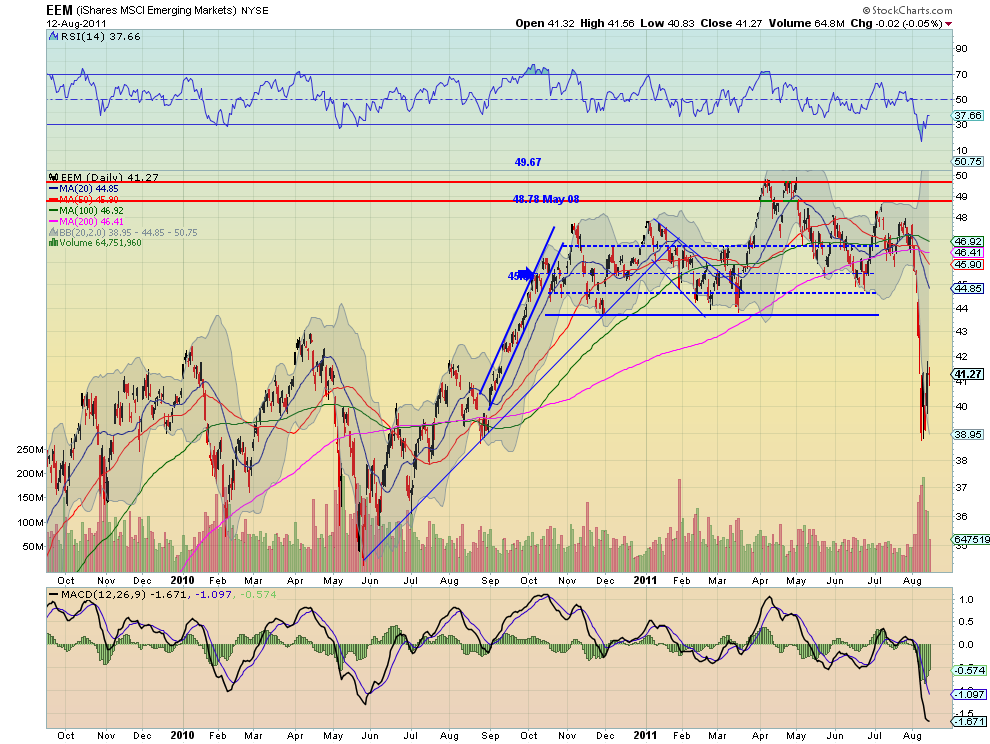
Emerging Markets, as measured by the ETF $EEM, crashed Monday and then consolidated for the week in a range between support at 39 and resistance at 41.50. The RSI on the daily chart bottomed and is now headed sharply higher while the MACD has been improving toward the zero line. The chart printed a hollow red Hammer, bullish intra-week activity within the move down. It is extremely out of the Bollinger bands and under the longer term resistance at 42.54. Like the Shanghai Composite though the RSI and MACD on the weekly time-frame suggest more downside. Look for Emerging markets to continue the short term up move in the coming week with resistance above 42.54 at 43.70. A move lower finds support at 38 and then 35.91.

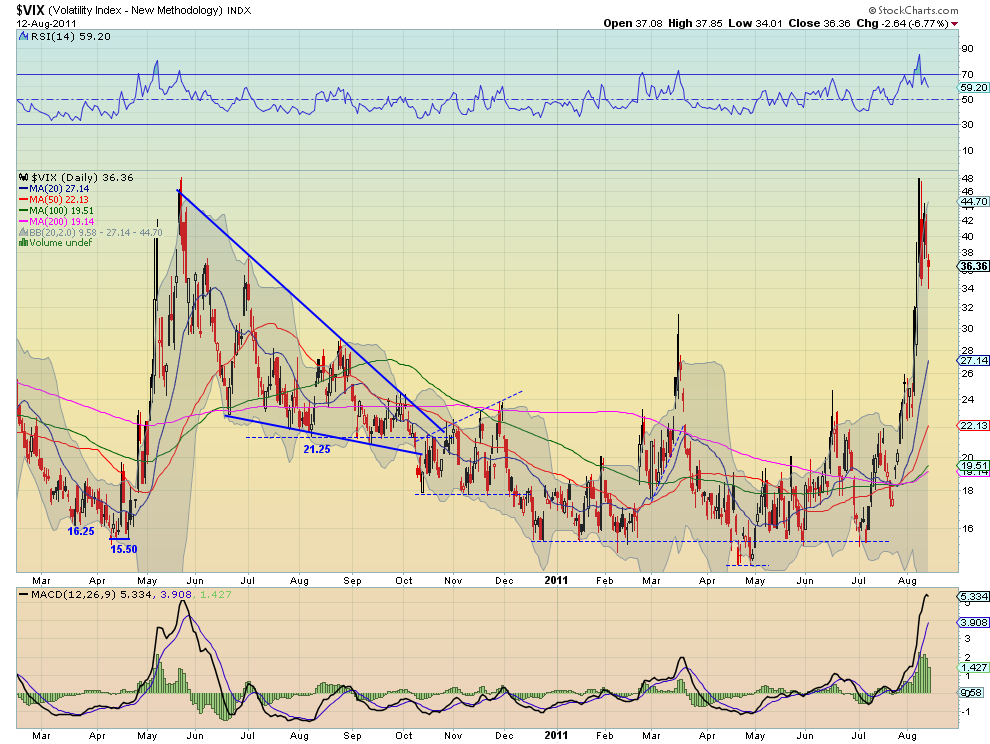
VIX Daily, $VIX

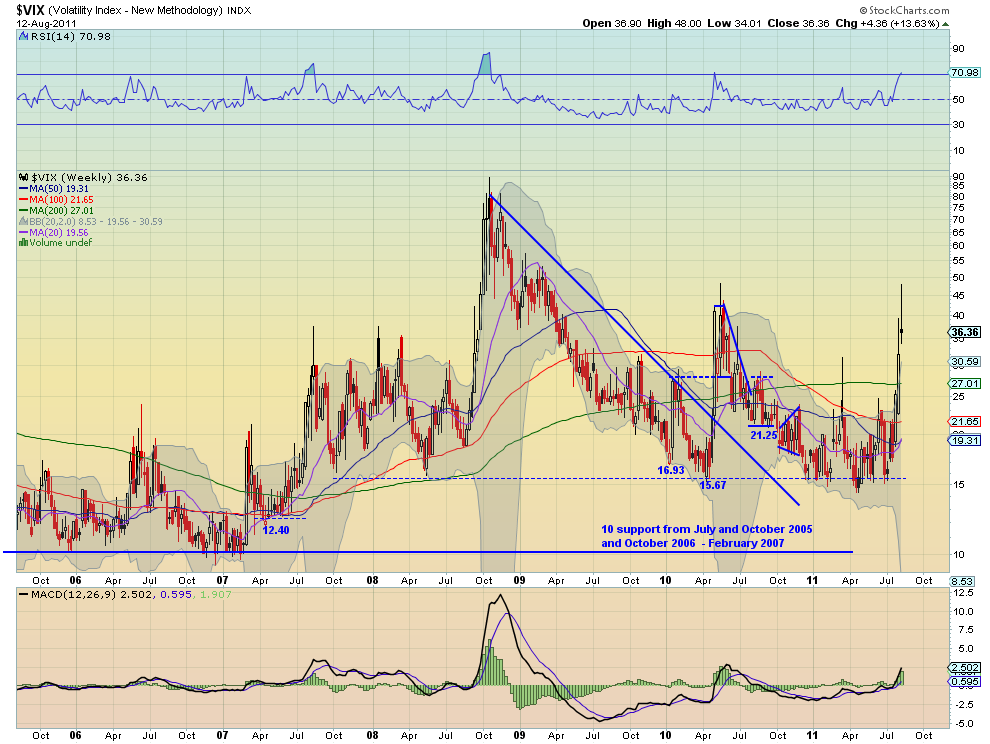
VIX Weekly, $VIX

The Volatility Index spiked to the 48 level where it stopped in May 2010 before pulling back as the week progressed. It did find support though at the 34 level that has been important in the past. With the RSI moving lower and the MACD declining this time-frame suggest that volatility will fall in the short term. The weekly chart printed a shooting star with the RSI rising but reaching the overbought level where it has sold off 4 of the last 5 times. The MACD is still rising on this time-frame. With the weekly chart also out of the Bollinger bands look for Volatility for the week to continue lower. If it does not break 34 then all bets are off and the markets are in big trouble.

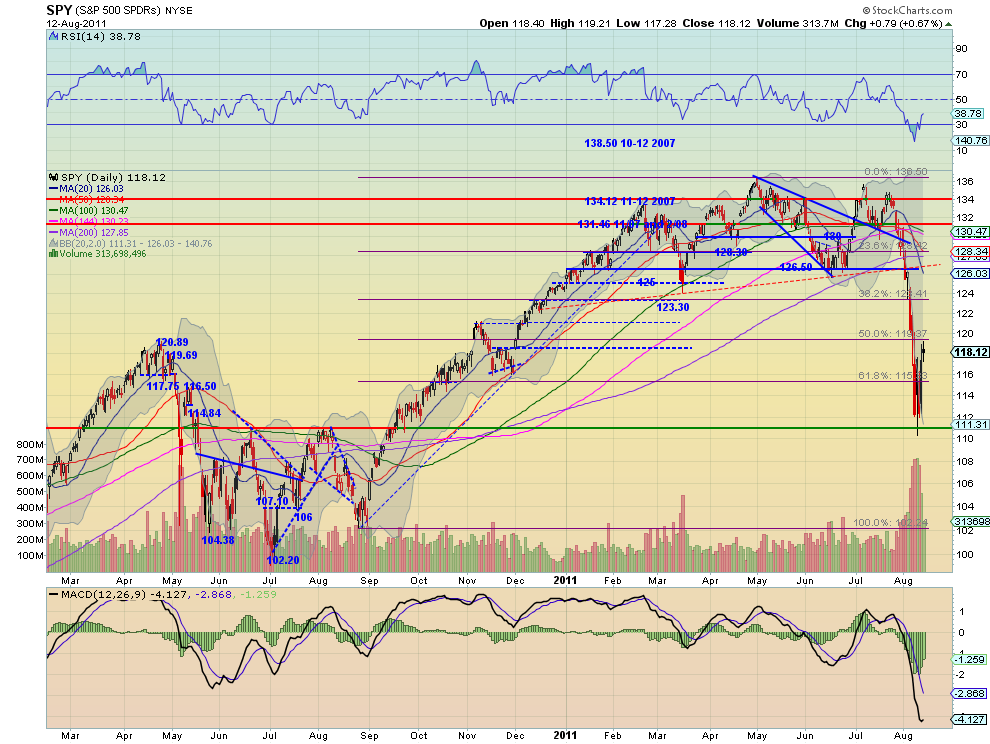
SPY Daily, $SPY

SPY Weekly, $SPY

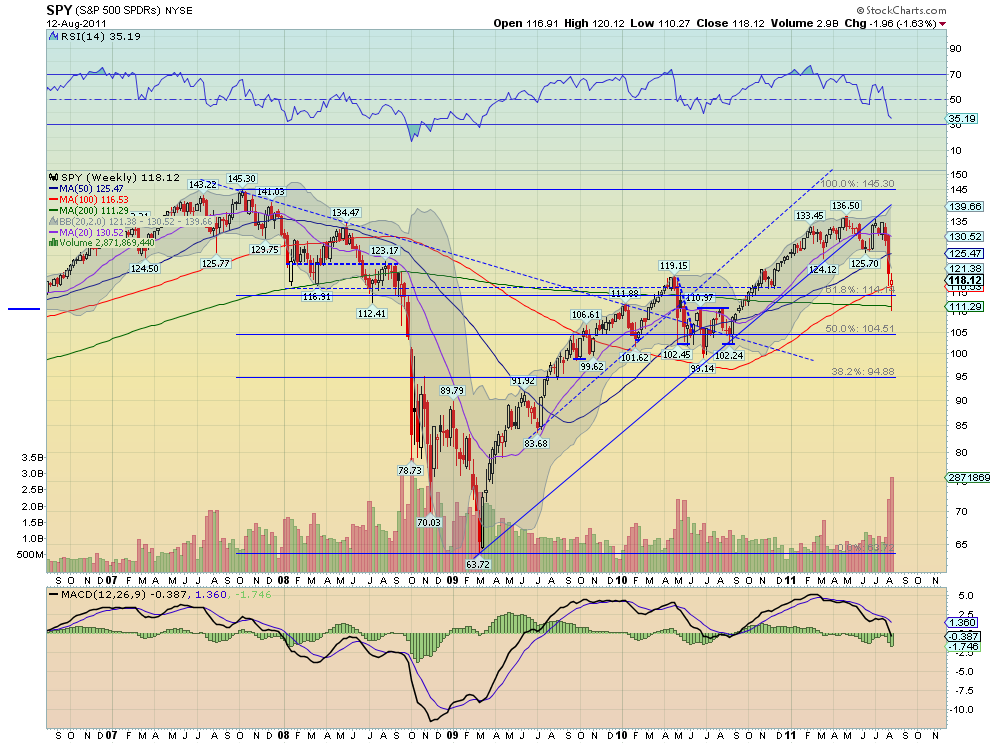
The SPY broke lower Monday and then bounced in a range for the week finishing Friday with a doji candle just above that range but under last Friday’s close. The RSI on the daily chart bottomed and is rising sharply while the MACD also has been improving off of the low from Wednesday. The weekly chart shows a hollow red Hammer candle at support with the RSI and MACD still pointing lower. It is well outside of the Bollinger band on this time-frame and printed volume not seen since the March 2009 lows. Look for next week to be biased higher with resistance at 119.20 and 121.50 above that, but the trend remains lower. It would take a move above 126.50 to negate the trend. A move lower would find some support at 116 and 113 followed by 111.15.

IWM Daily, $IWM

IWM Weekly, $IWM

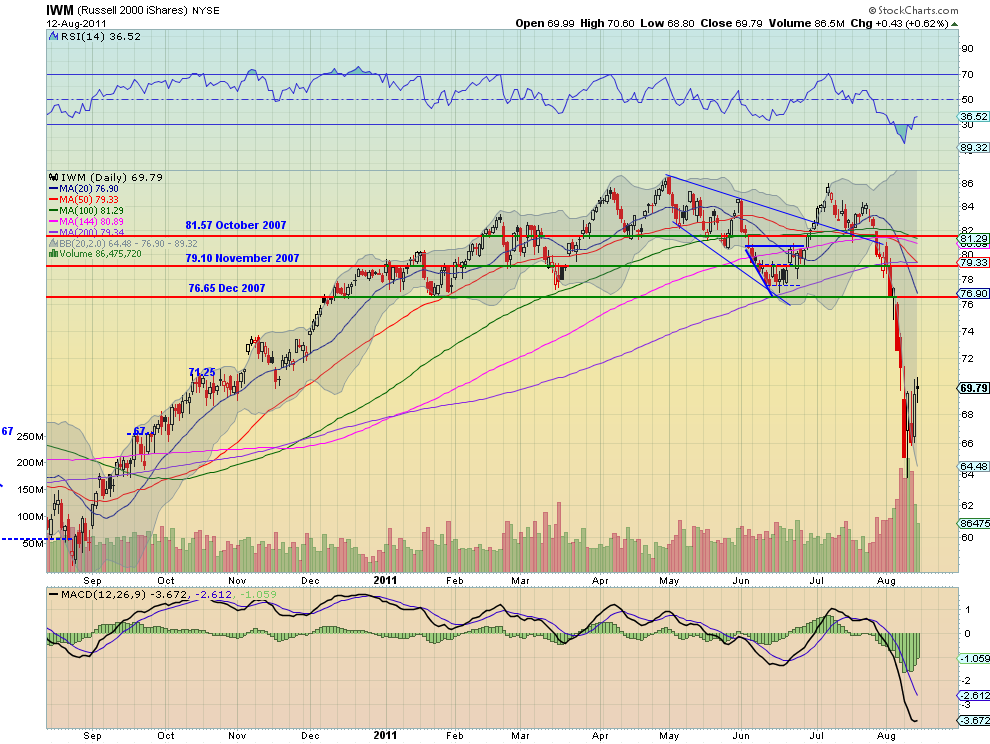
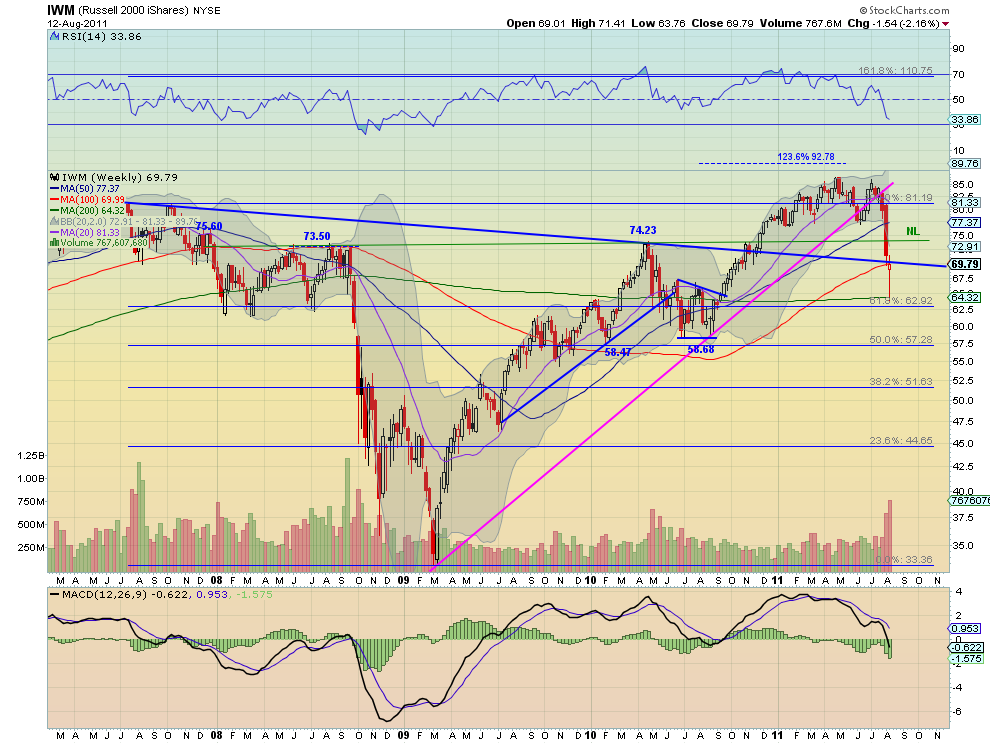
The IWM also broke lower Monday and then bounced in a range for the week finishing Friday with a doji candle just above that range but under last Friday’s close. The RSI on the daily chart bottomed and is rising sharply while the MACD also has been improving off of the low from Wednesday. The weekly chart shows a hollow red Hammer candle just below the resistance of the extended downtrend line from the 2007 highs, with the RSI and MACD still pointing lower. It is well outside of the Bollinger band on this time-frame and printed volume not seen since the 2008 move lower. Look for next week to be biased higher with resistance at 70.40 and 74 above that, but the trend remains lower. It would take a move above 76.75 to negate the trend. A move lower would find some support at 68 and 67 followed by 65.50.

QQQ Daily, $QQQ

QQQ Weekly, $QQQ

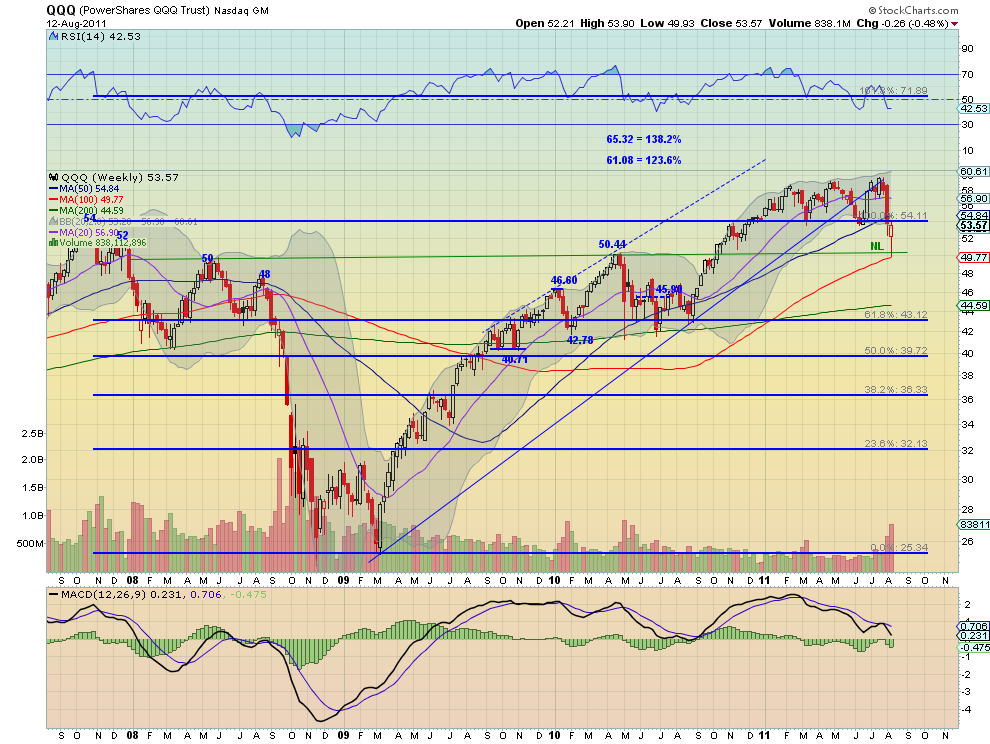
Finally the QQQ also broke lower Monday and then bounced in its range for the week finishing Friday with a doji candle just above that range but under last Friday’s close. The RSI on the daily chart bottomed and is rising sharply while the MACD also has been improving off of the low from Wednesday. This is the only index that has moved back into the previous six month consolidation channel. The weekly chart shows a hollow red Hammer candle just below the resistance of the 2007 highs, with the RSI just turning flat and the MACD still pointing lower. It is close but outside of the Bollinger band on this time-frame. Look for next week to be biased higher with resistance at 54.26 and 55.50 above that, and a move into the channel. A move lower would find some support at 52 and 50.60 followed by 47.40.

Next week looks like a reversal of this week. Gold looks heading lower while Crude Oil has a short term bias higher in a downtrend. The US Dollar Index looks to continue sideways in the 73.50-76 range, while US Treasuries look to continue lower in an uptrend. The Shanghai Composite and Emerging Markets look to be headed higher. Volatility looks biased to the downside with a move under 34 key to continuing lower, and giving a bias to the upside for the Equity Indexes SPY, IWM and QQQ, also within a downtrend. the big question looks to be whether this is a dead cat bounce or for real. Use this information as you prepare for the coming week and trade’m well.

Wall Street Bailout: Too Big To Collect?


In light of the recent S&P downgrade, the U.S. suddenly looks more dire financially than before the downgrade ( (at least psychologically, as the country still has the ability to borrow at its pre-downgrade low interest rates.) So it would make tracking down Wall Street bailout money still outstanding a good start to reclaim some of the lost treasure.

However, more than two years after the bailout, there never seems to be a straight answer to these two questions: (1) Where has Uncle Sams' bailout money gone? (2) Has the money been paid back yet?

The Treasury Dept. already declared milestone reached in June, 2010 when "Repayments to Taxpayers Surpass Tarp Funds Outstanding." New York Times and CNNMoney both keep stattistics of the bailout and tell a different story from the government's account. NYT says fund outflow has amounted to $550 billion, funds returned is $70.1 billion, that leaves amount outstanding $480 billion. CNNMoney data suggest $475 billion out of the door, $118.5 billion returned, netted to $357 billion still needs to be collected.

Pro Publica also keeps track of a bailout list including the $700 billion TARP program, and the separate bailout of Fannie Mae and Freddie Mac. According to Pro Publica,

"Altogether, accounting for both bailouts, $580 billion has gone out the door—invested, loaned, or paid out—while $273 billion has been returned. The Treasury has been earning a return on most of the money invested or loaned. So far, it has earned $67 billion. When those revenues are taken into account, $239 billion is the net still outstanding as of August10, 2011."
The spreadsheet downloaded from Pro Publica shows the top 5 bailout deadbeat recipients--Fannie Mae, AIG, Freddie Mac, General Motors, and GMAC (now Ally Financial)--account for almost 97% ($232 billion) of the total net amount still outstanding.

Now, the more jaw dropping numbers come from a recent analysis done by the Center for Media and Decmocracy (CMD), pointing to an actual total still outstanding at $1.5 trillion (See Chart),
".....while the TARP bailout of Wall Street (not including the bailout of the auto industry) amounted to $330 billion, the government also quietly spent $4.4 trillion more in efforts to stave off the collapse of the financial and mortgage lending sectors. The majority of these funds ($3.9 trillion) came from the Federal Reserve, which undertook the actions citing an obscure section of its charter."
"..$4.8 trillion went out the door to aid financial companies and repair the damage they caused to financial markets, and $1.5 trillion of that is still outstanding."

CMD keeps a list of 'Total Wall Street Bailout Cost' here, but not down to the detail recipient level. CMD’s analysis also shows that most of the bailout funds were comprised of aid to banks, in the form of loans with below-market interest rates and for questionable collateral to banks directly from the Treasury and Federal Reserve (See Chart).


The $4.8 trillion bailout of the financial sector, according to CMD, also dwarfs the $600 billion that the Federal Reserve spent on the QE2 that was intended to stimulate the broader economy.

Andrew Ross Sorkin at NYT also pointed out that when WSJ quoted the U.S. Treasury that "the projected cost of the bailout is shrinking" to $89 billion from an earlier estimate of $250 billion (see graph below),
"....there’s a small problem with all this happy Washington math: it doesn’t take into account the piles of cash we’re likely to lose on Fannie Mae and Freddie Mac..... The overall math also doesn’t account for the more than $1 trillion the Federal Reserve pumped into the system through loans to Wall Street that were virtually interest-free." 

Source: WSJ.com

So it looks like the bailout could have different ROIs (return on investments), depending on what you count as "investments."

Fannie and Freddie just recently asked for $7 billion more bailout funds, and looking at the domestic housing market and the current economic outlook, American taxpayers probably should consider it a draw even if just no future funding will be directed to the two government-sponsored housing entities, let along expecting a single dime coming back form Fannie and Freddie.

But the sad thing is that even if Uncle Sam gets to collect the whole 1.5 trillion as calculated by the CMD, it would not have made a difference in the debt and deficit of the U.S. government (as the S&P Rating Agency has taught us.)

See the original article >>

Lack of Panic Suggests More Market Downside to Come – And Buying Opportunities After That

By Keith Fitz-Gerald

According to the Bloomberg News, the recent sell-off has scraped a staggering $3 trillion from U.S. markets and a whopping $8 trillion from global markets between July 22 and Monday of this week.

And still the pros aren't panicking, which suggests to me there's more downside ahead - a lot more.

Indeed, I see the very real possibility that we could re-test the bear-market lows of March 2009.

You can dismiss this warning if you wish. But having navigated global financial markets for more than 20 years, I've learned that sentiment is one of the most powerful indicators of all - perhaps the most powerful indicator.

So the fact that the pros - including our politicians (I think everyone now understands that Wall Street and Washington are linked at the hip) - haven't panicked in the face of this bloodbath suggests one thing: They believe they understand the risks that we face - and that's almost a de facto indication that they don't.

You can analyze all the data you want, run through the market fundamentals and gaze at your technicals until you're in a chart-pattern-induced coma.

At the end of the day, the direction the markets move is entirely dependent on how people feel.

And that, my friends, is the classic definition of market sentiment.

How do we know?

When it comes to professionals, we can turn to the Investors Intelligence Survey, which evaluates marketing-timing signals from professional-investment newsletters nationwide. As of Tuesday, the bulls represented 47.3% - and the bears held their own, with 23.7%. That compares with the prior week's data, which showed 46.3% in the bullish camp and 24.7% of the bearish persuasion.

Or the AAII Investor Sentiment Survey, which attempts to measure the percentage of individual investors that are bullish, bearish or simply neutral on the markets. For the week ended Aug. 20, it's pretty balanced - with 33.4% bullish, 21.8% neutral and 44.8% bearish.

Both are far from the extreme readings that are typically associated with market reversals - either to the downside or, as many investors are now wondering, to the upside.

On May 2, I stated in a Money Morning column that "even the most strident pessimists had become optimists." Therefore, I was extremely concerned about the downturn that has led us to where we are today. That's the sort of extreme I am talking about - when everybody goes to one side of the boat. 

We haven't reached that extreme in sentiment, yet - in the broader markets. And that's especially problematic. My good friend, Dr. John L. Casti, one of the world's leading experts on the development of early warning methods for extreme events in human society, notes in his book, "Mood Matters: From Rising Skirt Lengths to the Collapse of World Powers," that "human hubris is about as reliable an indicator as you can find for financial trouble" - especially when it reaches extremes.

But in two critical areas, we are approaching that extreme : market volatility and gold prices. Not surprisingly, we've seen hundreds of millions of dollars flood into both investments in recent weeks.

According to CNBC, as the Dow was plummeting more than 600 points last Monday, traders poured $162 million into the iPath S&P 500 VIX Short-Term Futures ETN (NYSE: VXX) . And this is actually from people who believe volatility would go down, which implies a rally that may be more than the single- or double- day bounces we've seen this week.

It's much the same with gold: New investments in the SPDR Gold Trust Exchange Traded Fund (NYSE: GLD) rose by $1.3 billion on Monday alone. In other words, that one-day infusion was equal to 48% of the $2.68 billion that flowed into the fund for all of July.

If that doesn't stun you, this factoid will: If gold investments continue at this rate, the total amount held by the Gold Trust could actually surpass what is invested in the SPDR S&P 500 ETF (NYSE: SPY)!

And unlike when Apple Inc. (Nasdaq: AAPL) recently surpassed Exxon Mobil Corp. (NYSE: XOM) in market capitalization to become the world's most valuable company, this really will be news because it will herald the next leg down.

And it will happen. How do I know?

Simple. Although we led the charge -- and were way ahead of "the crowd " -- my colleagues and I here at Money Morning are no longer lone voices in the woods predicting gold will hit $2,500 an ounce.

Since 2001, when I first began encouraging clients and subscribers to begin accumulating the "yellow metal" - and from the very beginning of this crisis - gold has risen from a low of $255 to where it is now.

JP Morgan Chase & Co. Inc. (NYSE: JPM) noted Tuesday that gold prices may hit $2,500 by year's end. Goldman Sachs Group Inc. (NYSE: GS), while not biting on the $2,500, has come out of the woodwork with an $1,860-an-ounce target, according to The Financial Times.

Legendary investor Jim Rogers has also notably and vigorously advocated gold, and puts prices in the same neighborhood. (Both of us, incidentally, are worried about the run- up right now, and hope it pulls back - so we can buy more!)

With all this playing out, why aren't the pros panicked?

In a word: perspective.

The average individual investor looks at this market and is directly vested in its performance − because that performance, on any given day, has a direct, quantifiable and highly personal bottom line. Panic, therefore, is a logical and entirely understandable emotion - albeit one that leads to lots of bad decisions.

It's the one emotion retail investors would be wise to control. That's why we spend so much time at Money Morning and in our sister publication, The Money Map Report, on such stress -reducing tactics as trailing stops, profit targets and disciplined plans that one can set up ahead of time.

Professional investors, in contrast, tend to look at charts and figures. And by virtue of what they do, they have learned to calmly, coldly and analytically evaluate what they see.

So far, what they see is a normal market correction.

Technically speaking, we're just barely under the 200-day moving average. And the U.S. Federal Reserve is widely expected to gallop to the rescue again - as are the other central banks around the world. So traders are looking at this as a point of entry.

The real fireworks will begin when they have to scramble to get short or get out.

That's when we'll be buying.

Relative Strength of Industrials and Technology vs. S&P 500

by Bespoke Investment Group

The chart below shows the relative strength of the Industrials and Technology sectors versus the S&P 500. When the lines are rising, it indicates that the sector is outperforming the S&P 500 and vice versa when the line is falling. So far this Summer, it's been rough sledding for the Industrials sector. In June, the sector was handily outperforming the S&P 500, but now just two months later the sector is underperforming the S&P 500 by its largest amount in a year.

While Industrials have been slumping, the Technology sector has been ramping. Although there have been numerous calls to avoid the sector during this downturn, Tech stocks have been handily outperforming the market. In fact, heading into today, Technology was the least oversold of the ten sectors.


See the original article >>

Market And Economic Indicators

by Macro Story

A weekly update of market and economic indicators across various asset classes. 

Copper VS SPX
Copper VS Copper Commercial Net Position
Skew Vix Divergence VS SPX (short term)
Skew Vix Divergence VS SPX (long term)
Margin Debt VS SPX
30 Year Treasury Yield VS SPX
Corporate Bond Spreads (HG/IG) VS SPX
AAII Investor Sentiment VS SPX
ECRI Weekly Leading Indicator

See the original article >>

Market Bottoms

by Guy Lerner

Speaking of market timing, let’s talk about market bottoms.

My research shows that there are two types of market bottoms: 1) the complex and 2) the extremely oversold. Before getting to the analysis, let me clarify a few things. My data set is daily data of the S&P Depository Receipts (symbol: SPY) going back to 1993. To define a market bottom, I used market sentiment and my definition of the price cycle. The price cycle is the path that prices take from low to high and back to low again. A market that has the potential to bottom (thus having the price cycle reset) occurs when investor sentiment turns bearish (i.e., bull signal). Thus market bottoms — whether they be intermediate bottoms (i.e. occurring on weekly data) or of the secular/ cyclical variety (i.e., March, 2009) — occur when investors are bearish on the markets.

A complex market bottom is defined as a pattern that sees prices initially trading through a support level. Support becomes resistance, and when the resistance level is “re-captured”, then the trend is deemed to have been reversed. The market has bottomed, and prices are moving higher. An example of a complex market bottom is shown in figure 1, a daily chart of the SPY. The time period is from July/ August, 2010. The red dots over the price bars are key pivot points, which help us define the best areas of support (buying) and resistance (selling). Point 1 is a key pivot point that occurred during a time of bearish sentiment. This should have acted as support but it did not as prices gapped below this level (see red arrows on chart). This level was quickly “re-captured” at point 2, so resistance becomes support, and this support was tested at point #3. That is a complex market bottom.

Figure 1. SPY/ daily
The other type of market bottom is the extremely oversold market bottom, and this occurs when prices fall in a crescendo like fashion over a very short period of time. I have defined this as a 10% decline or greater over a period of 5 trading days. This type of bottom leads to a vicious snap back rally or “V” like bottom that in most cases establishes the bottom.

Since 1993, there have been 38 instances where investor sentiment turned bearish (i.e., bull signal). These are areas for a potential market bottom. In approximately 80% of the instances where there was a potential for a market bottom, the market (i.e., SPY) did so by carving out a complex pattern. The extremely oversold market leading to a vicious snap back was seen in about 15% of the market bottoms.

This past week the SPY declined over 10% in 5 trading days; the current snap back that we are seeing at the end of the week here could be consistent with a market bottom even though it is the rarer type of market bottom. As I will discuss in the next article, this type of bottom is more difficult to trade not only because it has occurred with fewer observations but also because there are some big risks associated with these kinds of extreme price movements.

Follow the Tech Leaders?


Tech giants Apple (AAPL) and Amazon.com (AMZN) have held up well despite heavy market volatility, and still-favorable chart patterns make each stock a good buy on an upcoming pullback.
It has been a wild week in the markets, and the ranges in the stock index futures have been incredible. More fireworks are possible on Friday, and while overseas markets are showing nice gains a few hours before the NYSE opening, that does not tell us much about the close.

With two sharp up days and two sharp down days so far, Friday’s close will break the tie. All of the major averages and their respective ETFs closed Thursday well off the week’s worst levels. The Nasdaq 100, as represented by the Powershares QQQ Trust (QQQ), has acted the strongest, and the strength in Cisco Systems (CSCO) helped the market early Thursday.

Since the close on July 22, QQQ is down 8.2% versus a 12.8% drop by the financial-heavy Spyder Trust (SPY), which tracks the S&P 500. The SPDR Diamonds Trust (DIA), which follows the Dow Industrials, is down 12.2% during this time.

Two of the best-known tech bellwethers, Apple, Inc. (AAPL) and Amazon.com (AMZN), have held up even better, but is this important?
chart Click to Enlarge

Chart Analysis: The weekly chart of the Powershares QQQ Trust (QQQ) shows that the uptrend from the 2009 lows, line b, was broken this week, but a close below that level would be more negative. With Thursday’s close, it is down just 1.3% for the week.
  • The support from the 2010 highs (line a) has been tested with the major 38.2% Fibonacci retracement support at $46.85
  • The minor 50% support at $50.55 (calculated from the July 2010 lows) was exceeded this week. A close below this level would be more negative
  • The relative performance, or RS analysis, signaled that the tech sector was going to outperform in early July when it broke through resistance at line c. The long-term uptrend (line d) is still intact
  • The weekly on-balance volume (OBV) looks less positive, as it violated its uptrend, line e, in May and is below its weighted moving average (WMA). It shows a pattern of lower highs and lower lows. The daily OBV is also negative
  • There is next retracement resistance at $54.90-$56
Apple Inc. (AAPL) is down 7.6% from its all-time highs at $404.50, and on the weekly chart, the recent drop looks like just a retest of the July breakout (line f).
  • There is next support at $347 with the major 38.2% support for at $340. The long-term uptrend, line g, is at $324 with the major 50% support at $320. (See latest Fibonacci analysis for AAPL here.)
  • The RS line staged a major breakout in July, overcoming resistance at line h
  • The weekly OBV is trying to turn up from its weighted moving average, but it did not confirm the recent highs. There is key OBV support at line 1
  • The daily OBV is negative, but did confirm the recent highs
  • AAPL is nearly flat for the week with next resistance at $383.50-$385
chart Click to Enlarge

Amazon.com (AMZN) has tested its weekly uptrend, line a, and has so far held well above the last swing low at $181.59. A close below this level would create a pattern of lower lows, which could be the start of a new downtrend.
  • AMZN is currently 12.7% below the recent highs at $227.45
  • The weekly RS analysis still looks strong, as it broke out to the upside in April, overcoming resistance at line b. It is now well above the long-term support at line c
  • The weekly OBV has formed lower highs and did not confirm the recent highs. A break of the uptrend, line d, and the March lows would be more negative
  • A close above the short-term resistance at $205.10 should signal a rally to the 50% retracement resistance at $209.20
Google, Inc. (GOOG) closed above the weekly Starc+ band four weeks ago and is now down 10.4% from the highs. The weekly Starc- band is now at $517 with weekly trend line support, line e, at $477.
  • The RS analysis has formed lower highs (line f) and lower lows (line g) since late 2009. It has recently rallied sharply, but the pattern is still not consistent with that of a market-leading stock
  • The OBV also looks weak, as it violated its uptrend, line h (see circle), early in the year. It now shows a well-established downtrend, line I, which is also negative
  • The daily OBV (not shown) turned positive near the recent lows and is still acting well
  • There is first resistance now at $590-$600 and a close back above $600 would be a short-term positive
What It Means: The powerful nature of the recent market decline should eventually set the stage for a more sustainable rebound. Most are expecting such a rally to fail in the 1200-1220 area in the S&P, as the 50% retracement resistance is at 1229. Typically, when there is such a consensus view, it will either result in a much weaker or much stronger rally.

See the original article >>

The Beginning of the Endgame

By John Mauldin

August 12, 2011

I came away from Maine, and meeting with some of the most astute economists in the world, with a series of impressions that will be the core of this week’s letter. On Friday night, S&P downgraded US debt, and of course I need to comment on that. But as we talked the next two days and into the nights, I came increasingly to the opinion that this is indeed the Beginning of the Endgame. I must admit it has come about faster than I thought. But that is the nature of these things. And so, with no “but first,” let’s jump right in.

The Big Bang Moment

I think it relevant to start off by quoting from my book Endgame, where I quote in turn from what I think is the most important book of the last decade, This Time is Different: Eight Centuries of Financial Folly, by Ken Rogoff and Carmen Reinhart. I truly urge you to read it. The book is consciously designed so you can read the first chapter and the last five and get the thrust of the work. You can order it from www.amazon.com/Different. (The Kindle edition is only $9.99 and makes a perfect companion to my book Endgame [shameless plug].) Quoting from my book:

“We are going to look at several quotes from [This Time is Different], as well as an extensive interview [the authors] graciously granted. We have also taken the great liberty of mixing paragraphs from various chapters that we feel are important. Please note that all the emphasis is our editorial license. Let’s start by looking at part of their conclusion, which we think eloquently sums up the problems we face:

“‘The lesson of history, then, is that even as institutions and policy makers improve, there will always be a temptation to stretch the limits. Just as an individual can go bankrupt no matter how rich she starts out, a financial system can collapse under the pressure of greed, politics, and profits no matter how well regulated it seems to be. Technology has changed, the height of humans has changed, and fashions have changed.

‘Yet the ability of governments and investors to delude themselves, giving rise to periodic bouts of euphoria that usually end in tears, seems to have remained a constant. No careful reader of Friedman and Schwartz will be surprised by this lesson about the ability of governments to mismanage financial markets, a key theme of their analysis.

‘As for financial markets, we have come full circle to the concept of financial fragility in economies with massive indebtedness. All too often, periods of heavy borrowing can take place
in a bubble and last for a surprisingly long time. But highly leveraged economies, particularly those in which continual rollover of short-term debt is sustained only by confidence in relatively illiquid underlying assets, seldom survive forever, particularly if leverage continues to grow unchecked.
‘This time may seem different, but all too often a deeper look shows it is not. Encouragingly, history does point to warning signs that policy makers can look at to assess risk—if only they do not become too drunk with their credit bubble–fueled success and say, as their predecessors have for centuries, “This time is different.”’

[Back to my voice] “Sadly, the lesson is not a happy one. There are no good endings once you start down a deleveraging path. As I have been writing for several years, much of the entire developed world is now faced with choosing from among several bad choices, some being worse than others.”
And this is key. Read it twice (at least!):

“‘Perhaps more than anything else, failure to recognize the precariousness and fickleness of confidence—especially in cases in which large short-term debts need to be rolled over
continuously—is the key factor that gives rise to the this-time-is-different syndrome. Highly indebted governments, banks, or corporations can seem to be merrily rolling along for an extended period, when bang! — confidence collapses, lenders disappear, and a crisis hits.

‘Economic theory tells us that it is precisely the fickle nature of confidence, including its dependence on the public’s expectation of future events, which makes it so difficult to predict the timing of debt crises. High debt levels lead, in many mathematical economics models, to “multiple equilibria” in which the debt level might be sustained—or might not be. Economists do not have a terribly good idea of what kinds of events shift confidence and of how to concretely assess confidence vulnerability. What one does see, again and again, in the history of financial crises is that when an accident is waiting to happen, it eventually does. When countries become too deeply indebted, they are headed for trouble. When debt-fueled asset price explosions seem too good to be true, they probably are. But the exact timing can be very difficult to guess, and a crisis that seems imminent can sometimes take years to ignite.’”

Bang, Indeed!

When the subprime crisis started, we were told by numerous authorities (including Ben Bernanke) that the problems would be “contained.” But by 2006 it was clear to anyone who studied the toxic instruments that the losses would be in the hundreds of billions. I estimated $400 billion, which just goes to show that I’m an optimist. That crisis spread to banks all over Europe and then back to the US. Authorities used every bullet in their guns, every legal means and –well let’s be charitable, perhaps they pushed the rules a bit – to try and stem the tide. And then we had a “Lehman moment” and all at once the markets seemingly froze. It was Bang!”

My sense is that the S&P downgrade is like that moment when we were told things would be contained. In and of itself, the downgrade is not that important. What did we learn that we did not already know? The US is headed for a financial crisis if they do not get the deficit under control? This is news?

But I think it forces S&P to take a very hard look at France, whose loss of AAA would bring into doubt the whole EFSF mechanism. And Spain and Italy must come under scrutiny if S&P’s move in the US is not to be seen as politically motivated. The main result of the downgrade may not be here in the US but in Europe, where there are already issues. A series of downgrades (which are warranted if the US one was) would be traumatic.

My London partner Niels Jensen penned this observation:

“If France is downgraded, a number of French banks will almost certainly be downgraded, following which other European banks will face the same destiny. Such a scenario has the potential to cause calamity across Europe. The 90 European banks which recently went through the (so-called) stress test organized by the European Banking Authority need to roll a total of €5.4 trillion1 (!) of debt over the next 24 months. A massive amount even during the best of times. Probably undoable during times of stress.

“As Ambrose Evans-Pritchard, in consultation with Willem Buiter of Citigroup, pointed out in the Daily Telegraph over the weekend:

“ ‘... the issue is not how long Italy and Spain can ride out the storm in bond markets. There would be a banking and insurance crisis long before sovereign defaults came into play, simply because the fall in bond prices on the secondary market is causing carnage to bank books (among other transmission mechanisms).’

“With its downgrade of U.S. sovereign debt, Standard and Poors has started a chain of events which can only make things worse in an already crisis-hit eurozone. For that reason, the decision to downgrade was not only badly timed but also ill considered; that it was probably justified is of little relevance at the moment.”

My latest trip to Europe and discussions with friends in Maine, plus my reading, simply reinforces my sense that we are seeing Europe unravel, or at the very least come to a very important crossroads where they must make a fateful decision. And let’s make no mistake, this is a demon of a problem of their own making. Monetary union without fiscal union will not work in a world where there are so many cultures and different traditions. But how does that work? How do you exorcise that demon?

Which leads me to a sidebar. Michael Lewis is one of the greatest writers of our time. He is just brilliant. He has a piece in the latest Vanity Fair on Germany and the crisis in Europe. It is rather long (about 15 pages in a Word doc) and makes some rather interesting (if odd) scatological references, trying to explain the German world view, so if you are of a delicate mindset, perhaps you should confine yourself to the few paragraphs I quote here. But I do suggest you set aside some time to read the entire piece. (You can read the whole thing at http://www.vanityfair.com/business/features/2011/09/europe-201109.) Here is the editor’s intro to the piece:

“It’s the Economy, Dummkopf!"

“With Greece and Ireland in economic shreds, while Portugal, Spain, and perhaps even Italy head south, only one nation can save Europe from financial Armageddon: a highly reluctant Germany. The ironies—like the fact that bankers from Düsseldorf were the ultimate patsies in Wall Street’s con game—pile up quickly as Michael Lewis investigates German attitudes toward money, excrement, and the country’s Nazi past, all of which help explain its peculiar new status.”

And from the middle of the piece, these insights:

“Greeks are still refusing to pay their taxes, in other words. But it is only one of many Greek sins. ‘They are also having a problem with the structural reform. Their labor market is changing—but not as fast as it needs to,’ he continues. ‘Due to the developments in the last 10 years, a similar job in Germany pays 55,000 euros. In Greece it is 70,000.’ To get around pay restraints in the calendar year the Greek government simply paid employees a 13th and even 14th monthly salary—months that didn’t exist. ‘There needs to be a change of the relationship between people and the government,’ he continues. ‘It is not a task that can be done in three months. You need time.’ He couldn’t put it more bluntly: if the Greeks and the Germans are to coexist in a currency union, the Greeks need to change who they are.

“This is unlikely to happen soon enough to matter. The Greeks not only have massive debts but are still running big deficits. Trapped by an artificially strong currency, they cannot turn these deficits into surpluses, even if they do everything that outsiders ask them to do. Their exports, priced in euros, remain expensive. The German government wants the Greeks to slash the size of their government, but that will also slow economic growth and reduce tax revenues. And so one of two things must happen. Either Germans must agree to a new system in which they would be fiscally integrated with other European countries as Indiana is integrated with Mississippi: the tax dollars of ordinary Germans would go into a common coffer and be used to pay for the lifestyle of ordinary Greeks. Or the Greeks (and probably, eventually, every non-German) must introduce ‘structural reform,’ a euphemism for magically and radically transforming themselves into a people as efficient and productive as the Germans. The first solution is pleasant for Greeks but painful for Germans. The second solution is pleasant for Germans but painful, even suicidal, for Greeks.

“The only economically plausible scenario is that Germans, with a bit of help from a rapidly shrinking population of solvent European countries, suck it up, work harder, and pay for everyone else. But what is economically plausible appears to be politically unacceptable. The German people all know at least one fact about the euro: that before they agreed to trade in their deutsche marks their leaders promised them, explicitly, they would never be required to bail out other countries. That rule was created with the founding of the European Central Bank (E.C.B.)—and was violated a year ago. The German public is every day more upset by the violation—so upset that Chancellor Angela Merkel, who has a reputation for reading the public mood, hasn’t even bothered to try to go before the German people to persuade them that it might be in their interests to help the Greeks.

“That is why Europe’s money problems feel not just problematic but intractable. It’s why Greeks are now mailing bombs to Merkel, and thugs in Berlin are hurling stones through the window of the Greek consulate. And it’s why European leaders have done nothing but delay the inevitable reckoning, by scrambling every few months to find cash to plug the ever growing economic holes in Greece and Ireland and Portugal and praying that even bigger and more alarming holes in Spain, Italy, and even France refrain from revealing themselves.
Until now the European Central Bank, in Frankfurt, has been the main source of this cash. The E.C.B. was designed to behave with the same discipline as the German Bundesbank, but it has morphed into something very different. Since the start of the financial crisis it has bought, outright, something like $80 billion of Greek and Irish and Portuguese government bonds, and lent another $450 billion or so to various European governments and European banks, accepting virtually any collateral, including Greek government bonds.

“But the E.C.B. has a rule—and the Germans think the rule very important—that they cannot accept as collateral bonds classified by the U.S. ratings agencies as in default. Given that they once had a rule against buying bonds outright in the open market, and another rule against government bailouts, it’s a little odd that they have gotten so hung up on this technicality. But they have. If Greece defaults on its debt, the E.C.B. will not only lose a pile on its holdings of Greek bonds but must return the bonds to the European banks, and the European banks must fork over $450 billion in cash. The E.C.B. itself might face insolvency, which would mean turning for funds to its solvent member governments, led by Germany. (The senior official at the Bundesbank told me they already have thought about how to deal with the request. ‘We have 3,400 tons of gold,’ he said. ‘We are the only country that has not sold its original allotment from the [late 1940s]. So we are covered to some extent.’) The bigger problem with a Greek default is that it might well force other European countries and their banks into default. At the very least it would create panic and confusion in the market for both sovereign and bank debt, at a time when a lot of banks and at least two big European debt-ridden countries, Italy and Spain, cannot afford panic and confusion.

“At the bottom of this unholy mess, from the point of view of the German Finance Ministry, is the unwillingness, or inability, of the Greeks to change their behavior.

“That was what the currency union always implied: entire peoples had to change their ways of life. Conceived as a tool for integrating Germany into Europe, and preventing Germans from dominating others, it has become the opposite. For better or for worse, the Germans now own Europe. If the rest of Europe is to continue to enjoy the benefits of what is essentially a German currency, they need to become more German. And so, once again, all sorts of people who would rather not think about what it means to be ‘German’ are compelled to do so.”

The Long and Winding Road to Crisis

As I will show below, the US (indeed much of the world) is on the edge of yet another recession. It will not take much to push us into one, just a small shock, like say a banking crisis in Europe, alluded to by Lewis and something I have been writing about for a year.

That being said, the apparent willingness of the Germans to come up with creative ideas (and to get the French to go along) to fund the various nations in crisis, in order to avoid technical defaults, is somewhat amazing. And if there was an election today and the socialists and Greens won in Germany, they would be even more open to the idea of a eurobond, to be somehow guaranteed by member countries. The current EFSF can deal with Greece, Ireland, and Portugal until maybe 2013, and the next version will be large enough to deal with Spain, unless of course the Eurozone elites decide to call it quits, which is something they have not shown the slightest hint of doing. What is more likely is that we lurch from crisis to crisis, with each crisis somehow being averted by throwing more money at it, until the debt of the AAA guarantors like France (and to a lesser extent Italy) starts to be called into question by the markets.

Remember, the demographics of Spain and Italy are horrendous, soon to be on a level with Japan. The government portion of GDP in France is already 53% (not a typo!) and is only going to get worse as aging Boomers have been promised monster benefits that simply cannot be provided without Greek-level austerities. Their future numbers are worse than those of the US.

This can go on for a long time, or it can end in a Bang! moment this year. That is the nature of the lesson from Rogoff and Reinhart. Look at Japan. They took what were functionally insolvent banks and kept them going for decades. Where there is a political will there can be a way … but there will be an Endgame. That is also the lesson we learn from history. Japan will not be able to stave off a crisis of major proportions forever. Neither will Europe, unless they all become Germans in their national accounting.

Are We Already in Recession?

My friend Barry Ritholtz posted the above question today, and wrote:

“Bloomberg reported today that “Consumer Sentiment Plunged to Three-Decade Low.” That sent me scurrying to find some charts, and I ended up liking the two from UBS strategist Andy Lees, at bottom.

“The first one is an overlay the University of Michigan consumer confidence index vs the Conference Board’s data. The second chart shows the long term history of the Conference Board data. At an implied level of 43.37 we would be in recession now; not only that but a deep recession.

“As the charts show, the ABC index has diverged from the Conference Board data for some time now. The correlation between consumer confidence and recession might not hold this time — although that would be the first split for 40 plus years. There is also an implication from this data series that we are already in recession. Given yesterday’s data showing both imports and exports falling, we may have an implied Q2 GDP revised lower by 0.8% to 0.5% annualized growth — putting Q2 into the negative category.
“Hence, it is not unfeasible that we could be the verge of recession.”


And that brings me to a chart I asked Rich Yamarone (chief econ type at Bloomberg) to update for me. Again, it is about the horrific consumer confidence number that came in today, but this time it is correlated with GDP. As you can see, there is a close correlation. With GDP growth of less than 1% for the last six months, asking if we are close to or already in a recession is not a question without merit. And either way, this does not bode well for the long-term direction of stocks and corporate earnings. Consumer confidence is really saying that a recession is in the cards. Maybe it is just weariness with the political malaise (which would be understandable), but we should pay attention.

And while I won’t print the chart again, every time year-over-year GDP growth falls below 2%, we end up in a recession. It is now 1.6%. Past performance is not indicative of future recessions, but the trend is not in our favor.

So What Can We Do?

The economy is getting weaker. What can we do? The short answer is, sadly, not much. There were some in Maine who argued for more fiscal stimulus, but I think there is little political will for another major stimulus program. The last one got us up to 3% GDP growth before we fell back, and all we got was a major debt bill and a higher level of government spending. I fully get that lowering government spending will have negative short-term effects, but we are at the point in the Endgame where we must bite the bullet.

And fiscal policy is becoming a drag on the entire Eurozone, as well as Great Britain. Austerity may be warranted, but is has consequences.

What about QE3? Let’s look at how that last move turned out. We ended up with more money on the Fed’s balance sheet and higher commodity prices. The NFIB survey I cited last week showed there was no great demand on the part of small business for loans. 91% had what they needed. What they want are sales and customers! The trade data yesterday showed exports fell by over $2.3 billion last month. That suggests a slowing world economy. Which is borne out by numerous other indicators.

One has to applaud the Chinese for allowing their currency to rise by a significant (for them) amount this week, as almost every other government (including Switzerland) wants a weaker currency. Everyone can’t devalue at the same time, just as everyone cannot export their way out of this crisis. Someone has to buy!
In short, there are no easy solutions. We have just about used up all our “rabbits in the hat” as far as fiscal and monetary policy are concerned. We now need to focus on what we can do to get out of the way of the private sector, so it can find ways to create new businesses and jobs. And that means figuring out how to get money to new businesses, because that is where net new jobs come from. But that takes time – and is a subject for another letter, as it is time to hit the send button.

Home and then Ireland, London, and Geneva

I am home for (can you believe it?) more than 40 days, which, even with the Texas heat, I need. Then I’m off to Ireland, Geneva, and a few days in London. I am sure I will be making at least one presentation in London.

Maine was more serious this time. I think more of us realize that things are going to get harder and more volatile. While our group is not exactly indigent, we do get what all this means. On Sunday night, Trey came to me. He had been listening. “Dad, it is good for you that you wrote about all this already and are right, but I don’t think it’s so good for the rest of us.” And he is right.

Book sales have been quite steady, as more and more people are realizing that we truly are at the Endgame, and as we try to lay out how it plays out for us all. There is a lot of data in the book, and we back up our predictions with sources. As one reader wrote:

“John, I hope all is well. I just wanted to drop you a note and tell you how much I am enjoying Endgame. As a guy with a degree in economics, I read a lot of books trying to explain macroeconomics of the times, but I have to tell you this is the single best book I have read explaining how macroeconomics works to regular people like me. You have done a great service to your readers, as you do every day. Best, Steve”

You can read reviews and buy it on Amazon at www.amazon.com/Endgame.
It really is time to hit the send button and find something to eat. I am starved – and maybe I’ll catch a late movie. Have a great week.

Your glad God invented air conditioning analyst,

John Mauldin

See the original article >>
Follow Us