by Greg Harmon
Last week’s review of the macro market indicators looked interesting on many levels. Gold appeared ready to consolidate, if only for a couple days within the uptrend while Oil could consolidate before continuing the fall. The US Dollar Index looked to drift higher in the 73 to 76 range while US Treasuries pullback. The Shanghai Composite appeared headed lower toward support and Emerging Markets might consolidate or bounce a bit before doing the same. The spike in Volatility looked to have more room to the upside but showed signs of pulling back at least early in the week. The Equity Index ETF’s SPY, IWM and QQQ appeared set to bounce early next week, but the SPY and IWM charts look broken on many timeframes and headed lower. The QQQ was a bit of an enigma as it had maintained a hold at support. The QQQ’s continuing to hold and move higher would be a signal that the broad downturn may be ending. On the other hand if the SPY and IWM continue lower as expected in the intermediate term the QQQ will likely join them lower.
The week began with a bang as S&P downgraded the US debt late last Friday, removing the expected consolidation. On Monday Gold moved higher quickly and Crude Oil fell. Treasuries ran higher with the added catalyst of European fears and the US Dollar Index held steady but printing wide range doji days. The Shanghai Composite fell and Emerging Markets followed. Volatility spiked and the equity indexes SPY, IWM and QQQ pushed lower fast. By Wednesday morning a lower support area was forming for equities and Oil with higher resistance for Treasuries and Gold. Thursday began the reversal for all which then continued Friday in a narrow range. What does this all mean for the coming week? Let’s look at some charts.
As always you can see details of individual charts and more on my StockTwits feed and on chartly.)
Gold Weekly, $GC_F
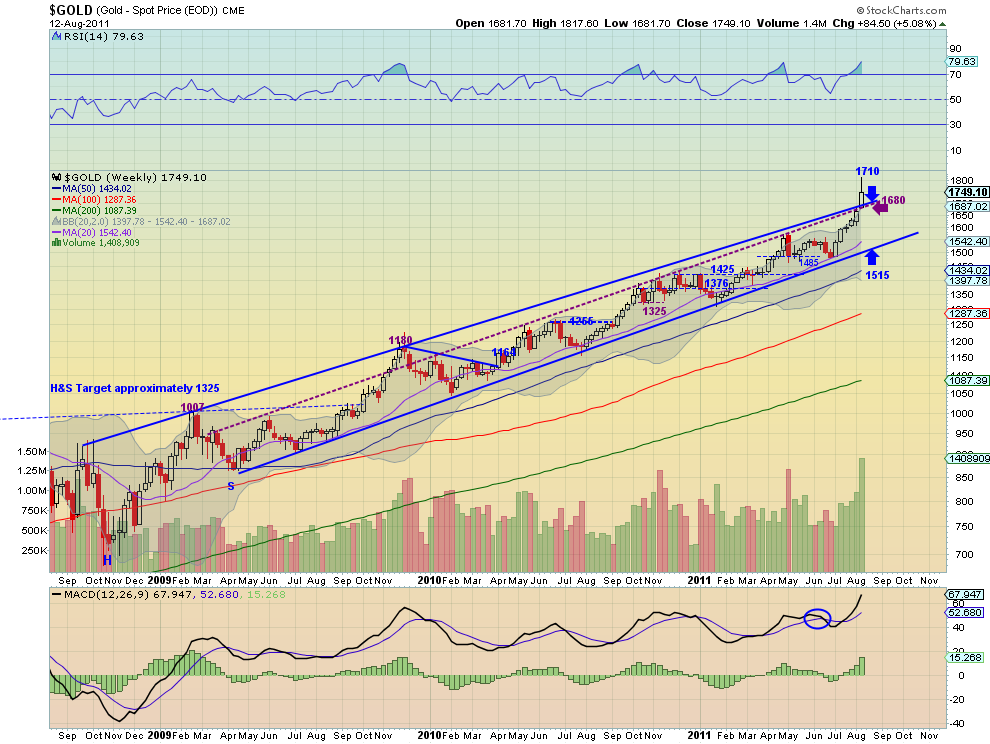
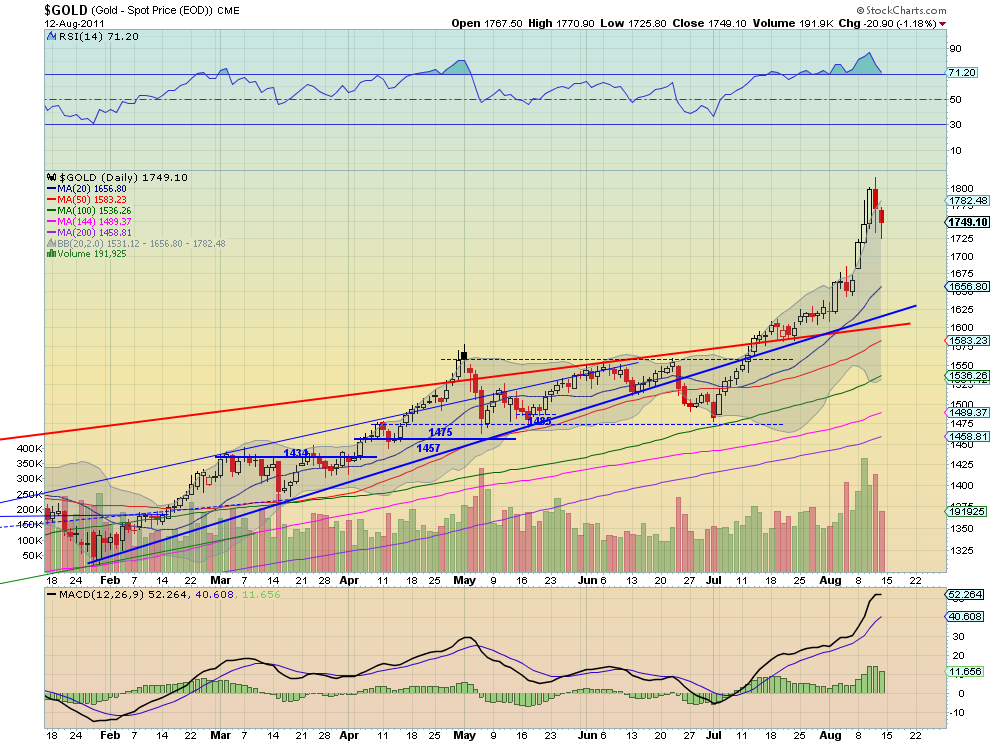
Gold gapped higher Monday and ran through the end of Wednesday, closing outside of the Bollinger bands each day. Then it pulled back to support at 1748. The Relative Strength Index (RSI) on the daily chart has moved from overbought to near the 70 line and the Moving Average Convergence Divergence (MACD) has come off of its peak as the price is retreating towards the 20 day Simple Moving Average (SMA). The weekly chart shows the first breach of the rising channel from 2008 to the upside. The RSI is at levels where it has retreated from the last 3 times it has reached and the MACD is high. The shooting star print closing out of the Bollinger bands adds to the possibility of more downside. Look for more of a pullback in the uptrend in the coming week with support at a back test of the weekly channel at 1710 followed by 1700 and 1680. A hold at 1748 could lead to another move to 1800 and higher.
West Texas Intermediate Crude Weekly, $CL_F

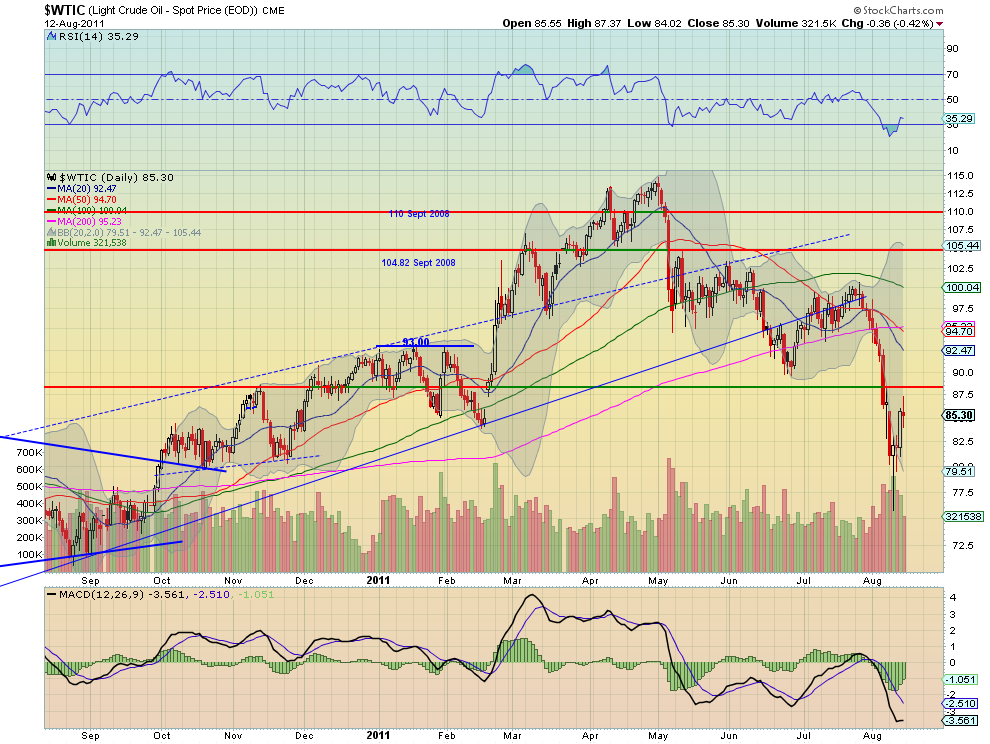
Crude Oil broke the doji from last Friday lower and drove to a test of support at 81. By the end of the week it was retesting that doji area with another doji. The daily chart shows the RSI bottomed in the 20′s and is moving higher again, and the MACD has been improving since Wednesday. The weekly chart shows a fall out of the rising channel but a promising Hammer candle after a retracement to the 38.2% Fibonacci level of the move off from the 2008 high to the 2009 low at 76.99. The RSI is still falling and the MACD has is growing more negative again on the weekly chart. The combination suggest a short term move higher but there is resistance at the channel at 87 and then the support/resistance at 88.50, but more downside in the intermediate term with support at 81 and 77.
US Dollar Index Weekly, $DX_F
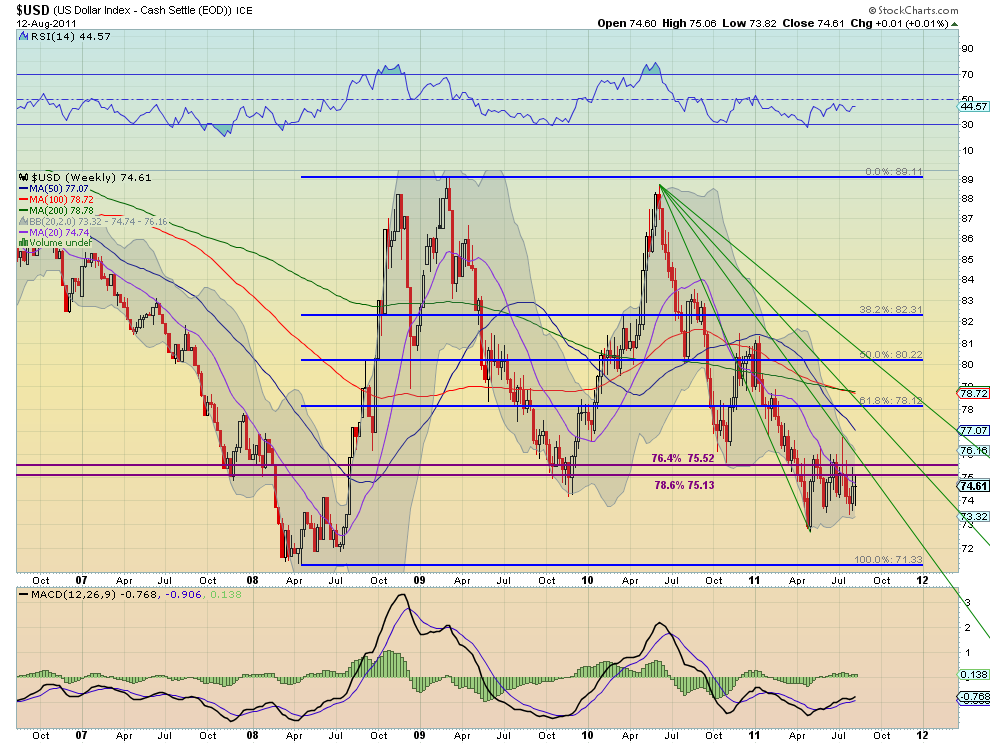
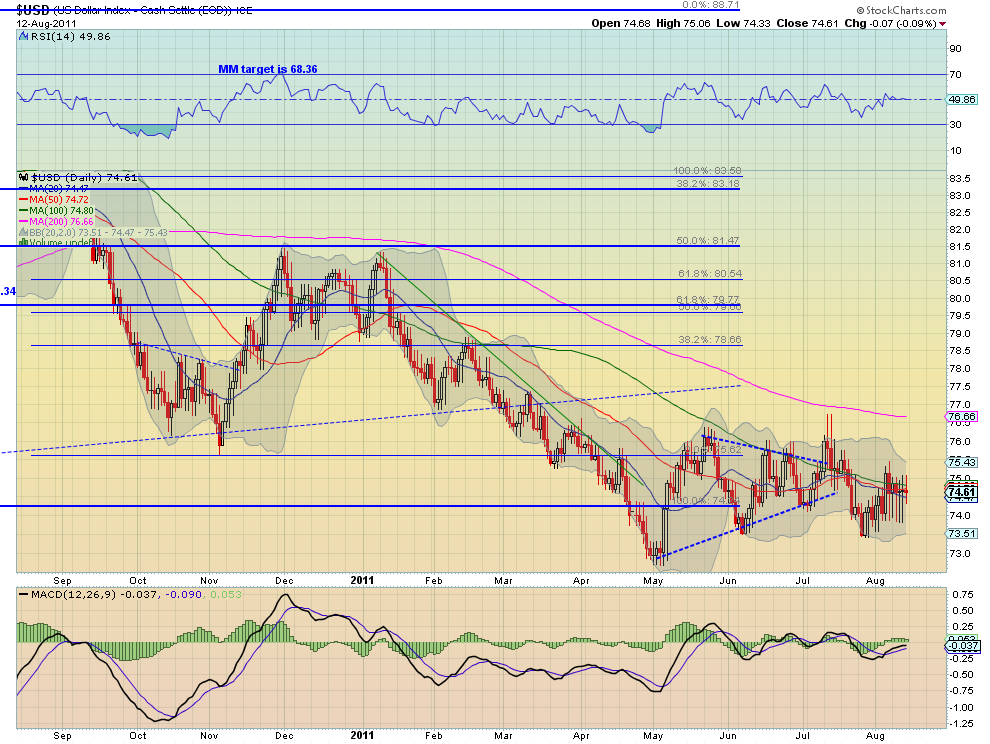
The US Dollar Index continues to move sideways in the upper end of the consolidation range from 73.50 to 76. Despite the daily range being bigger the real body’s of the candles have been shrinking, suggesting indecision coming to a head. The RSI and MACD on both the daily and weekly time-frame continue to provide little information about the next move. The weekly time-frame shows that the upside resistance at 75.13-75.52 coincides with the Fibonacci levels retracing from the move higher from 2008 to 2009. On this time-frame the trend continues to be down. Look for more sideways action in the 73.50-76.00 range in the coming week as it approaches the Fan line in September.
iShares Barclays 20+ Yr Treasury Bond Fund Weekly, $TLT
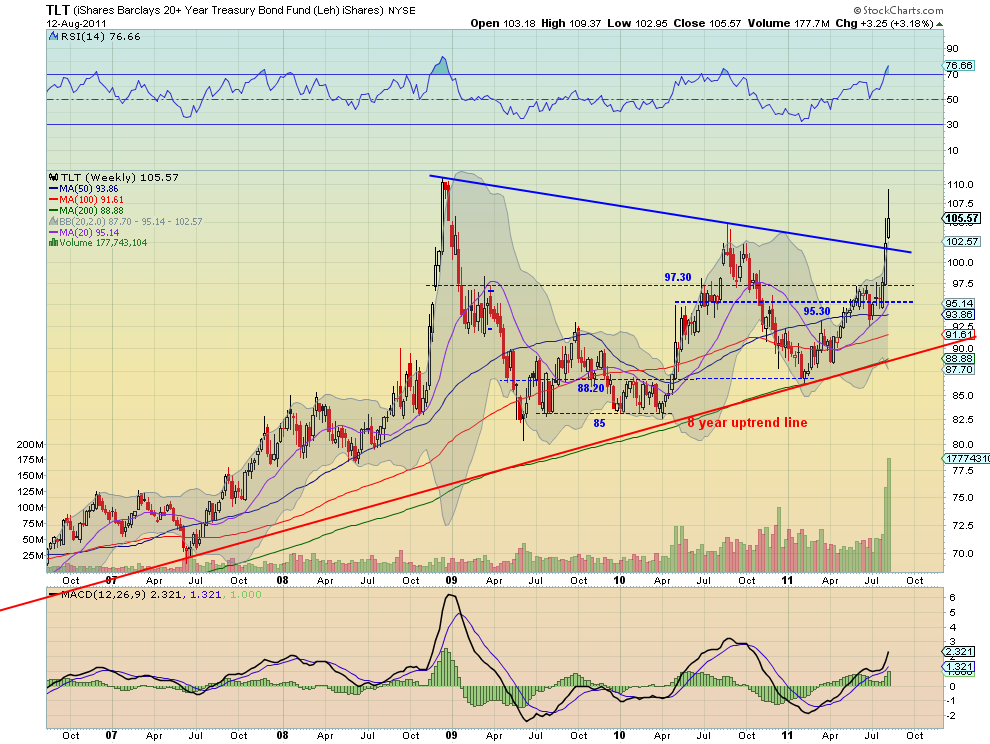
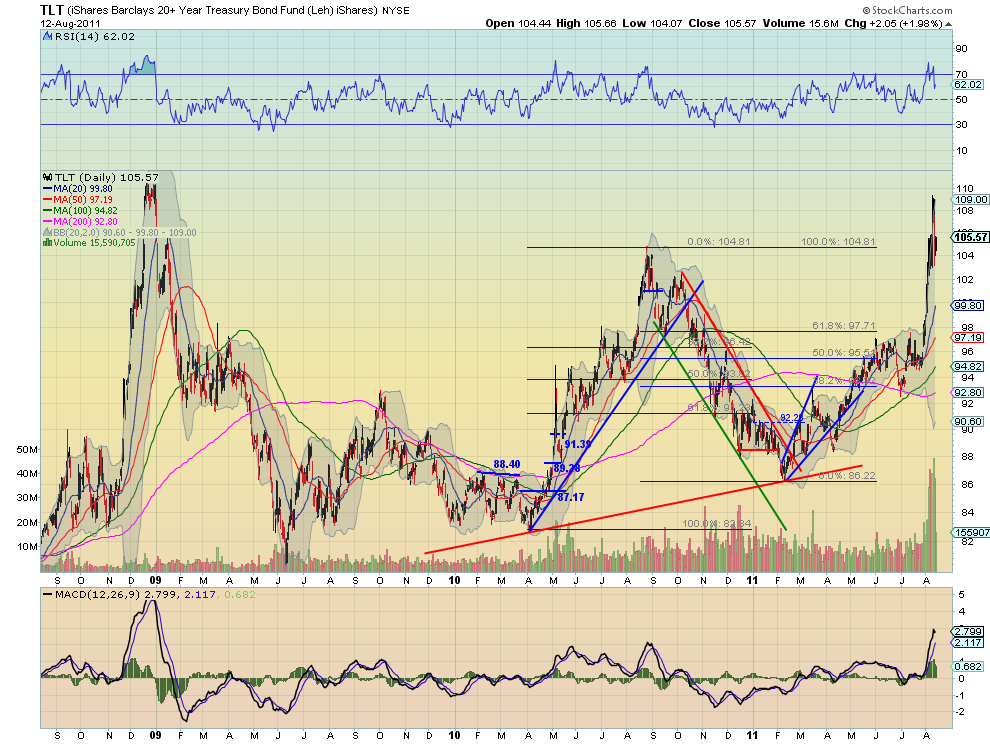
Treasuries, as measured by the ETF $TLT, had a massive week up over 3% even after selling off by over 3.5% from the top. Friday found support at the 104.80-105.20 area, the August 2010 high, but the RSI and MACD on the daily chart are diverging and suggest more downside. The weekly chart shows a shooting star print out of the Bollinger bands that launched on a break of the symmetrical triangle. The RSI is pointing higher and the MACD is growing on the weekly time-frame, and volume on the move higher has been very large. This combination suggests that we may see a retest of the triangle upper rail or lower before a move higher on the intermediate time-frame. Look for support at the 104.80-105.20 area or at 102 and 100 lower to hold to continue the upside. A move above 110.65 confirms a target on the triangle pattern at 136.

Shanghai Stock Exchange Composite Weekly, $SSEC
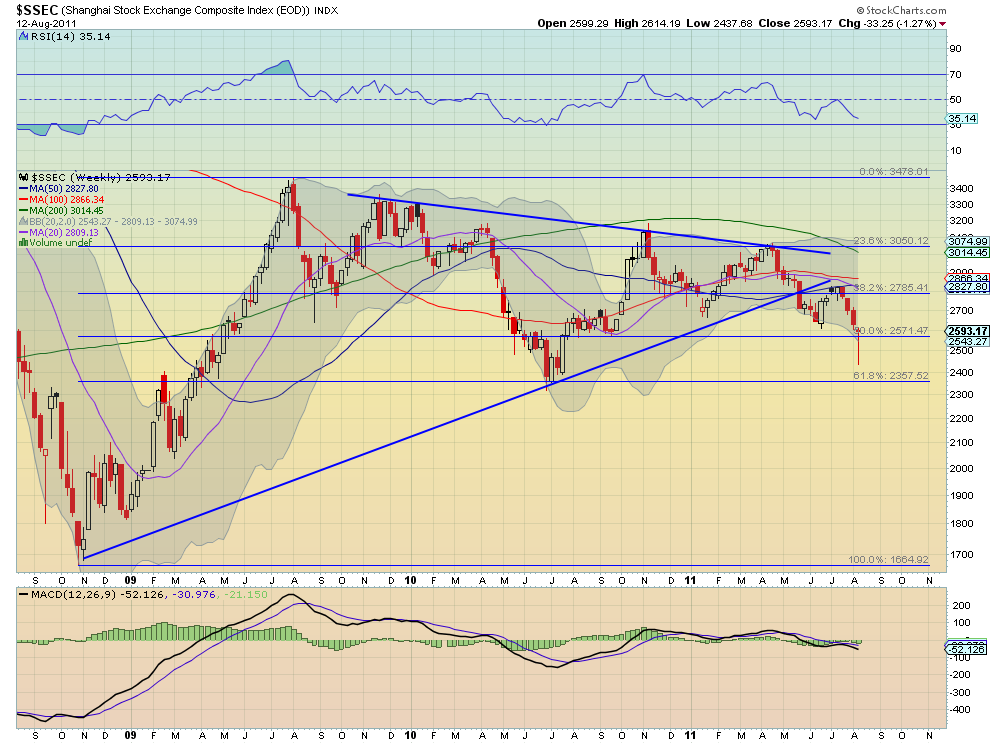
The Shanghai Composite found support at the 2500 area after testing lower. The daily chart shows the RSI bottomed and sloping higher with the MACD moving steadily towards the zero line, while price now tests the bottom of the late 2010 channel between 2590 and 2695. The weekly chart printed a near Dragonfly doji with a long shadow, but with the RSI still falling and the MACD flat-lined. In the end this is at least a lower low after a lower high, still a down trend. Look for next week to continue the short term move higher with resistance above at 2695 and then 2800, with a move above 2840 negating the down trend. A move lower sees some support at 2500 and 2450.
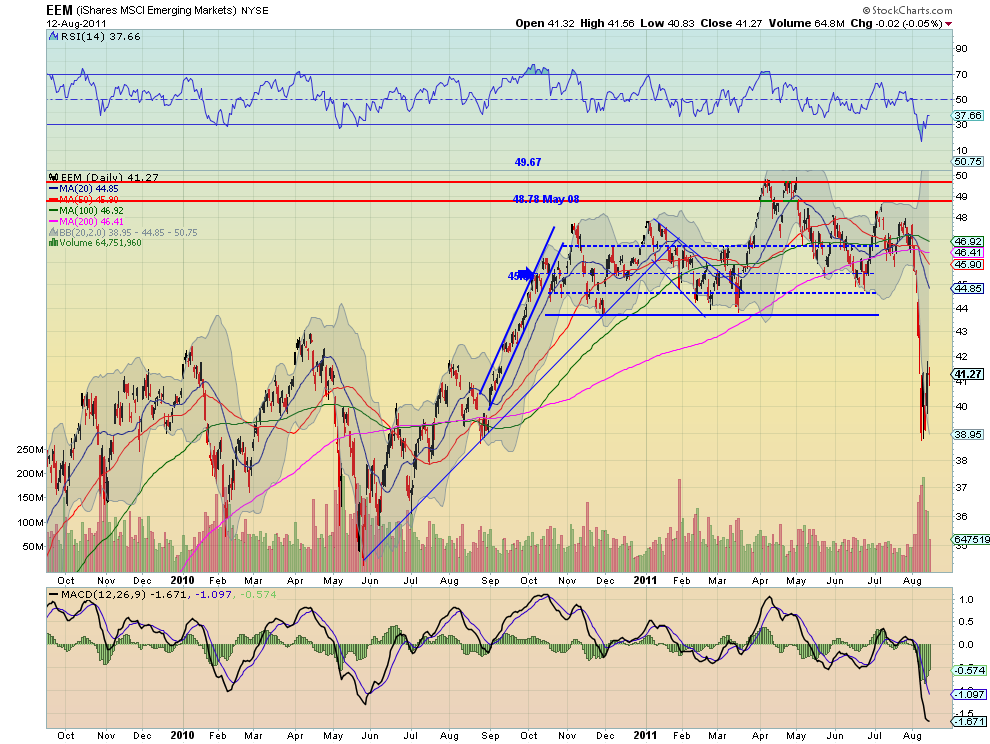
iShares MSCI Emerging Markets Index Weekly, $EEM
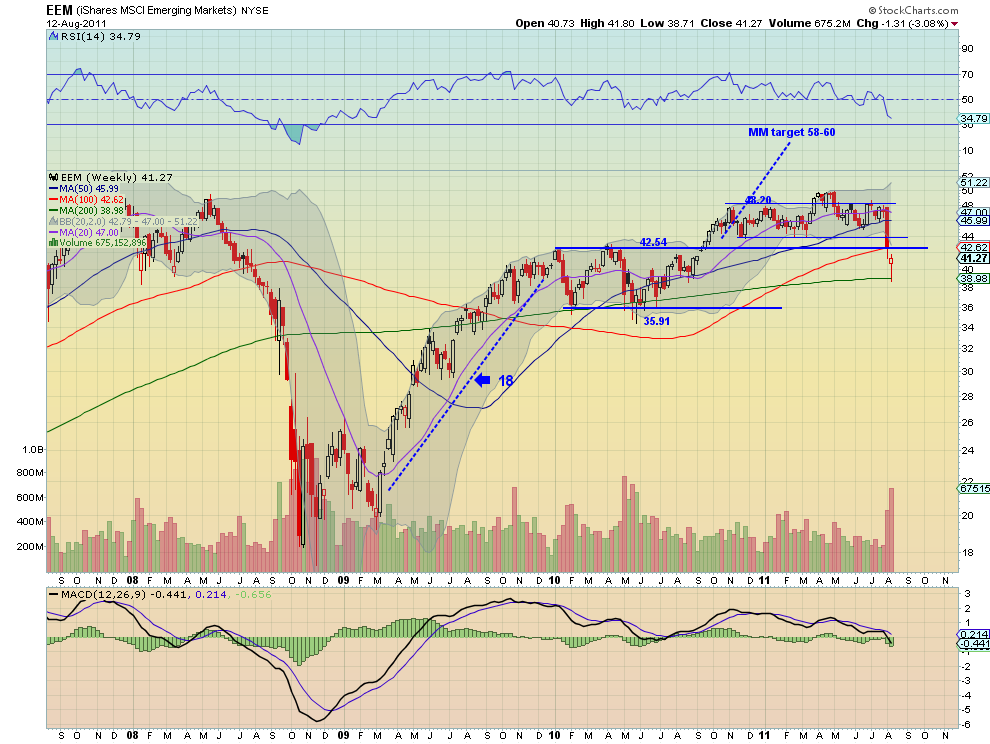
Emerging Markets, as measured by the ETF $EEM, crashed Monday and then consolidated for the week in a range between support at 39 and resistance at 41.50. The RSI on the daily chart bottomed and is now headed sharply higher while the MACD has been improving toward the zero line. The chart printed a hollow red Hammer, bullish intra-week activity within the move down. It is extremely out of the Bollinger bands and under the longer term resistance at 42.54. Like the Shanghai Composite though the RSI and MACD on the weekly time-frame suggest more downside. Look for Emerging markets to continue the short term up move in the coming week with resistance above 42.54 at 43.70. A move lower finds support at 38 and then 35.91.
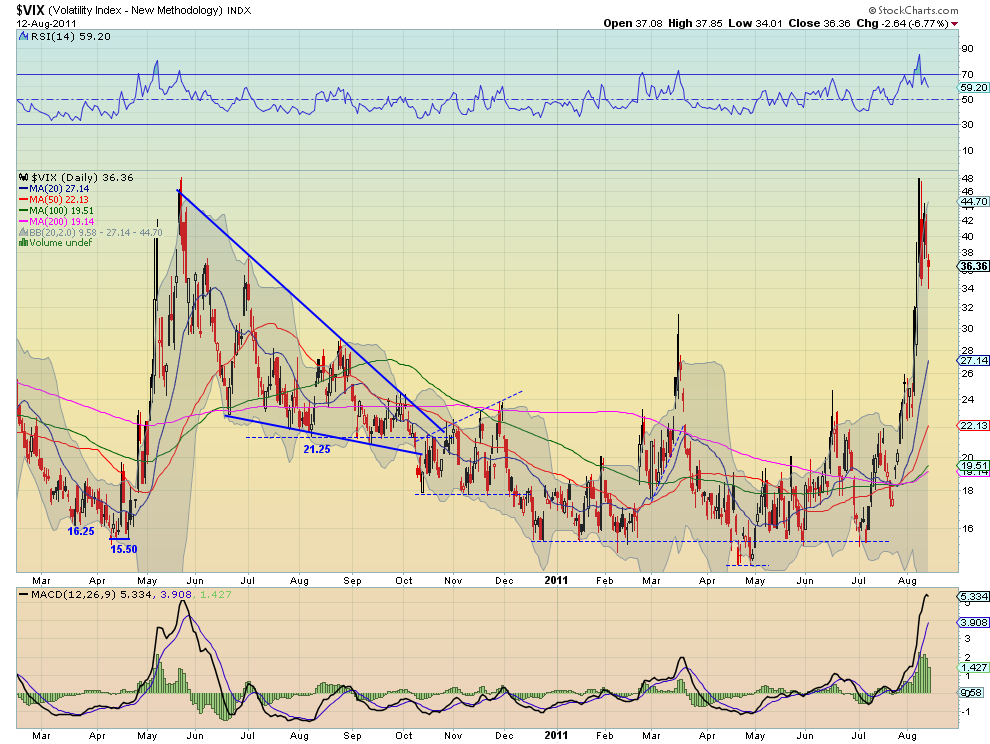
VIX Weekly, $VIX
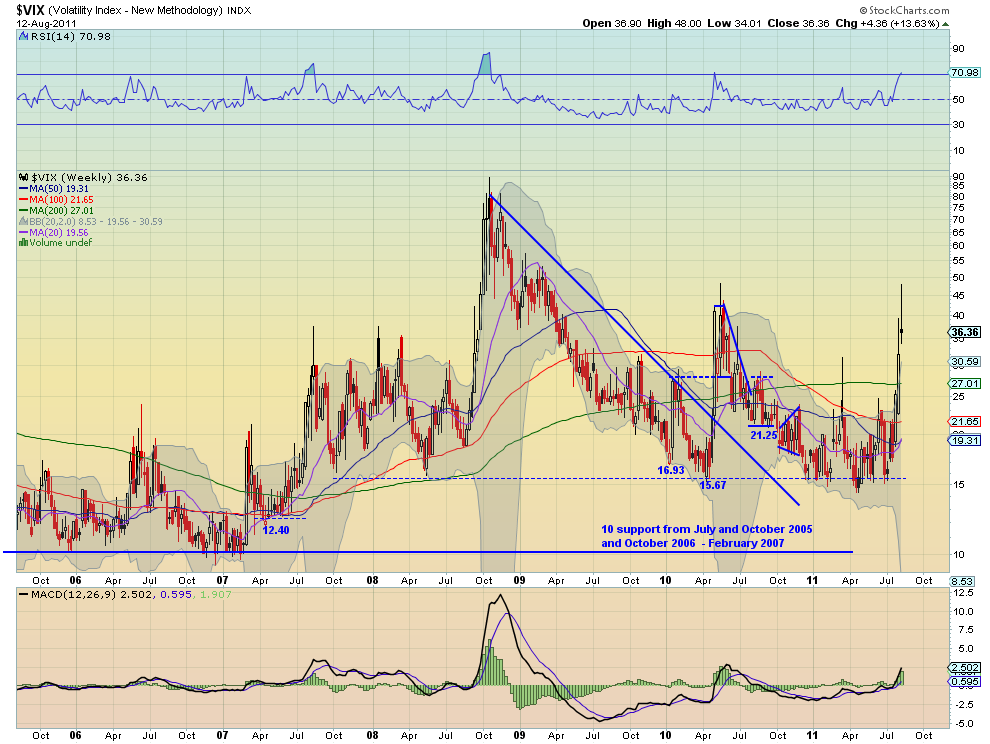
The Volatility Index spiked to the 48 level where it stopped in May 2010 before pulling back as the week progressed. It did find support though at the 34 level that has been important in the past. With the RSI moving lower and the MACD declining this time-frame suggest that volatility will fall in the short term. The weekly chart printed a shooting star with the RSI rising but reaching the overbought level where it has sold off 4 of the last 5 times. The MACD is still rising on this time-frame. With the weekly chart also out of the Bollinger bands look for Volatility for the week to continue lower. If it does not break 34 then all bets are off and the markets are in big trouble.
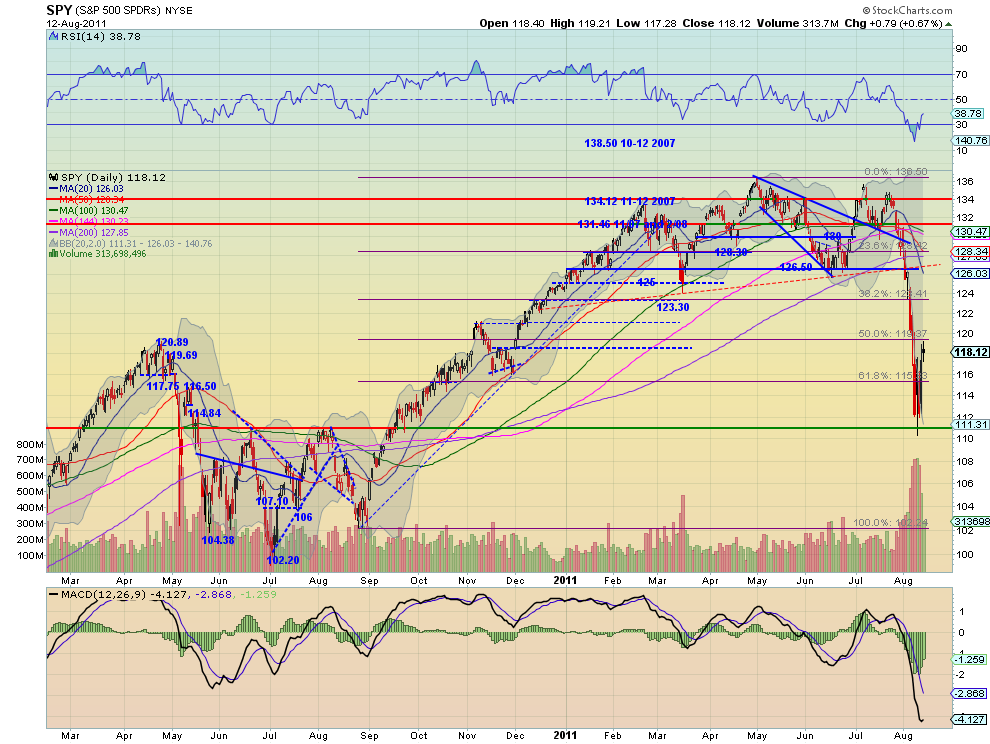
SPY Weekly, $SPY
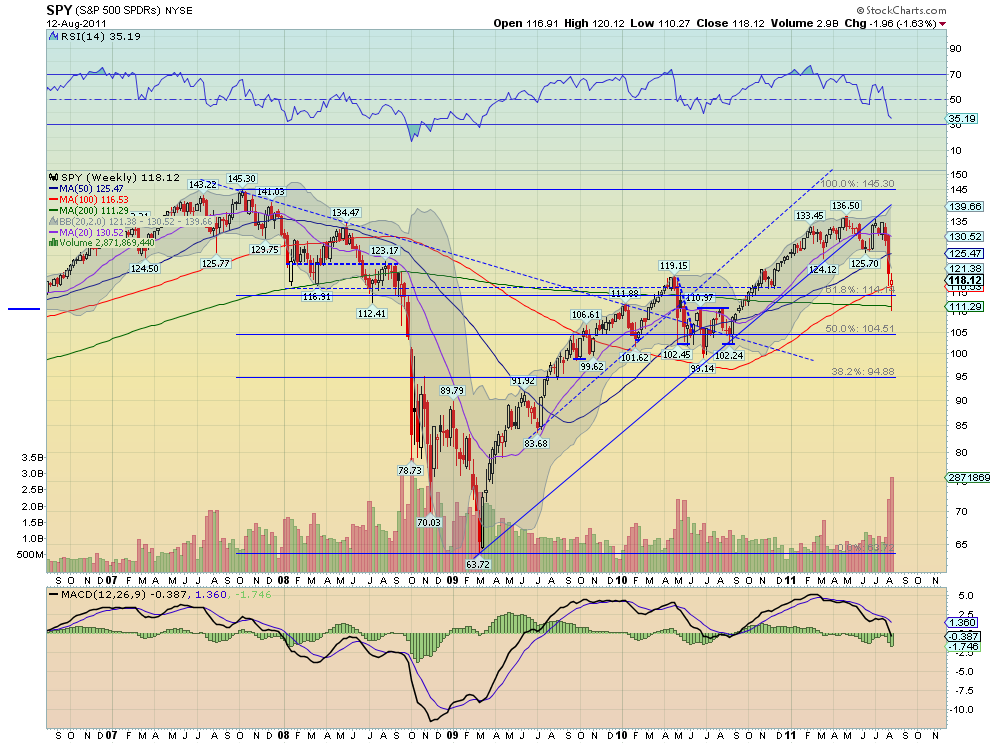
The SPY broke lower Monday and then bounced in a range for the week finishing Friday with a doji candle just above that range but under last Friday’s close. The RSI on the daily chart bottomed and is rising sharply while the MACD also has been improving off of the low from Wednesday. The weekly chart shows a hollow red Hammer candle at support with the RSI and MACD still pointing lower. It is well outside of the Bollinger band on this time-frame and printed volume not seen since the March 2009 lows. Look for next week to be biased higher with resistance at 119.20 and 121.50 above that, but the trend remains lower. It would take a move above 126.50 to negate the trend. A move lower would find some support at 116 and 113 followed by 111.15.
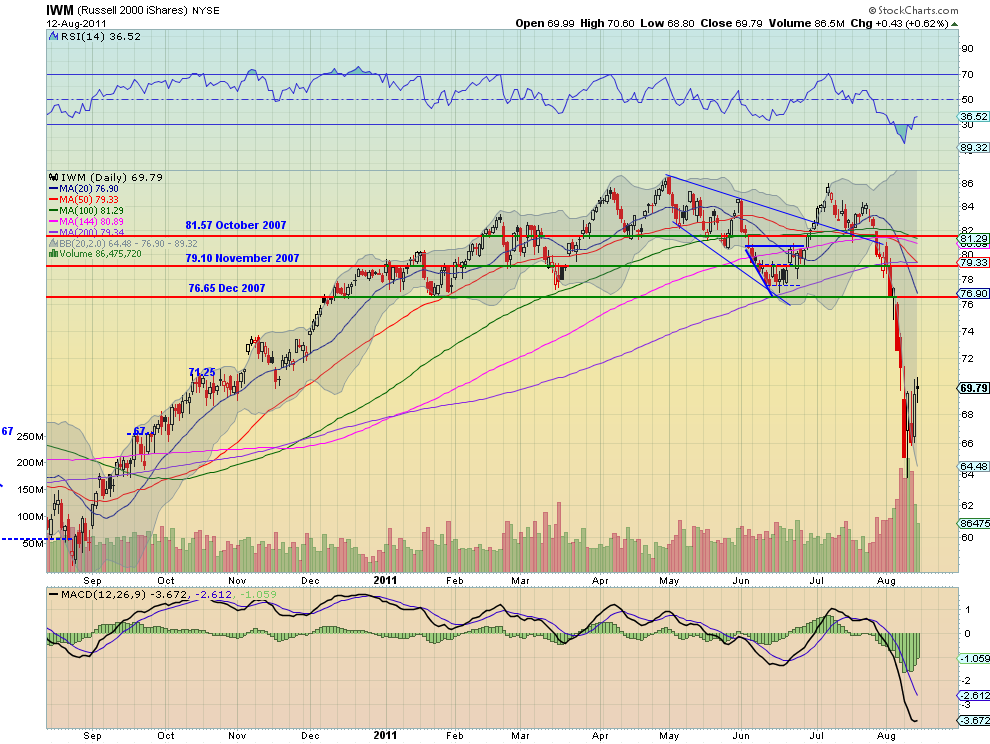
IWM Weekly, $IWM
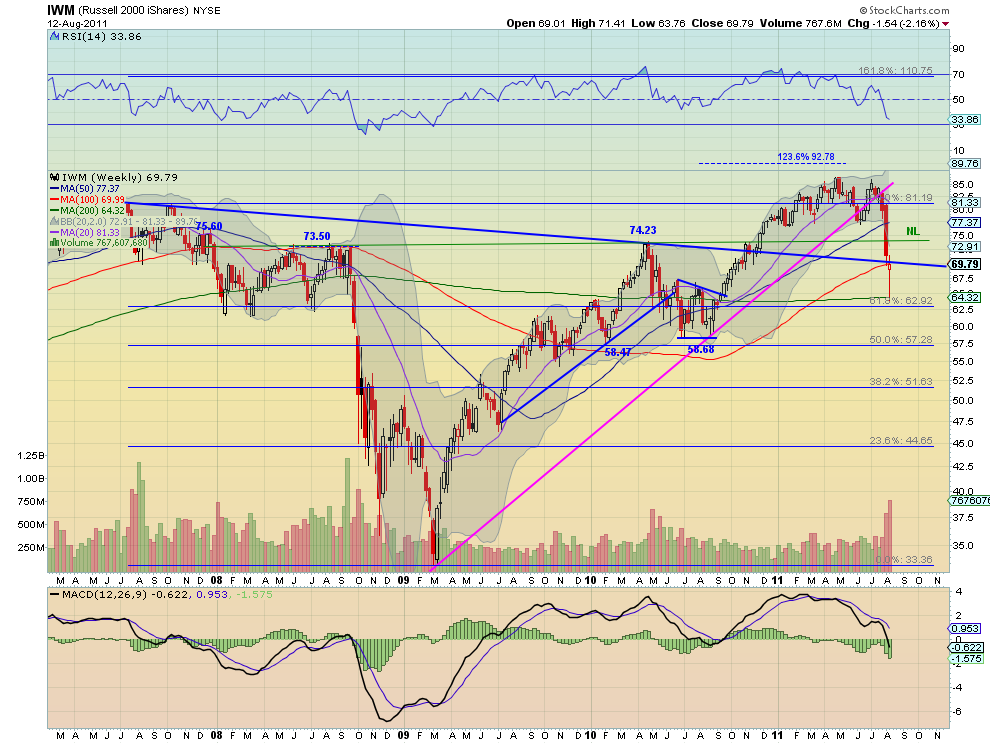
The IWM also broke lower Monday and then bounced in a range for the week finishing Friday with a doji candle just above that range but under last Friday’s close. The RSI on the daily chart bottomed and is rising sharply while the MACD also has been improving off of the low from Wednesday. The weekly chart shows a hollow red Hammer candle just below the resistance of the extended downtrend line from the 2007 highs, with the RSI and MACD still pointing lower. It is well outside of the Bollinger band on this time-frame and printed volume not seen since the 2008 move lower. Look for next week to be biased higher with resistance at 70.40 and 74 above that, but the trend remains lower. It would take a move above 76.75 to negate the trend. A move lower would find some support at 68 and 67 followed by 65.50.

QQQ Weekly, $QQQ
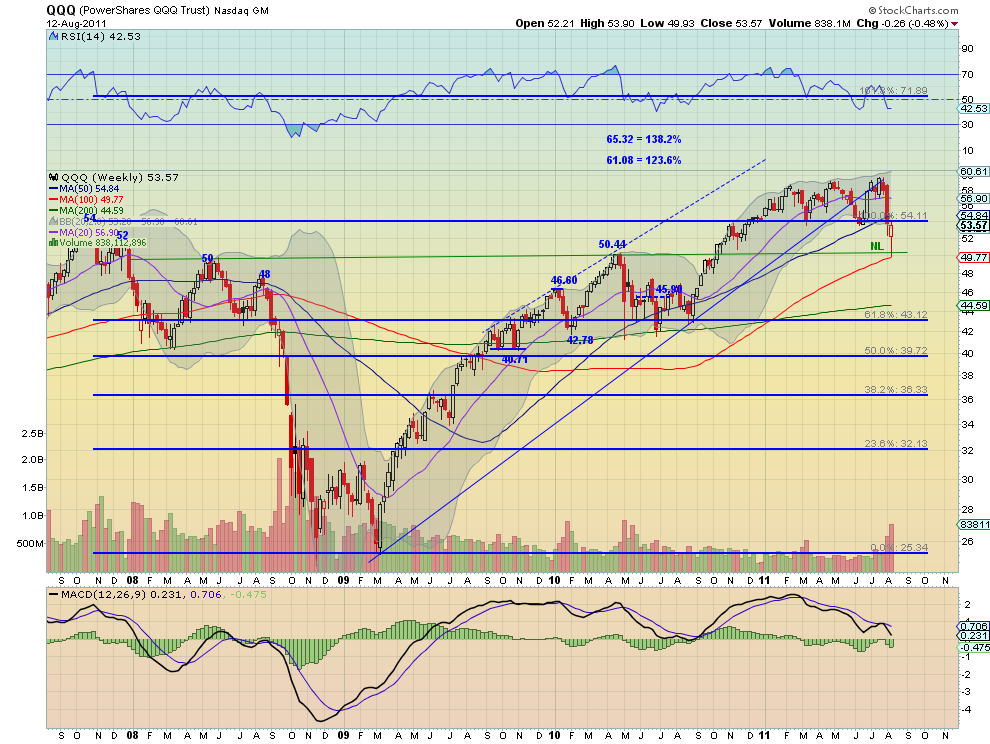
Finally the QQQ also broke lower Monday and then bounced in its range for the week finishing Friday with a doji candle just above that range but under last Friday’s close. The RSI on the daily chart bottomed and is rising sharply while the MACD also has been improving off of the low from Wednesday. This is the only index that has moved back into the previous six month consolidation channel. The weekly chart shows a hollow red Hammer candle just below the resistance of the 2007 highs, with the RSI just turning flat and the MACD still pointing lower. It is close but outside of the Bollinger band on this time-frame. Look for next week to be biased higher with resistance at 54.26 and 55.50 above that, and a move into the channel. A move lower would find some support at 52 and 50.60 followed by 47.40.
Next week looks like a reversal of this week. Gold looks heading lower while Crude Oil has a short term bias higher in a downtrend. The US Dollar Index looks to continue sideways in the 73.50-76 range, while US Treasuries look to continue lower in an uptrend. The Shanghai Composite and Emerging Markets look to be headed higher. Volatility looks biased to the downside with a move under 34 key to continuing lower, and giving a bias to the upside for the Equity Indexes SPY, IWM and QQQ, also within a downtrend. the big question looks to be whether this is a dead cat bounce or for real. Use this information as you prepare for the coming week and trade’m well.
No comments:
Post a Comment