Tuesday, April 1, 2014

Reaching Debt Limits: With or without China’s problems, we have a problem

by Gail Tverberg

Credit Problems are a Very Current Issue

In the past several years, the engine of world’s growth has been China. China’s growth has been fueled by debt. China now seems to be running into difficulties with its industrial growth, and its difficulty with industrial growth indirectly leads to debt problems. A Platt’s video talks about China’s demand for oil increasing by only 2.5% in 2013, but this increase being driven by rising gasoline demand. Diesel use, which tracks with industrial use, seems to be approximately flat.

The UK Telegraph reports, “Markets hold breath as China’s shadow banking grinds to a halt.” According to that article,

A slew of shockingly weak data from China and Japan has led to a sharp sell-off in Asian stock markets and the biggest one-day crash in iron ore prices since the Lehman crisis, calling into question the strength of the global recovery.

The Shanghai Composite index of stocks fell below the key level of 2,000 after investors reacted with shock to an 18pc slump in Chinese exports in February and to signs that credit is wilting again. Iron ore fell 8.3pc.

Fresh loans in China’s shadow banking system evaporated to almost nothing from $160bn in January, suggesting the clampdown on the $8 trillion sector is biting hard.

Many recent reports have talked about the huge growth in China’s debt in recent years, much of it outside usual banking channels. One such report is this video called How China Fooled the World with Robert Peston.

Why Promises (and Debt) are Critical to the Economy

Without promises, it is hard to get anyone to do anything that they really don’t want to do. Think about training your dog. The way you usually do this training is with “doggie treats” to reward good behavior. Rewards for desired behavior are equally critical to the economy. An employer pays wages to an employee (a promise of pay for work performed).

It is possible to build a house or a store, stick by stick, as a person accumulates enough funds from other endeavors, but the process is very slow. Usually, if this approach is used, those building homes or stores will provide all of the labor themselves, to try to match outgo with income. If debt were used, it might be possible to use skilled craftsmen. It might even be possible to take advantage of economies of scale and build several homes together in the same neighborhood, and sell them to individuals who could buy the homes using debt.

Adding debt has many advantages to an economy. With debt, a person can buy a new car or house without needing to save up funds. These purchases lead to additional workers being employed in building these new cars and homes, adding jobs. The value of existing homes tends to rise, if other people are available to afford them, thanks to cheap debt availability. Rising home prices allow citizens to take out home equity loans and buy something else, adding further possibility of more jobs. Availability of cheap debt also tends to make business activity that would otherwise be barely profitable, more profitable, encouraging more investment. GDP measures business activity, not whether the activity is paid for with debt, so rising debt levels tend to lead to more GDP.

Webs of Promises and Debt

As economies expand, they add more and more promises, and more and more formal debt. In high tech industries, supply lines using materials from around the world are needed. The promise made, formally or informally, is that if more of a supply is needed, it will be available, at the same or a similar price, in the quantity needed and in the timeframe needed. In order for this to happen, each supplier needs to have made many promises to many employees and many suppliers, so as to meet its commitments.

Governments are part of this web of promises and debt. Some of the promises made by governments constitute formal debt; some of the promises are guarantees relating to debt of other parties (such as nuclear power plants), or of the finances of banks or pensions plans. Some of a government’s promises are only implied promises, yet people depend on these implied promises. For example, there is an expectation that the government will continue to provide paved roads, and that it will continue to provide programs such as Social Security and Medicare. Because of the latter programs, citizens assume that they don’t need to save very much or have many children–the government will provide funding sufficient for their basic needs in later years, without additional action on their part.

What is the Limit to Debt?

While our system of debt has gone on for a very long time, we can’t expect it to continue in its current form forever. One thing that we don’t often think about is that our system or promises isn’t really backed by the way natural system we live in works. Our system of promises has a hidden agenda of growth. Nature doesn’t  have a similar agenda of growth. In the natural order, the amount of fresh water stays pretty much the same. In fact, aquifers may deplete if we over-use them. The amount of topsoil stays pretty much the same, unless we damage it or make it subject to erosion. The amount of wood available stays pretty constant, unless we over-use it.

Nature, instead of having an agenda of growth, operates with an agenda of diminishing returns with respect to many types of resources. As we attempt to produce more of a resource, the cost tends to rise. For example, we can extract more fresh water, if we will go to the expense of drilling deeper wells or using desalination, either of which is more expensive. We can extract more metals, if we use as our source lower grade ores, perhaps with more surface material covering the ore. We can get extract more oil, if we will go to the expense of digging deeper wells is less hospitable parts of the world. We can even use substitution, but that will likely be more expensive yet.

A major issue that most economists have missed is the fact that wages don’t rise in response to this higher cost of resource extraction. (I have shown a chart illustrating that this is true for oil prices.) If the higher cost simply arises from the fact that nature is putting more obstacles in our way, we end up spending more for, say, desalinated water than water from a local well, or more for gasoline than previously. Much of the cost goes into fuel that is burned, or building special purpose equipment (such as a desalination plant or offshore drilling rigs) that will degrade over time. Our system is, in effect, becoming less and less efficient, as it takes more resources and more of people’s time, to produce the same end product, measured in terms of barrels of oil or gallons of water. Even if there are additional salaries, they are often in a different country, around the globe.

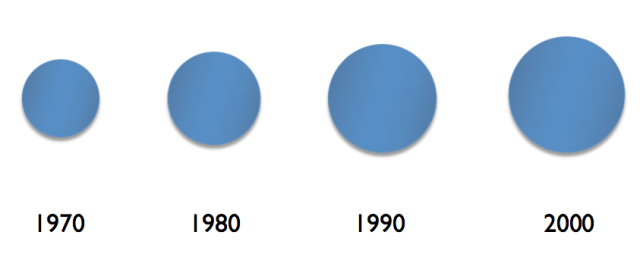
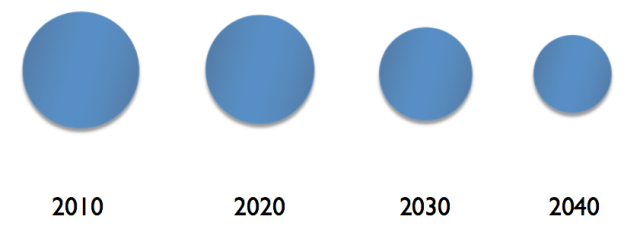
At some point, the amount of products we can actually produce starts shrinking, because workers cannot afford the ever-more-expensive products or because some essential “ingredient” (such as fresh water, or oil, or an imported metal) is not available. Since we live in a finite world, we know that at some point such a situation must occur, even if  the shrinkage isn’t as soon as I show it in Figure 2 below.

Figure 1. Author's image of an expanding economy.

Figure 1. Author’s image of an expanding economy.

Figure 2. Author's image of declining economy.

Figure 2. Author’s image of declining economy.

The “catch” with debt is that we are in effect borrowing from the future. It is much easier to pay back debt with interest when the economy is growing than when the economy is shrinking.  When the economy is shrinking, there is less in the future to begin with. Repaying debt from this shrinking amount becomes a problem. Even promises that aren’t formally debt, such as most Social Security payments, Medicare, and future road maintenance become a problem. With fewer goods available in total, citizens on average become poorer.

Governments depend on tax revenue from citizens, so they become poorer as well–perhaps even more quickly than the individual citizens who live in their country. It is in situations like this that richer parts of countries decide to secede, leading to country break-ups. Or the central government may fail, as in the Former Soviet Union.

Which Promises are Least Affected?

Some promises are very close in time; others involve many years of delay. For example, if I bring food I grew to a farmers’ market, and the operator of the market gives me credit that allows me to take home some other goods that someone else has brought, there are some aspects of credit involved, but it is very short term credit. I am being allowed to “run a tab” with credit for things I brought, and this payment is being used to purchase other goods, or perhaps even services. Perhaps someone else would offer some of their labor in putting together the farmers’ market, or in working in a garden, in return for getting some of the produce.

As I see it, such short term promises are not really a problem. Such credit arrangements have been used for thousands of years (Graeber, 2012). They don’t depend on long supply lines, around the world, that are subject to disruption. They also don’t depend on future events–for example, they don’t depend on buyers being available to purchase goods from a factory five or ten years from now. Thus, local supply chains among people in close proximity seem likely to be available for the long term.

Long-Term Debt is Harder to Maintain

Debt which is long-term in nature, or provides promises extending into the future (even if they aren’t formally debt) are much harder to maintain. For example, if governments are poorer, they may need to cut back on programs citizens expect, such as paving roads, and funding for Social Security and Medicare.

Governments and economies are already being affected by the difficulty in maintaining long term debt. This is a big reasons why Quantitative Easing (QE) is being used to keep interest rates artificially low in the United States, Europe (including the UK and Switzerland), and Japan. If interest rates should rise, it seems likely that there would be far more defaults on bonds, and far more programs would need to be cut. Even with these measures, some borrowers near the bottom are already being adversely affected–for example, subprime loans were problems during the Great Recession. Also, many of the poorer countries, for example, Greece, Egypt, and the Ukraine, are already having debt problems.

Indirect Casualties of the Long-Term Debt Implosion

The problem with debt defaults is that they tend to spread. If one major country has difficulty, banks of  many other countries are likely be to affected, because many banks will hold the debt of the defaulting country. (This may not be as true with China, but there are no doubt indirect links to other economies.) Banks are thinly capitalized. If a government tries to prop up the banks in its country, it is likely to be drawn into the debt default mess. Insurance companies and pension plans may also be affected by the debt defaults.

In such a situation of debt defaults spreading from country to country, interest rates can be expected to shift suddenly, causing financial difficulty for those issuing derivatives. There may also be liquidity problems in dealing with these sudden changes. As a result, banks issuing derivatives may need to be bailed out.

There may also be a sudden loss of credit availability, or much higher interest rates, as banks issuing loans become more cautious. In fact, if problems are severe enough, some banks may be closed altogether.

With less credit available, prices of commodities can be expected to drop dramatically. For example, during the credit crisis in the second half of 2008, oil prices dropped to the low $30s per barrel. It was not until after  QE was started in November 2008 that oil prices started to rise again. This time, central banks are already using QE to try to fix the situation. It is not clear that they can do much more, so the situation would seem to have the potential to spiral out of control.

Without credit availability, the prices of most stocks are likely to drop dramatically. In part, this is because without credit availability, it is not clear that the companies listed in the stock market can actually produce very much. Even if the particular company does not need credit, it is likely that some of the businesses on which it depends for supplies will have credit problems, and not be able to provide needed supplies. Also, with less credit availability, potential buyers of shares of stock may not be about to get the credit they need to purchase shares of stock. As a result of the credit problems in 2008, the Dow Jones Industrial Average dropped to $6,547 on March 9, 2009.

Furthermore, lack of credit availability tends to lead to low selling prices for commodities, making production of these commodities unprofitable. Production of these commodities may not drop off immediately, but will in time unless the credit situation is quickly turned around.

Can’t governments simply declare a debt jubilee for all debt, and start over again?

Not that I can see. Declaring a debt jubilee is, in effect, saying, “We have decided to renege on our past promises. In fact, we are letting others renege on their promises as well.” This means that insurance companies, pension plans, and banks will all be in very poor financial situation. Many who depend on pensions will find their monthly checks cut off as well. In fact, businesses without credit availability are likely to lay off workers.

If it is possible to start over, it will need to be on a much more restricted basis. Everyone will be poorer, so there won’t be much of a market for expensive new cars and homes. Instead, most demand will be for will be the basics–food, water, clothing, and fuel for heat. Unfortunately, it is doubtful that prices will be high enough, or the chains of supply robust enough, to again produce fossil fuels in quantity. Without fossil fuels, what we think of as renewables will disappear from availability quickly as well. For example, hydroelectric, wind and solar PV all work as parts of a system. If the billing system is unavailable because banks are closed, or if the transmission system is in need of repair because lines are down and the diesel fuel needed to make repairs is unavailable, electricity may not be available.

As indicated above, demand will be primarily for basics such as food, water, clothing, and fuel for cooking and heating. It will still be possible to use local supply chains, even if long distance supply chains don’t really work well. The challenge will be trying to shift modes of production to new approaches in which goods can be made locally. A major challenge will be training potential farmers, getting needed equipment for them, and transferring land ownership in ways that will allow food to be produced in ways that do not depend on fossil fuels.

Belief in credit will be severely damaged by a debt jubilee. The place where credit will be easy to reestablish will be in places where everyone knows everyone else, and supply lines are short. Debt will mostly be of the nature of “running a tab” when one type of good is exchanged for another. Over time, there may be some long-term trade re-established, but it is likely to be much more limited in scope than what we know today.

Conclusion

Long-term debt tends to work much better in a period of economic growth, than in a period of contraction. Reinhart and Rogoff unexpectedly discovered this point in their 2008 paper “This Time is Different: A Panoramic View of Eight Centuries of Financial Crises.” They remark “It is notable that the non-defaulters, by and large, are all hugely successful growth stories.”

Slowing growth in China is likely to mean that world economic growth is slowing. This will add to stresses, making failure of the system more likely than it otherwise would be. We can cross our fingers and hope that Janet Yellen and other central bankers can figure out yet other ways to keep the system together for a while longer.

See the original article >>

The Absurdity of US Natural Gas Exports

by Gail Tverberg

Quiz:

1. How much natural gas is the United States currently extracting?

(a) Barely enough to meet its own needs
(b) Enough to allow lots of exports
(c) Enough to allow a bit of exports
(d) The United States is a natural gas importer

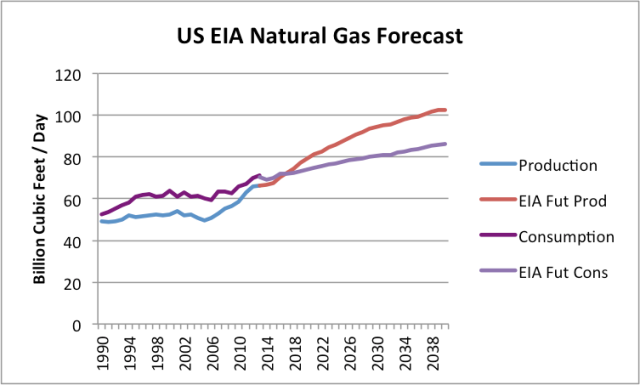
Answer: (d) The United States is a natural gas importer, and has been for many years. The EIA is forecasting that by 2017, we will finally be able to meet our own natural gas needs.

Figure 1. US Natural Gas recent history and forecast, based on EIA's Annual Energy Outlook 2014 Early Release Overview

Figure 1. US Natural Gas recent history and forecast, based on EIA’s Annual Energy Outlook 2014 Early Release Overview

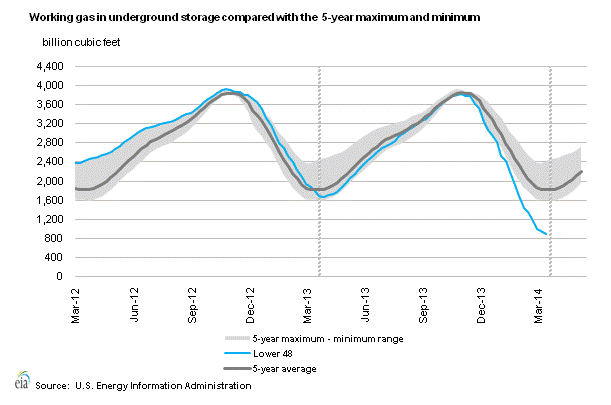
In fact, this last year, with a cold winter, we have had a problem with excessively drawing down amounts in storage.

Figure 2. US EIA's chart showing natural gas in storage, compared to the five year average, from Weekly Natural Gas Storage Report.

Figure 2. US EIA’s chart showing natural gas in storage, compared to the five year average, from Weekly Natural Gas Storage Report.

There is even discussion that at the low level in storage and current rates of production, it may not be possible to fully replace the natural gas in storage before next fall.

2. How much natural gas is the United States talking about exporting?

(a) A tiny amount, less than 5% of what it is currently producing.
(b) About 20% of what it is currently producing.
(c) About 40% of what it is currently producing.
(d) Over 60% of what it is currently producing.

The correct answer is (d) Over 60% what it is currently producing. If we look at the applications for natural gas exports found on the Energy.Gov website, we find that applications for exports total 42 billion cubic feet a day, most of which has already been approved.* This compares to US 2013 natural gas production of 67 billion cubic feet a day. In fact, if companies applying for exports build the facilities in, say, 3 years, and little additional natural gas production is ramped up, we could be left with less than half of current natural gas production for our own use.

*This is my calculation of the sum, equal to 38.51 billion cubic feet a day for Free Trade Association applications (and combined applications), and 3.25 for Non-Free Trade applications.

3. How much are the United States’ own natural gas needs projected to grow by 2030?

a. No growth
b. 12%
c. 50%
d. 150%

If we believe the US Energy Information Administration, US natural gas needs are expected to grow by only 12% between 2013 and 2030 (answer (a)). By 2040, natural gas consumption is expected to be 23% higher than in 2013. This is a little surprising for several reasons. For one, we are talking about scaling back coal use for making electricity, and we use almost as much coal as natural gas. Natural gas is an alternative to coal for this purpose.

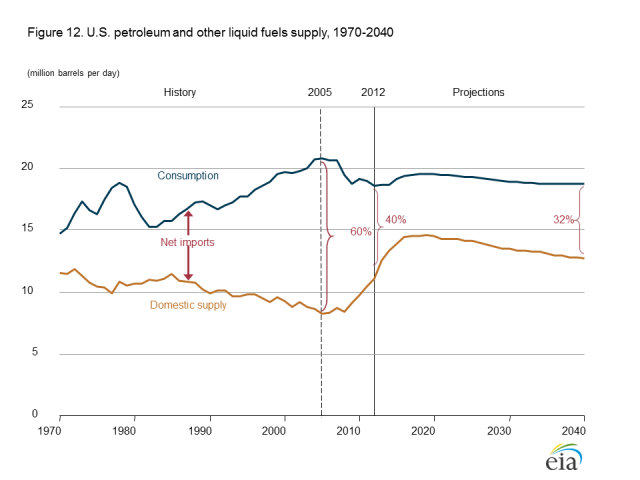
Furthermore, the EIA expects US oil production to start dropping by 2020 (Figure 3, below), so logically we might want to use natural gas as a transportation fuel too.

Figure 3. US Annual Energy Outlook 2014 Early Release Oil Forecast for the United States.

Figure 3. US Annual Energy Outlook 2014 Early Release Oil Forecast for the United States.

We currently use more oil than natural gas, so this change could in theory lead to a 100% or more increase in natural gas use.

Many nuclear plants we now have in service will need to be replaced in the next 20 years. If we substitute natural gas in this area as well, it would further send US natural gas usage up. So the EIA’s forecast of US natural gas needs definitely seem on the “light” side.

4. How does natural gas’s production growth fit in with the growth of other US fuels according to the EIA?

(a) Natural gas is the only fuel showing much growth
(b) Renewables grow by a lot more than natural gas
(c) All fuels are growing

The answer is (a). Natural gas is the only fuel showing much growth in production between now and 2040.

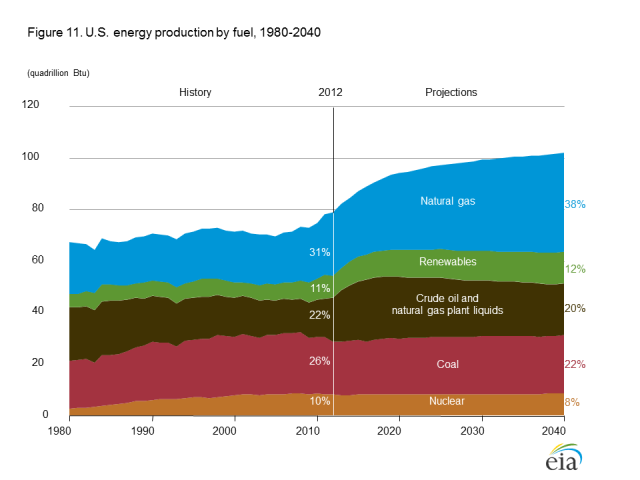
Figure 4 below shows the EIA’s figure from its Annual Energy Outlook 2014 Early Release showing expected production of all types of fuels.

Figure 4. Forecast US Energy Production by source, from US EIA's Annual Energy Outlook 2014 Early Release.

Figure 4. Forecast US Energy Production by source, from US EIA’s Annual Energy Outlook 2014 Early Release.

Natural gas is pretty much the only growth area, growing from 31% of total energy production in 2012 to 38% of total US energy production in 2040. Renewables are expected to grow from 11% to 12% of total US energy production (probably because the majority is hydroelectric, and this doesn’t grow much). All of the others fuels, including oil, are expected to shrink as percentages of total energy production between 2012 and 2040.

5. What is the projected path of natural gas prices:

(a) Growing slowly
(b) Ramping up quickly
(c) It depends on who you ask

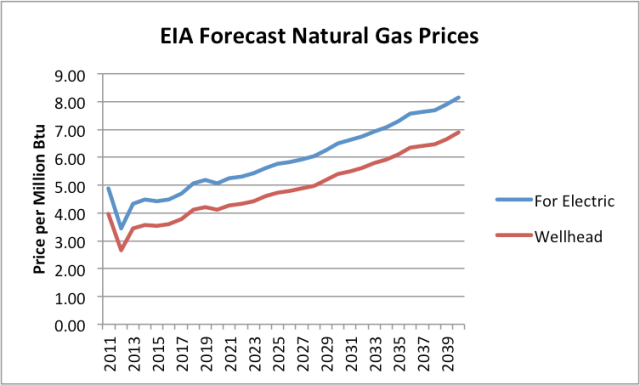
It depends on who you ask: Answer (c). According to the EIA, natural gas prices are expected to remain quite low. The EIA provides a forecast of natural gas prices for electricity producers, from which we can estimate expected wellhead prices (Figure 5).

Figure 5. EIA Forecast of Natural Gas prices for electricity use from AEO 2014 Advance Release, together with my forecast of corresponding wellhead prices. (2011 and 2012 are actual amounts, not forecasts.)

Figure 5. EIA Forecast of Natural Gas prices for electricity use from AEO 2014 Advance Release, together with my forecast of corresponding wellhead prices. (2011 and 2012 are actual amounts, not forecasts.)

In this forecast, wellhead prices remain below $5.00 until 2028. Electricity companies look at these low price forecasts and assume that they should plan on ramping up electricity production from natural gas.

The catch–and the reason for all of the natural gas exports–is that most shale gas producers cannot produce natural gas at recent price levels. They need much higher price levels in order to make money on natural gas. We see one article after another on this subject: From Oil and Gas Journal; from Bloomberg; from the Financial Times. The Wall Street Journal quoted Exxon’s Rex Tillerson as saying, “We are all losing our shirts today. We’re making no money. It’s all in the red.”

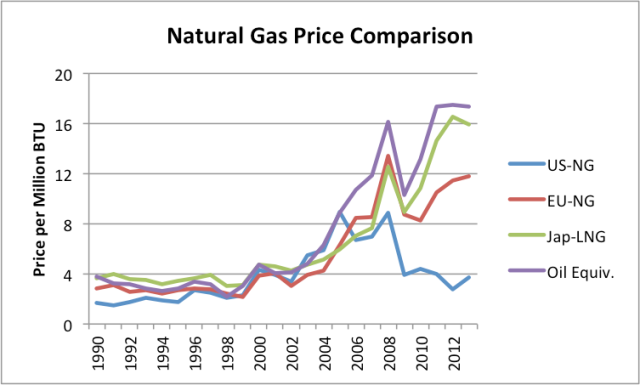
Why all of the natural gas exports, if we don’t have very much natural gas, and the shale gas portion (which is the only portion with much potential for growth) is so unprofitable? The reason for all of the exports is too pump up the prices shale gas producers can get for their gas. This comes partly by engineering higher US prices (by shipping an excessive portion overseas) and partly by trying to take advantage of higher prices in Europe and Japan.

Figure 6. Comparison of natural gas prices based on World Bank "Pink Sheet" data. Also includes Pink Sheet world oil price on similar basis.

Figure 6. Comparison of natural gas prices based on World Bank “Pink Sheet” data. Also includes Pink Sheet world oil price on similar basis.

There are several catches in all of this. Dumping huge amounts of natural gas on world export markets is likely to sink the selling price of natural gas overseas, just as dumping shale gas on US markets sank US natural gas prices here (and misled some people, by making it look as if shale gas production is cheap). The amount of natural gas export capacity that is in the approval process is huge: 42 billion cubic feet per day. The European Union imports only about 30 billion cubic feet a day from all sources. This amount hasn’t increased since 2005, even though EU natural gas production has dropped. Japan’s imports amounted to 12 billion cubic feet of natural gas a day in 2012; China’s amounted to about 4 billion cubic feet. So in theory, if we try hard enough, there might be a place for the 42 billion cubic feet per day of natural gas to go–but it would take a huge amount of effort.

There are other issues involved, as well. The countries that are importing huge amounts of high-priced natural gas are not doing well financially. They aren’t going to be able to afford to import a whole lot more high-priced natural gas. In fact, a big part of the reason that they are not doing well financially is because they are paying so much for imported natural gas (and oil).

If the US has to pay these high prices for natural gas (even if we produce it ourselves), we won’t be doing very well financially either. In particular, companies who manufacture goods with electricity from high-priced natural gas will find that the goods they make are not competitive with goods made with cheaper fuels (coal, nuclear, or hydroelectric) in the world marketplace. This is a problem, whether the country produces the high-priced natural gas itself or imports it. So the issue is not an imported fuel problem; it is a high-priced fuel problem.

Another issue is that with shale gas, we are the high cost producer. There is a lot of natural gas production around the world, particularly in the Middle East, that is cheaper. If we add our high cost of shale gas to the high cost of shipping LNG long-distance across the Atlantic or Pacific, we will most definitely be the high cost producer. Other producers with lower costs (even local shale gas producers) can undercut our prices. So at best those shipping LNG overseas are likely to make mediocre profits.

And there would seem to be great temptation to stir up trouble, to encourage Europe to buy our natural gas exports, rather than Russia’s. Of course, our ability to provide this natural gas is not entirely clear. It makes a good story, with lots of “ifs” involved: “If we can really extract this natural gas. If the price can really go up and stay up. If you can wait long enough.” The story makes the US look more rich and powerful than it really is. We can even pretend to offer help to the Ukraine.

Perhaps the best outcome would be if virtually none of this natural gas export capacity ever gets built–approval or no approval. If it is really possible to get the natural gas out, we need it here instead. Or leave it in the ground.

See the original article >>

Managed futures: Time to get back in

By Spalding Hall & Paul Rieger

The case for an investment in Managed futures has arguably never been stronger. While portfolio diversification is always imperative, many are currently concerned that traditional asset classes like equities and fixed income are priced to offer little in the way of solid returns over the coming decade. In addition, and perhaps somewhat counterintuitively, many hedge funds fail to help clients hedge their investments, with many programs actually showing positive correlations with equity markets. In contrast, Managed futures programs are aimed at offering investors uncorrelated returns that not only genuinely diversify a portfolio but have the potential to increase overall portfolio returns while also lowering overall portfolio volatility.

John Hussman, President, Hussman Investment Trust, does solid research on equity market returns. His models, which have shown tight correlation with future equity market returns (almost 90%), are estimating nominal total returns in the range of 0 to 3% annually for the coming decade in the equity markets, while showing negative returns on all time horizons shorter than around seven years.

Equity markets are extremely overvalued with the median stock even richer now on a price/revenue basis than at the 2000 peak. Stocks are not only overvalued, but they are trading here on record profit margins. Corporate profits/GDP are 80% above their historical norm. This is a mean reverting series. What happens to earnings when margins revert to a more normal level? As Kyle Bass says about the P/E ratio: “The E is wrong!”

Bond yields also low

When it comes to the 10-year Treasury yield, around 2.7% is what Hussman thinks stocks will yield over the next decade. One can look for higher yields in some spreads, but bond spreads are historically tight here as well. The Bank of America Merrill Lynch High Yield Master Option Adjusted II Index is currently priced at 3.85%. That is not a lot of return for the commensurate risk, especially when one considers the absolute low level of yields. In “The Policy Portfolio and the Next Equity Bear Market,” Bill Hester explores the real value of bonds in a diversified portfolio. Bonds’ true contribution to a diversified portfolio is that they often increase in value when equities enter a bear market. However, bonds don’t always go up the same amount that equities lose. In fact, Mr. Hester shows that bonds perform best when yield levels begin at average to above average yields, and when yields begin with an average to above average rate of inflation (which is set to decline in a recession-induced bear market).

While space does not permit a discussion of all the scenarios considered by Hester, he concludes: “Notice that unless interest rates were to fall to negative levels, investors cannot expect bonds to provide the same portfolio benefit as they have during bear markets in recent memory. From this analysis, those investors who are relying on a policy portfolio framework to protect their capital during the next bear market are left with a limited range of favorable outcomes.” And finally: “If a larger decline in stock prices were to occur, and for bonds to still defend against losses to the extent they have during the last two bear markets, yields on U.S. Treasury notes would need to go negative. In data reaching back all the way to 1871, this has never happened. That would likely result from an expectation for deep deflation. With stocks at currently high multiples on normalized earnings, that type of scenario would probably increase the odds off a deep recession and induce a much larger decline in stock prices.”

With equities, fixed income and other traditional investment solutions showing significant limitations, what other asset class is well positioned to offer true portfolio diversification? Consider Managed futures. For one, many managed futures programs have produced solid returns in the face of declining equity markets. This key characteristic is often referred to as ‘crisis alpha’ and its importance is difficult to overstate: Managed futures performed well during the quarter of Black Monday 1987, the Persian Gulf War of 1990, the Long Term Capital Management episode and Russian Crisis of 1998, the recession of 2000 -2002 following the Tech Bubble, as well as the credit crunch of 2008. During all of these time periods equities suffered and managed futures thrived, offering investors a haven and buffer from declining equity prices.

Investors may believe that hedge funds are most optimally positioned to achieve the important function of portfolio diversification. However, as alluded to above, this is not necessarily the case. Many hedge funds are positively correlated with equity markets. The HFRI Weighted Index shows a strong correlation to the S&P 500 Total Return of 0.74. Also, some hedge funds trade in illiquid markets that lack transparency and readily available mark-to-market pricing. In addition, many hedge funds and private equity funds regularly ‘lock up’ investors for a year or more, rendering the hedge fund investment illiquid.

With the taper under way, and the long-term effects of Fed intervention on the equity and bond markets still largely unknown, it is time for genuine portfolio diversification with the non-correlation benefits of managed futures. Managed futures programs also equip investors with ‘crisis alpha’.  And unlike many alternative investments, including hedge funds, it offers more favorable liquidity terms. Futures and options on futures, the underlying markets used by managed futures programs, are exchange-traded and marked to market daily, offering investors and managers both liquidity and a level of transparency.

Diversifying a traditional portfolio with a 10% to 20% allocation to managed futures (see chart below) has the potential to increase overall returns and decrease volatility. Should the current rally in equities extend through the spring, it is set to become the fourth longest rally recorded over the last 113 years. When is a better time to consider the important diversification benefits offered by managed futuro?

See the original article >>

History Strikes Back

by Shlomo Ben-Ami

MADRID – When the Cold War ended and the Soviet Union collapsed, the victors were beyond complacent, for they were certain that their triumph had been inevitable all along. Many in the West assumed that liberal capitalism’s victory over totalitarian socialism would necessarily bring an end to wars and sanguinary revolutions. Today, two powerful leaders – Russian President Vladimir Putin and Chinese President Xi Jinping – are demonstrating just how farfetched this view was.

The predominant Western view was exemplified in Francis Fukuyama’s 1992 book The End of History and the Last Man, which presumed that Western liberal democracy was the endpoint of humanity’s sociocultural evolution. In other words, Christian eschatology was transformed into a secular historical postulate.

That transformation was not new. Hegel and Marx embraced it. In 1842, the historian Thomas Arnold stated, with typical Victorian complacency, that Queen Victoria’s reign contained “clear indications of the fullness of time.” All of these historical prophets – whether heralding the realization of the Absolute Idea or the dictatorship of the proletariat – proved to be miserably wrong.

Not long after the West’s Cold War victory, the rise of Islamic fundamentalism and the return of national tribalism, even in the heart of “post-historical” Europe, challenged the concept of “the end of history.” The Balkan wars of the 1990’s, America’s wars in Afghanistan and Iraq, the bloody Arab revolts, and the exposure of Western capitalism’s ethical and systemic flaws in the global economic crisis undercut the idea further.

But perhaps the most salient reminders that history is still very much alive come from China and Russia. After all, neither China’s one-party state-capitalist system nor Russia’s plutocratic political economy is particularly liberal, and neither country is especially averse to asserting its (self-identified) rights by military means.

For China, this means “defending” its territorial claims in the East and South China Seas with an increasingly assertive foreign policy, conspicuously backed by growing military muscle. This behavior is amplifying long-festering regional tensions, while fueling competition between China and the United States/Japan alliance – a situation that recalls the pre-World War I struggle for maritime dominance between the United Kingdom and Germany.

For its part, Russia has ruthlessly strived to recover its lost continental empire, be it through the brutal repression of Chechnya, the 2008 war in Georgia, or the current assault on Ukraine. In fact, Russia’s recent actions in Crimea share many disturbing features with Adolf Hitler’s 1938 seizure of Czechoslovakia’s German-speaking Sudetenland – an important catalyst of World War II.

The fact is that Putin’s actions are not just about Crimea, or even about Ukraine. Just as Hitler was driven by the desire to reverse the humiliating terms of the Treaty of Versailles, which ended WWI, Putin is focused on reversing the Soviet Union’s dismemberment, which he has called “the greatest geopolitical tragedy of the twentieth century.”

Putin is thus challenging one of America’s greatest foreign-policy achievements: the end of the division of Europe and the establishment of free countries that could be drawn into the Western sphere of influence. And, unlike US President Barack Obama in Syria and Iran, Putin respects his own red lines: the former Soviet republics are not for the West to grab, and NATO will not be allowed to expand eastward.

Moreover, Putin has made ethnic nationalism a defining element of his foreign policy, using Crimea’s Russian-speaking majority to justify his adventure there. Likewise, ethnic nationalism drove Hitler’s assault on the European order: the Sudetenland was mostly German, and the Austrian Anschluss was aimed at merging the two vital parts of the German nation.

In his controversial 1961 study of WWII’s origins, the historian A.J.P. Taylor vindicated Hitler’s decision to take over the small successor states that were created at Versailles to check Germany’s power – a strategy by the victors that Taylor called “an open invitation for German expansionism.” The same could presumably be said today of Russia’s fatal attraction to the former Soviet republics.

Of course, no one wants a new European war. But Putin’s provocations and the legacy of Obama’s foreign-policy failures could spur him to cut his political losses by taking unexpected action. After all, Obama’s entire foreign-policy agenda – a nuclear deal with Iran, an Israel-Palestine peace agreement, reconciliation with estranged allies in the Middle East, and America’s strategic pivot toward Asia – now hinges on his capacity to tame Putin.

China’s role is complicating the situation further. By acquiescing in Russia’s actions in Crimea, Xi is joining Putin in challenging the world order that emerged from America’s Cold War victory. In doing so, China has allowed power calculations to outweigh its own long-held principles, particularly non-interference in other countries’ internal affairs – a change that its leaders would defend by asserting that the US has repeatedly demonstrated that power ultimately determines principles.

German Chancellor Angela Merkel – whose East German upbringing should have given her especially acute insight into Putin’s authoritarian mindset – has described the Russian leader as detached from reality, guided by nineteenth-century Machtpolitik. But it is Europe that has been living in a fantasy: a “post-historical” world where military power does not matter, subsidies can tame nationalist forces, and leaders are law-abiding, well-mannered gentlemen and women.

Europeans truly believed that the Great Game between Russia and the West was settled in 1991. Putin’s message is that the last quarter-century was merely an intermission.

See the original article >>

Risk On/Risk Off Shutting Off

by Attain Capital

There’s no doubt Commodities are receiving more attention this year than years past, and it’s because of breakouts in Natural Gas, Coffee, Cattle, Lean Hogs, Sugar, Wheat, and Corn. Now some of the these trends have reversed course, not allowing long term trend followers to fully capitalize – but we’ve seen markets moving on their own fundamentals, not based solely on the Fed Minutes or view on the economy (what became known as the risk on/risk off environment back in 2009/2010).

There haven’t been too many Risk On/ Risk Off days to speak of in 2014, with just 1 ‘risk on’ day in both February and March. We define risk on as an average gain of over 1% for “risk” assets; risk off is an average loss of over -1% for “risk” assets. (Click here for a more detailed breakdown.)

This is no doubt another sign that the ‘recovery’ is in full force, with markets dancing to their own beat instead of following equities higher or lower on big moves. But it also could be a sign of further compression in volatility and a pending volatility spike – no chart goes/stays down like this forever.

Overall, Global Macro and Managed Futures strategies should be enjoying this move away from the risk on/risk off environment- as markets moving  in different directions/amounts at different times allows for the benefit of market/sector diversification such strategies rely on for risk control. Now if they could just stay in whatever direction their independently moving for a little bit longer – we could capture some nice trends.

Risk On Off

See the original article >>

Over All ..

994135_691931767526429_1286506074_n

Control your risk with simple and winning rules – Super Commodity trading signals for 1 April

   
Super Commodity Trading Signals Report

Latest Trading Alerts for 01 April Download Historical Results
Open position value at 1 April $ 4,855.00 2014 P/L   +6.45%
   

Mixed long/short open position 
Today entered Short Feeder cattle, Long eMini Midcap 

4 Open Positions   
3 Long  
1 Short    
2 with Stop Loss at breakeven

In true signal service, attachments reports are sent to customers also via email, in the evening after the markets close. Those who wish to receive them during the demo, please send me their email address.


1296672115_Stocks
Download Super Commodity Tading Signals for 1 April

Beautiful entry position yesterday on eMini Midcap (Long) and Feedere Cattle (Short). As often happens with Super Commodity, markets raced in favor just after the entry position, moving the Stop Loss to breakeven the same day.

Super Commodity works on all futures markets of commodities, indices, currencies, financials with the same fixed and non-optimized parameters, the same as the Super Stocks. This ensures robustness of the results and content drawdown.


Material in this post does not constitute investment advice or a recommendation and do not constitute solicitation to public savings. Operate with any financial instrument is safe, even higher if working on derivatives. Be sure to operate only with capital that you can lose. Past performance of the methods described on this blog do not constitute any guarantee for future earnings. The reader should be held responsible for the risks of their investments and for making use of the information contained in the pages of this blog. Trading Weeks should not be considered in any way responsible for any financial losses suffered by the user of the information contained on this blog.

Weak demand in OJ offsets losses from less production

By Jack Scoville

(NYBOT:OJK14)

Futures closed higher despite some bearish demand news today. Neilsen said that Orange Juice consumption for the last four weeks was 43.55 million gallons, down 5.3% from last year. The weaker demand helps offset the losses from less production in Florida. The market will stay worried about the potential loss of demand and knows it is too early to worry about the hurricane season, which is the next major production risk for weather. Greening Disease and reduced Florida production keeps the prices supported. Brazil has seen weather might that be stressing trees as reports indicate that many áreas still need rain. Some forecasts call for rainnin production áreas this week. Florida harvest conditions remain good. The Valencia harvest is strong. Blooms are being reported in all parts of Florida. Demand remains a big problem for the bulls. Many consumers continue to look for other sources of nutrition that is found in Orange Juice due to the higher prices that are coming from the lower production in Florida and Brazil.

Overnight News: Florida weather forecasts call for mostly dry conditions. Temperatures will average near to above normal. Brazil should be mostly dry and warm. 

Chart Trends: Trends in FCOJ are mixed. Support is at 151.00, 147.00, and 144.00 May, with resistance at 155.00, 156.00, and 157.00 May.

Cotton (NYBOT:CTK14)

Futures were mixed, with nearby months a little lower and new crop months a little higher. USDA showed that farmers intend to plant 11.1 million acres of Cotton this year, from 10.4 million last year. The report was in line with trade expectations. The market had absorbed some selling due to news of reduced prices for Chinese government supplies. The move by the Chinese government is designed to reduce government stocks and cut import demand. The domestic cash market remains tight and is supporting futures prices in the front months, but exporters have told wire services that export demand is vey soft. Most producers appear to be sold out, and spinners in the east are forced to pay up to get supplies. Charts suggest that prices can work higher over the next couple of weeks. Brazil conditions are reported to be good in Bahia with warm temperatures and a few showers. Warmer temperatures are slowly returning to production áreas in the US and there has been some fieldwork done. It is a Little wet and cool in the Delta and Southeast. The Texas Panhandle should be mostly dry this week.

Overnight News: Delta and Southeast áreas will get dry weather today and some showers over the second half of the week. Temperatures will average above normal. Texas will see mostly dry weather. Temperatures will average above normal through Thursday, then near to below normal. The USDA spot price is 87.69 ct/lb. today. ICE said that certified Cotton stocks are now 0.254 million bales, from 0.254 million yesterday.

Chart Trends: Trends in Cotton are mixed to up with objectives of 9835 May. Support is at 91.80, 91.50, and 90.50 May, with resistance of 94.80, 95.20, and 95.80 May.

Coffee (NYBOT:KCK14)

Futures closed lower on forecasts for rains to appear this week in Coffee áreas of Brazil. The rains in March have been beneficial, and production has become more stable. London was slightly lower, but stays supported by the possibility of production losses for the next crop in Vietnam. Exports have increased over the last couple of months as producers there start to move stocks amid better prices. However, there are still some fers of less production in the coming year due to dry conditions at flowring time. The lack of rain in Coffee producing áreas of Brazil since the beginning of the year has hurt Coffee production potential and losses are expected once the harvest starts in a month or so. Cash markets have become more animated in the last few weeks in Latin America and roasters are showing more buying interest.

Overnight News: Certified stocks are lower today and are about 2.585 million bags. The ICO composite price is now 158.90 ct/lb. Brazil will get mostly dry weather, but some showrs are likely on Monday. Temperatures will average near to above normal. Colombia should get scattered showers, and Central America and Mexico should get mostly dry weather, although some showers are expected in Eastern Mexico. Temperatures should average near to above normal.

Chart Trends: Trends in New York are mixed. Support is at 174.00, 172.00, and 169.00 May, and resistance is at 181.00, 184.00 and 189.00 May. Trends in London are mixed. Support is at 2050, 2015, and 1985 May, and resistance is at 2100, 2130, and 2175 May. Trends in Sao Paulo are mixed to up with objectives of 230.00 September. Support is at 216.00, 214.50, and 212.00 September, and resistance is at 231.00, 238.00, and 240.00 September.

Sugar (NYBOT:SBK14)

Futures were lower on forecasts for some beneficial rains to appear in Brazil this week. London was lowr as well, but remains better suppported by higher domestic and export offering prices in India. India remains a wild card for exports due to massive subsidies. It subsidizes producers and now exporters and that makes it very hard for the country to offer exports at reasonable prices while obeying WTO rules. The weather in Brazil remains important, and regular rains are still needed. The rains this week look to be very beneficial. There are worries that El Nino is starting and that it would hurt rains in India, but increase rains in Brazil. Thailand has been selling Sugar with steady or weaker differentials. Demand news remains hard to find. Weather conditions in key production áreas around the world are rated as mostly good except for the dry weather in Brazil.

Overnight News: Brazil could see scattered showers and near to above normal tempertures.

Chart Trends: Trends in New York are up with objectives of 1850 July. Support is at 1800, 1770, and 1730 July, and resistance is at 1840, 1850, and 1860 July. Trends in London are up with objectives of 494.00 August. Support is at 481.00, 478.00, and 472.50 August, and resistance is at 497.00, 500.00, and 504.00 August.

Cocoa (NYBOT:CCK14)

Futures closed lower. Charts show that the market had a reversal type trading day on Friday, implying higher prices are coming, but was unable to penétrate some important resistance areas. The markets gave back a lot of the rally yesterday and prices are now back in the trading range. The idea of ever increasing Asian demand has encountered some resistance as the Chinese economy has shown some weakness. Better tan forecast production in West Afica and Asia has also hurt the bull case. Bears have not been able to break futures from the sideways longer term range, either as overall the market remains tight Mid crop conditions seem good in West Africa and generally good in Southeast Asia. Butter ratios remain strong on ideas of short supplies of Cocoa Butter in Europe and North America, but could weaken in the short term as most holiday demand should be covered. Asian demand has been strong.

Overnight News: Mostly dry weather is expected in West Africa, but a few showers are posible in southern areas. Temperatures will average mostly above normal. Malaysia and Indonesia should see scattered showers, with best amounts and coverage in Indonesia. Temperatures should average near to above normal. Brazil will get dry conditions or light showers and near to above normal temperatures. ICE certified stocks are higher today at 4.800 million bags.

Chart Trends: Trends in New York are mixed. Support is at 2935, 2920, and 2900 May, with resistance at 3000, 3010, and 3050 May. Trends in London are mixed. Support is at 1855, 1840, and 1825 May, with resistance at 1890, 1900, and 1920 May.

See the original article >>

Is China playing us for fools?

By Phil Flynn

No Fooling!

The Chinese manufacturing sector is contracting! April fool!  No in sharp contrast to the HSBC survey which showed that manufacturing fell to 48.0, the official purchasing managers’ index for manufacturing came in better than expected as it increased from 50.3 from 50.2 in February.

Of course already some are wondering if the Chinese government is “juicing” the number so they will be slow to stimulate the economy. Even so for this time of year this is the smallest increase ever in the month of March so really the number is nothing to write home about. So from a Chinese oil demand perspective the number raises concerns about overall global oil demand growth as most expected that demand would be driven by China... Perhaps it would have been better to get an even weaker number so the market would be assured that China would give the economy a big shot of stimulus. The market still counts on China for oil demand growth and if China falters that hope will be just for April Fools.

Corn farmers are pulling back on corn acres instead of beans. That along with transportation issues is giving ethanol a boost. Ethanol gained for three days in a row and had the highest quarterly increase on record as producers sought ways to get the biofuel to market.  Bloomberg reported that ethanol futures climbed 6.4%.  Ethanol companies reduced output because of a scarcity of trains in the Midwest, where about 89% of plants are located.

Denatured ethanol(CBOT:FZ.C)for April delivery rose 20.7¢to $3.459 a gallon on the Chicago Board of Trade, the highest settlement since July 11, 2006. Prices advanced 81% this quarter, the most since 2005 in data compiled by Bloomberg. It bested the top performer, coffee, of the 24 commodities on the Standard & Poor’s GSCI Index. Cold, snow and competition for rail cars have cut into train traffic, prompting distillers to reduce production. A 2007 U.S. law requires ethanol, mostly made from corn, to be blended into gasoline, so higher costs for the biofuel may boost prices at filling stations.

Ethanol is more expensive than gasoline! Gasoline for April delivery fell 2.65¢, or 0.9%, to $2.911 a gallon on the New York Mercantile Exchange. The futures cover reformulated gasoline, made to be blended with ethanol before delivery to filling stations. Ethanol’s premium to the motor fuel expanded to 54.8¢ from 31.45¢ on March 28. The additive traded at a discount to the motor fuel for the past two years, until March 21.

In cash trading, ethanol rose 7.5¢ to $4.175 a gallon in New York, 5¢ to $3.85 in Chicago, 14¢ to $4.125 on the Gulf Coast and 5.5¢ to $4.005 a gallon on the West Coast, data compiled by Bloomberg show.

This comes as farmers are reducing corn plantings. The Wall Street Journal says that corn competition from abroad, and a flattening out of federal ethanol mandates, mean U.S. farmers are starting to turn cautious. On Monday, federal forecasters said farmers are planning to plant their smallest crop in four years as they switch millions of acres mostly to soybeans. The U.S. Department of Agriculture expects 91.7 million acres of corn to be planted this spring, down nearly 6% from the record crop farmers intended to sow last spring. Actual plantings in 2013 ended up lower because of wet weather, but farmers still produced a record harvest.

Corn prices have been down around a third from last year, though they rallied Monday on expectations that the sharp cut in plantings will combat rising production. Chicago Board of Trade corn futures expiring in May settled 2% higher at $5.02 a bushel, a seven-month high.

The Journal goes on “But record-setting corn prices spurred production elsewhere. Federal data show farmers outside the U.S. will harvest 349 million acres of corn in the current crop year, up 35 million from five years ago—an expansion larger than the area of Greece.  For much of the past four decades, the U.S. has accounted for two-thirds or more of global corn exports. That fell to a record low of less than 20% last year as the 2012 drought made U.S. corn too expensive for many countries. Exports are now rebounding, but forecast to make up 36% in the current crop year, according to federal projections.

Growing global competition is emerging as rapid growth in corn demand at home ends. Starting in 2005, federal law required increasing amounts of ethanol to be blended into the U.S. gasoline supply, with ethanol production claiming more than 40% of corn consumption last year, up from less than 15% in the 2005-06 crop year. But the buildup of demand from ethanol makers has ended, and a reduction in fuel use because of more efficient cars and people driving less has federal officials looking at scaling back the requirement.

The rise in ethanol production came amid disappointing harvests and growing hunger for corn from China as that nation's economic growth fueled greater demand for meat. The result: Corn prices eclipsed $8.30 a bushel in 2012 at the height of the U.S. drought, compared with an average of $2.90 in the 2000s. One of the fastest responses to the record prices is coming from Ukraine, which is on track to become the world's third-largest corn exporter. This year, its shipments are expected to surge 45% to 18.5 million metric tons.

Fueling that growth is interest from China, which has emerged as a major buyer after avoiding corn imports for several years. The Asian nation wants suppliers beyond the U.S., with not just Ukraine but Argentina and Brazil competing to sell crops there. The U.S. recently has seen hundreds of thousands of metric tons rejected by China because they contained a genetically modified trait that is unapproved in that country. Growing competition is fueling volatility in prices for U.S. farmers. Political unrest in Ukraine, where Russia annexed Crimea, has rippled through global markets. Traders fear financing will dry up and costs to import fuel and fertilizers will rocket, bringing a sharp decline in spring planting in Ukraine.

Ethanol of course is one reason why gas prices have been rising. Of course we should see a break in April as the seasonal maintenance season ends. 

See the original article >>

Don’t worry about the dreary first quarter — yet

By Mark Hulbert

Stock market bulls are certainly hoping that the past is not prologue. The Dow Jones Industrial Average /quotes/zigman/627449/realtime DJIA +0.39%   actually fell slightly for the first quarter ( down 0.7%), even though the S&P 500 /quotes/zigman/3870025/realtime SPX +0.41%  and the Nasdaq Composite /quotes/zigman/12633936/realtime COMP +1.15%   were able to eke out a miniscule gain. A flat 2014 would be a big disappointment, following the market’s double-digit percentage increases in each of the previous two calendar years.

Fortunately, the historical data do not show any significant correlation between the market’s performance in one calendar quarter and its subsequent performance. At least that is what I found upon feeding into my PC’s statistical software the Dow’s quarterly returns back to its creation in 1896.

Average second quarter DJIA gain
Average DJIA gain last 3 quarters of year

When DJIA gains in first quarter
1.51%
5.99%

When DJIA loses in first quarter
1.84%
5.90%

As you can see from the table, the DJIA’s second-quarter gain is slightly better following down first quarters than when it rose during the first three months of the year. Note carefully, however, that the difference is not significant at the 95% confidence level that statisticians typically use to determine if a pattern is genuine.

In other words, a great second quarter is just as likely following a down first quarter as it is following a fabulous one.

The same statistical conclusion applies when we focus on the last three quarters of the year.

Consider the four other occasions over the past half century in which the Dow — like this year — lost less than 1% during the first quarter. In two of them the Dow rose during the second quarter, and in the other two it fell. Over the last three quarters of those four years, the Dow’s direction was also equally split — up in two and down in two.

These results constitute yet another victory for the efficient market. The stock market’s level at any given time reflects all available information at that point.

So in coming months the stock market will rise if the news is better than expected, fall if the news is worse, and be more or less flat if things work out as the market currently expects.

The situation is no different now than at any other time, in other words.

And while we might think we’d like it if the stock market were more predictable from quarter to quarter, you should be careful what you wish for.

If the market’s return on a given quarter were related to how it did in the previous one, then the market would suffer from “unnecessary and unhealthy turmoil,” according to Lawrence Tint, a chairman of Quantal International, a firm that conducts risk modeling for institutional investors. In an interview, he said “We can be comforted by the fact that reasonably efficient markets always base their level on anticipated future returns, and do not include history in the calculation.”

See the original article >>

Margin Debt sky rockets to new all-time highs! Does it matter???

by Chris Kimble

CLICK ON CHART TO ENLARGE

Margin Debt took a giant leap over this year, rocketing to new all-time highs! Doug Short shares updated Margin Debt data (HERE)

As I shared above..."It doesn't Matter....Until it Matters!" Some day this will matter!!!  In the past it mattered the most when Margin debt started to "shrink from high levels!"

Will it be different this time?

See the original article >>

April 2016: Dow Jones-30 Suspended Due to Lack of Interest

by Charles Hugh Smith

Though many blame the Global Crash of 2015 for the loss of faith in stocks, others say the erosion dated back to at least 2014.

April 1, 2016: In an unprecedented move, Dow Jones announced that it was suspending its iconic Dow Jones Industrial Average of 30 large-cap stocks "due to lack of interest." The move caught the mainstream media by surprise, but those who had watched public interest and participation in the stock market dwindle in recent years expressed little shock.
"Now that everybody knows it's all rigged, that it's just a bunch of computers skimming from each other and a handful of daytraders, what's the point?" commented one former employee of a trading desk.
The few still employed on Wall Street were equally circumspect. "There's nobody here except a few techs running the machines," one lamented. "A couple of years ago guys were killing themselves because they'd lost a lot of money. Now we're dying of boredom."
"It's really rather surreal," one former financial journalist marveled. "The big trading desks are still making money 400 days in a row, the Federal Reserve is still pumping money into stocks, but nobody cares any more. Once they realized the market no longer had anything to do with the real economy or their future, they lost interest."
Though many blame the Global Crash of 2015 for the loss of faith in stocks, others say the erosion dated back to at least 2014, when the F.B.I. revealed its investigation into high-frequency trading (HFT), and the perception that the market was rigged went mainstream.
"There were plenty of buy-side analysts who said, 'OK, the market's rigged, so that means it's safe to pile in,'" the journalist noted. "But the Global Crash of 2015 mooted that guarantee."
A former financial analyst who now grows organic lettuce for a living observed, "As soon as all the suckers, and by that I don't mean Ma and Pa Kettle, I mean the pension funds and insurance companies, had their heads handed to them in the crash, it was game over. When the Fed started openly buying equities, the funds that had survived the crash didn't jump back in."
According to a well-connected observer who requested anonymity, public disgust extends beyond the rigged market to everyone who aided and abetted the scheme. "The F.B.I. investigates for two years but can't find anyone to prosecute. What does that say about our system of so-called justice? It's as rigged as the market."
Rating of financial news programs plummeted as the public lost interest, and most were cancelled due to poor ratings. Jim Cramer still hosts a web-based program touting stocks but the audience appears to be mostly hecklers who lost money following his "stay long and strong" advice just before the crash wiped out everyone who believed the Fed had their back.
One former Wall Streeter waxed nostalgic for the good old days when the stock market was still viewed as the road to legitimate riches. "It was really something else," he mused. "People believed the hype, they believed all the phony BS about the market being a level playing field and the Fed having their back, and they gave us their money willingly, even when it was obvious it was just a big embezzlement scheme."

See the original article >>

Financial Stability Board Warns Sharp Market Adjustments May Expose System Vulnerabilities

By Geoffrey T. Smith

Large movements in interest rates could threaten the postcrisis economic peace, the Financial Stability Board said Monday.

The world’s financial system is in better shape now than it has been in some time, thanks to the raft of overhauls that regulators have pushed through since the 2008 crisis. However, the FSB, which coordinates the global regulatory response to the crisis on behalf the Group of 20 largest industrial and emerging economies, warned that the system could again come under stress in the form of “sharp adjustments in interest and exchange rates.”

“Some emerging markets may experience a combination of slower growth, capital outflows and higher borrowing costs which may expose vulnerabilities,” the FSB said in a press release after a plenary meeting in London.

Although it didn’t spell out the source of such a shock, economists are concerned that the central banks of some major economies such as the U.S. and the U.K. may have to raise interest rates earlier than currently predicted as their recoveries gain momentum.

FSB Chairman Mark Carney said the group had made good progress on the central plank of its policy agenda, ending the threat of banks that are “too-big-to-fail.” Progress on this issue has been slow, owing to the difficulty of persuading individual regulators to cooperate effectively in cleaning up a failed bank with business in multiple countries. The FSB is due to present a set of proposals to the G-20′s leaders at a summit in Brisbane in November.

On the issue of how to treat derivatives in a cross-border resolution–a particularly thorny issue–Mr. Carney said the FSB would ask the financial industry to come up with a solution by September. Regulators have tried to persuade the International Swaps and Derivatives Association, or ISDA, to revise the terms of a master agreement governing derivatives contracts so as to suspend derivatives claims on a failed bank until it is clear how the institution can be resolved. ISDA argues that the idea is unworkable.

Mr. Carney said that the desire to let the industry work out a “contractual” solution to the problem didn’t represent a lessening of the FSB’s ambition. “The mandate is there – to move this out of the technical and into the practical,” he told a press briefing.

Elsewhere in the briefing, Mr. Carney noted that the FSB is still “dead set” on creating a global capital standard and minimum capital requirements from the world’s largest insurers, despite the industry’s protestations that they don’t represent the same kind of threat to the financial system as global banks.

“There are risks in the non-traditional businesses of some of the insurers, especially among the largest groups, and they are very, very large,” Mr. Carney said.

When asked whether Russia, one of the FSB’s 24 member nations, had raised the issue of potential threats to financial stability from an escalation of the western sanctions on it following its annexation of the Ukrainian region of Crimea, Mr. Carney confirmed that “there was a discussion of geopolitical risk” but declined to elaborate. So far the sanctions have had little direct impact on the financial system, being targeted at individuals rather than institutions.

See the original article >>

Jumbos still cheaper than conforming mortgages

by SoberLook.com

For years mortgage rates on "jumbo" loans (definition) have been higher than for traditional (conforming) mortgages (definition). Since jumbo loans were larger than the upper limit permitted to be packaged and sold to Fannie and Freddie, banks would typically charge a premium for "illiquidity" on these products. But starting last year conforming mortgages became more expensive for borrowers than jumbo loans.

Source: Barchart

This distortion persists today and is directly related to the Fed's quantitative easing program. Since conforming loans are funded via agency MBS (bonds that Fannie and Freddie sell to fund purchasers of pools of conforming loans from banks), the pricing on these loans is directly linked to MBS yields. And as discussed last year (see post) the Fed has been dominating the MBS market via QE3. As the Fed's taper expectations took hold (after Bernanke's May 22nd speech), MBS yields rose sharply. With that, conforming mortgage rates also increased.
Jumbo mortgage rates on the other hand rose more slowly because these loans tend to stay on banks' balance sheets and are not funded with MBS. Moreover banks are happy to get paid a lower rate on loans to these higher net-worth creditworthy clients. Banks fund themselves with near-free deposits and charge jumbo clients 4.25%, keeping the spread. And unlike conforming loans that get sold at "market" levels, banks don't have to mark jumbo loans to market (banking book accounting treatment is based on accruals unless there is an impairment). The dynamics of conforming mortgages being more directly tied to MBS pricing (which is impacted by the Fed's securities purchases) and different accounting treatment have resulted in 30-year jumbos being some 20 basis points cheaper than standard mortgages.

See the original article >>

Fears for US wheat, even as showers stabilise crop

by Agrimoney.com

Academics cautioned over the threat to some US winter wheat seedlings from dryness, and pests, even as official data showed some stabilisation in the condition of the crop, thanks to some "much-needed "rains.

US Department of Agriculture scouts reduced their rating on the condition of winter wheat in Kansas, the top growing state, to 32% viewed as "good" or "excellent" as of Sunday.

However, that represented a decline of just 1 point week on week.

"Areas in the eastern half and northwest received some much-needed precipitation in the form of light rain and snow," USDA scouts said, while acknowledging that totals were limited to less than half an inch.

'Signs of recovery'

In Texas, the proportion of winter wheat rated good or excellent remained steady at 11%, even though winter grains crops in the Cross Timbers area "showed signs of recovery following recent precipitation".

"Warmer weather along with thunderstorms, high winds, and increased humidity were reported in many areas of the state."

And in Oklahoma, where south eastern farms received an average of 0.8 inches of rain in the weekend to Sunday, the proportion of winter wheat rated good or excellent held at 17%.

'We need moisture'

Nonetheless, UDSA scouts cautioned that "significant moisture is needed across the whole state, assuredly in the Panhandle and south west for winter wheat development".

And a crop tour by Oklahoma State University warned that time was running out for rains to arrive.

"The primary concern for all of Oklahoma remains lack of moisture," Jeff Edwards, small grains specialist, said.

"There are some fields in north central and north western Oklahoma with good yield potential; however, the best areas are starting to turn blue due to lack of moisture.

"Another couple of weeks of warm temperatures and wind without rain will turn blue wheat to brown. We need moisture."

Knock-on concerns

The dryness has, besides directly depriving wheat seedlings of moisture, prevented the uptake of nitrogen fertilizers and encouraged the spread of pests, the Oklahoma State University tour found.

"We simply have not had enough moisture to get good movement of top dress nitrogen into the rooting profile and for the wheat crop to take up applied nitrogen," Dr Edwards.

His colleague Tim Royer, university entomologist, warned that the main pest concern was brown wheat mites, which "can severely damage wheat that is already stressed due to drought or other adverse environmental conditions.

"They feed by piercing plant cells in the leaf, which results in 'stippling'. As injury continues the plants become yellow, then dry out and die."

See the original article >>

Zero Sum Inflation: Cheap Goods, Soaring Assets, Clueless Keynesian Central Bankers

by Jeffrey P. Snider

Official measures of inflation don’t really tell us what they are designed to demonstrate. Any expectations of veracity should be very much tempered by the real world complications of price changes. Ultimately, we are trying to measure redistribution of the sort that is as far, far from homogenous. The effects of price changes are going to be drastically different across the full spectrum of system participants and agents.

By and large, orthodoxy persists in appealing to “inflation” because it is believed to be a catalyst. There is some acknowledgement of these complications of redistribution, but only in terms of a cost/benefit analysis that strangely only predicts more benefits than costs. In the course of such socialization, there are eggs to be broken in the inflation omelet.

Despite the persistent appeal to debasement, nothing has gone to plan anywhere it is being tried. Japan persists in its malaise, now having nearly destroyed every economic advantage built up since the end of WWII. The majority of residents in the US (via poll estimates) believe the country has never left recession. Europe is supposed to be experiencing recovery, but only in the narrowest sense of a slew of non-negative/slightly positive numbers.

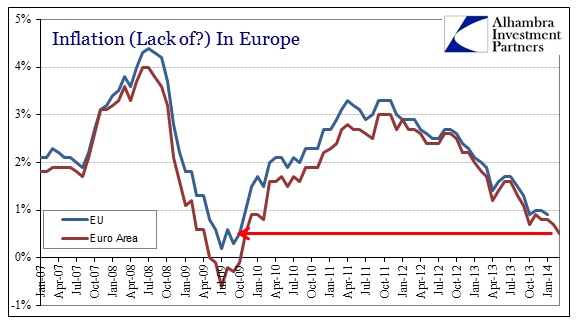
In Europe, despite artificially “supporting” (via threat) every asset market price to be found, the economy continues to sink absent any forward demand. The idea of recovery is lost on the spreadsheet practitioners who only model economies and have no actual experience of them. Inflation now falls closer to zero, decelerating more than 1% since July (from +1.6% to +0.5%) encompassing all of this presumed recovery period.

ABOOK Mar 2014 EU Inflation

While it tells us very little about the redistribution taking place in Europe, what these figures show is that there exists very little external demand for anything in the real economy. There is a very strong correlation between such low inflationary figures and recession. Alongside loan and credit creation, there is no “money” footprint introducing such a gangly catalyst. In fact, there is a conspicuous lack of any catalyst at all, which is consistent only with this new kind of “recovery.”

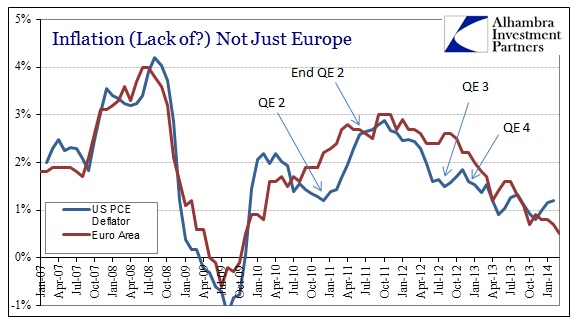
You might be tempted to dismiss these results as particular to Europe, especially since the ECB has not (yet) joined the full balance sheet expansion embraced in the US and Japan. Despite that extraordinary difference in policy operation, the results are shockingly the same on both sides of the Atlantic.

ABOOK Mar 2014 EU Inflation US

The tandem nature of these measures of “inflation” more than suggest a few faults in orthodox explanations and interpretations. For starters, there is only consumer inflation included in these measures, meaning an entire class of potential uses of credit and “money” is left in the dark. It needs very little study, however, to see asset prices experiencing the full froth and fury of central planning via central banking. The higher asset prices go on both continents, the less likely financial participants will be to settle for low-interest rate lending into the real economy.

It does very much suggest that there is almost a zero-sum game now in terms of monetary expression – the higher asset prices rise (including all forms of credit) the lower consumer prices fall as marginal demand for anything is sapped via the credit channel. There is no room on the collective balance sheets of global financial participants, it seems, for both marginal lending to businesses (particularly without size) and financial speculation. If it can’t be securitized, it can’t be financialized and produce spectacular price volatility (only upside, of course; downside is the Greater Fool’s problem). Besides, the chance for total return on the speculative side far outweighs the boring and utilitarian aspects of real economy credit under the guise of monetarism; not to mention central banks are implicitly supporting asset prices and not creditworthiness.

You would expect the imbalance to only grow over time, as the lack of demand suggested by these inflation figures only increases the dour outlooks of those in the real economies of both jurisdictions. That will only “convince” more financial resources to move to asset inflation at the expense of the other.

In another instance of debunking, this description shows that one of the main theories behind orthodox appeals to inflation is totally wrong – these are not closed systems. The fact that both the US and Europe are in almost perfect tandem conclusively establishes the open nature of the global financial system, especially as it dominates now over the real economy. Both the Federal Reserve and the ECB assume each respective economy as closed, but that cannot be the case or inflation rates would be at least partially idiosyncratic beyond very brief divergences. Since both central banks have, again, used separate means to achieve “stimulus” and both systems ended up so aligned regardless, it cannot possibly allow for any other interpretations.

That is true, of course, beyond just geography. The open system applies vertically as well as horizontally. Mainstream economics posits that financial channels run exclusively to the real economy, but after the history of that past two decades (and going back even further) there should be no basis for that expectation. The exchange of financialisms into asset prices is far more than a “leakage” of credit intervention by centralized means, and that potentially torrential flow to asset inflation is a second fatal violation of the closed system hypothesis.

It would be exceedingly difficult to try to yield such control without at least understanding the process, yet that is exactly what we see. Inflation is there, just in nothing that can fairly be called a recovery. This new kind of recovery is known colloquially as a bubble.

See the original article >>

A return to honest carry…and volatility

By John Kicklighter

We are starting to see a glimmer of the return to carry in the foreign exchange market with the Federal Reserve now on the taper path. We even have seen the first rate hike amongst the developed world’s central banks as the Reserve Bank of New Zealand lifted rates. This is an important turning point for the global financial markets, but it is particularly critical for currencies. Yield establishes a hierarchy for global capital flows while also engendering greater volatility by fostering competition and simultaneously draining support built up through moral hazard.

The road out of the deep stimulus trenches will be a long one, but the early moves are often the most lucrative. Establishing who is leading and lagging in this race will be a key assessment of currency performance moving forward. At the same time, these changes could also provoke turmoil in a delicately balanced backdrop of speculative positioning.

We have seen equities charge to record levels, tepid carry trades leveraged to multi-year highs and high-quality bonds swapped out for their high yielding counterparts. With rates of return (interest, dividends, yield) having collapsed in the wake of the financial crisis, market participants have had to take on greater risk to generate returns on par with—much less better than—benchmarks like the S&P 500 (CME:ESM14). This has led to years of stockpiling risky exposure and building leverage to unseen heights. “Nowhere else to go,” (below), shows the gearing that has set the foundation underneath the remarkable performance.

A Balancing act

In an ideal world, economic and financial conditions would catch up to speculative positioning and substantiate the levels and exposure markets have sought. Yet, “ideal” tends to be academic rather than practical market application. Where is the tipping point for the grander scale of risk vs. reward? How proactive will the world’s monetary policy leaders be in trying to curb or prevent the scale down in risk?

Many central bankers, political officials and prominent economists have voiced their concern over what the removal of stimulus can do to the global markets. Yet, the costs accompanying QE3 are also starting to be taken more seriously amongst their ranks. Some vocal hawks (such as Dallas Fed President and voting FOMC member Richard Fisher) have even voiced concern that such extreme accommodation has distorted markets by encouraging excessive risk taking (see Cover Story, page 14). And though his is not a popular opinion amongst his international colleagues — at least not publically—concerned central bankers like Fisher have even said the situation is so unbalanced that they support a withdrawal of the extracurricular support even through a significant market correction.

This evolving view is important to appreciate. The shepherds of the market are tacitly—and in some cases explicitly—acknowledging the excesses of the market. Furthermore, they are committing to letting some of the air out to prevent another financial disaster and a stimulus-resistant strain of investor fear. In this way, monetary policy can spark another wide-spread shift in speculative sentiment, but this time it is a bearish threat.

In the event of a broad deleveraging move, the forex market will quickly realign to its traditional risk positioning. Those currencies that have suffered under the monikers of “safe haven” or “funding currency” during the past five years will be best positioned to gain. The U.S. dollar is undoubtedly the favored refuge should fear leverage appetite for liquidity. The Japanese yen fits the mold a little differently as it was used to build the carry trade, which would thereby appreciate as the position was unwound. Alternatively, the market’s investment currencies, such as the Australian and New Zealand dollars, will be most exposed while those that took advantage of low liquidity conditions to advance (Euro and Pound) would similarly face headwinds.

U.S. Dollar: Coming from behind

Just a year ago, the U.S. dollar (NYBOT:DXH14) was considered the most stimulus-logged currency amongst the majors. The Fed’s unprecedented quantitative easing programs had driven yields down in the United States while simultaneously ramping up appetite for higher risk globally. Yet, the central bank has headed towards the light since the fateful Dec. 18 FOMC meeting, when  the group announced its first reduction in the open-ended QE3 program—a $10 billion reduction that left the monthly purchases at $75 billion per month. More importantly, as the weeks and months passed by, the central bank made it known that a steady reduction in its purchases was the status quo as it cut another $10 billion in the first meeting of 2014. Altering their pace to disarm would require a substantial change in economic circumstances.

In the early stages of the taper, the dollar seemed to take little joy out of the change. That was in part due to a buildup of expectations into the turning point. However, as the wind down continues, impact will be drawn into greater relief, especially if other central banks maintain or expand their own efforts.

Eventually, the market will start to see the specter of the first rate hike from the Fed out on the horizon. Forex and rate markets are forward looking, especially when it comes to yields, so that time frame will draw speculative waves well before it is realized. According to a Reuters’ poll conducted in early March, approximately 51% of economists surveyed expected the first hike to happen in mid-2015. Around 22% said it would happen earlier. In the scope of scenarios, a rate hike from the Fed would bolster the dollar’s appeal as it moves up the carry curve even though its safe haven appeal may be undermined by the steady conditions that would foster buoyant interest rate forecasts. Then again, a market-wide speculative correction could leverage its dormant safe haven appeal (see Dollar volatility,” below). In other words, the greenback is very well positioned, and the worst version of its future is a market that is stuck in the doldrums for the near future.

Euro: ECB hopes for status quo

Few currencies have benefitted more from the quiet and consistent market conditions we have seen over the past quarters. Low volatility and a reach for yield have helped gloss over investors’ eyes so that the troubled state of the Eurozone’s member economies, the lingering exposure of its financial markets and the excesses of its assets are readily overlooked.

While the Fed has started to move to reduce its stimulus injections, the ECB has actually seen its balance sheet contract. This is not a proactive effort on their part; rather it reflects regional banks repaying the exceptionally low yield, three-year loans the central bank was offering during the height of the region’s financial crisis via the Long-Term Refinancing Operation programs. This stimulus drainage has in turn lead market-based yields—like the Euribor rates—to rise. While still modest, the carry shift is noticeable in the near-zero-rate environment we have suffered through.

Another effect of the stimulus drain, though, is a reduction in extra liquidity for the banking sector. That is a risky position even if regulators are confident in the outcome of the stress test results due later this year. Furthermore, it adds to the uneven economic conditions between members like Germany on one side and Greece on the other.

Perhaps the most dangerous circumstance for the euro is founded on the same elements that have led the S&P 500 to its nosebleed levels. The chase for yield started to really hit its stride at the end of the Eurozone financial crisis. With lending rates on both the sovereign and corporate level swelled by the fallout, ambitious investors seized the opportunity. Taking advantage of the overindulged “tail risk” in the region could be called reasonable. Yet, the market took it much further than that as capital continued to flow in. In fact, the speculative drive was so aggressive, that short-term yields (two-year) sovereign debt for Spain and Italy—with an unemployment rate above 25% and the largest debt load in Europe—hit record lows (see “Pigs in a blanket,” below). This is as much a leverage position exposed to volatility as any other. And, fear here could cause the euro a lot of pain.

Ye olde BoE

In the annals of central bank history—at least before the Great Financial Crisis—the Bank of England was considered one of the most aggressive policy groups. It would change direction and tempo with rates far more readily than most of its counterparts. That badge of honor has faded significantly since the developed world ushered in its zero-rate policy, but the market is starting to recall some of the glory days as of late.

Since last July, we have seen an abrupt change in U.K. economic activity, rate expectations and the pound. Having avoided a triple-dip recession, the U.K. economy instead charged an impressive recovery and a new BoE Governor (Mark Carney) wrote off the need for further stimulus. As the situation progressed, optimism turned into hard-boiled rate speculation. Though the central bank repeatedly reiterated a time frame for returning to a tightening regime that was in line with what the Fed was projecting, the market believed their hand would be forced and a hike would be pursued earlier than promised.

Rate premiums have swelled substantially underneath the sterling, and traders are looking for some vindication for their positions. Feeling somewhat exposed, if data were to soften and justify the BoE’s original time frame or financial trouble distract them to more pressing issues, the bearish implications for the currency could be quite substantial.

Yen for stimulus and risk

One of the success stories of the forex market over the past few years is the incredible reversal from USD/JPY and the yen crosses. Rounding off of record lows, many thought the move was long overdue. However, the circumstances for its recovery may have put the currency and its pairings in a risky position for the future. There were two prominent themes that helped the yen crosses through the incredible 20% to 45% recovery experienced since the third quarter of 2012: the complacency of risk trends coupled with the appetite for yield and the Bank of Japan’s stimulus vows. The BoJ implemented a stimulus program that would eventually rival the Fed’s own massive program, and the depreciation factor on the currency was not missed. Traders jumped on the opportunity to front-run the manipulation. Yet, the capital inflow far outstripped the yield these trades have provided historically (see, “Who is carrying who?” below). Like all other over-exposed risk trades out there, the yen crosses are highly exposed to a risk unwind (see “Vulnerable correlations,” below).

The biggest complaint from traders over recent years was a lack of real fundamentals and the risk on/risk off world that led to sharp reversals. With various Western economies at different stages of recovery, there appears to be greater uncertainty as far as stimulus, which should provide currency traders plenty of opportunity in 2014. 

See the original article >>

Follow Us