Sunday, June 30, 2013

Stock Market SPX Kiss of Death

By: Anthony_Cherniawski

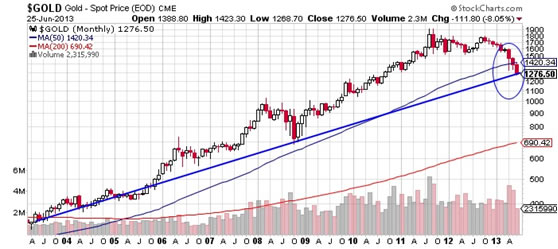
SPX made an irregular Wave [b] below support this morning with a retest of support-turned-resistance. A turn-down here is literally the “kiss of death” for the rally. In this case, we would not want to see SPX retesting the 50-day moving average, since it is still rising. However, the Short-term resistance and Lip of the Cup with Handle formation serve as a proxy.

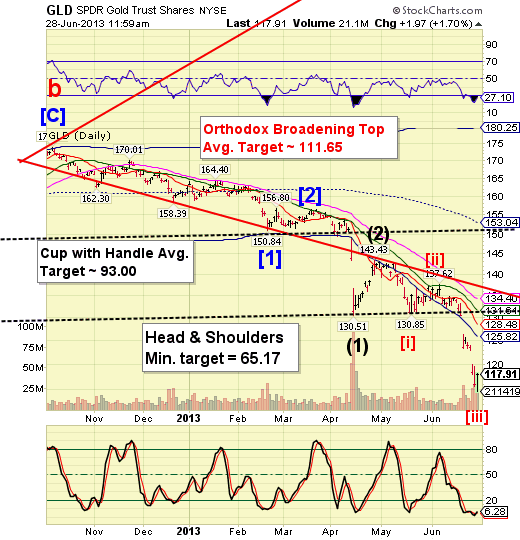
GLD may have completed its minute Wave [iii] at 114.65 this morning, although a corrective Wave (b) could still go to the Orthodox Broadening Top target. At the moment, I am satisfied that GLD has made its target, while gold came very near its target of 1155.00 this morning as well. The Cycles Model calls for a turn over the weekend, so this is a day early.

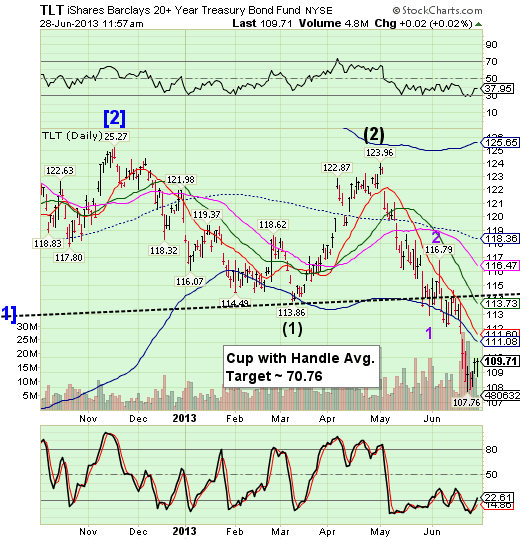
TLT has yet another decline left in its Wave structure that may allow it to go to 100.00 by the end of next week. This may indeed be the catalyst for an abrupt and severe decline in stocks at the same time. 30-year yields may approach 4.00%, which haven’t been seen since July 2011. Seeing a 20% drop in bond values in two months may give investors pause that the Fed is no langer in control.

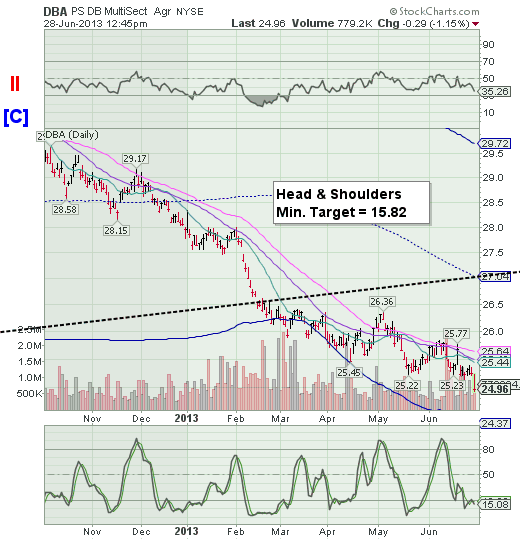
Agricultural commodities are starting the next major impulse down. This is yet another indication of deflation taking hold of our economic assets.

See the original article >>

Currency Positioning and Technical Outlook: Dollar Finishes Q2 on Firm Footing

by Marc to Market

The US dollar extended its advancing streak for the third consecutive week to close out the month and quarter. Federal Reserve officials have tried to clarify policy by noting that tapering is not tightening and the decision remains data dependent.

That may be fair and good, but it does not appear to have altered the calculation of investors. The US 10-year yield, for example, rose from 40 bp in response to FOMC statement, the updated forecasts and Bernanke's comments.  The assurance of the Fed officials saw the 10-year yield surrender about 20 bp, leaving the benchmark yield at still elevated levels, though other market segments have not corrected as much.

Yields rose more than the Federal Reserve expected.  Officials implicitly and often explicitly assumed that the market misunderstood what the Fed was trying to do.  Efforts to clarify could not return prices to status quo ante.  That would seem to suggest the Fed's hypothesis is wrong.  Rather than the market misunderstanding the Federal Reserve, it may be the Fed that misunderstood the markets.

Fed officials (and many observers) appear to be relying on some kind of fair value model of interest rates to deduce that the market has over-reacted.  However, there is another model, albeit less formal, that offers insight into the price action. It is not fair value, but internal market dynamics, such as positioning and liquidity, that explains the dramatic market response more than the discounting of net present value of some future expectation.  

Even if the fair valuation model is valid over the longer term, it seems perfectly reasonable and rational that in the shorter-term it is overwhelmed by position adjustments.  Sometimes, such is in the Treasury's Inflation Protected Securities (TIPS) and other thinner markets where the lack of liquidity and capacity on dealers balance sheets and internal risk limits can exaggerate the price action.   This has even become evident in the ETF space.   

Since the crisis began, there has been speculation about which country can normalize policy first.  Even taking on board the Fed's clarifications, the investment community now recognizes that the US is likely to be first, even if not immediately.  

Yes, the ECB's balance sheet is shrinking faster, as banks repay earlier borrowing from the ECB, which in part, reflects the lack of private sector demand for credit.  However, the risk remains that the ECB will have to do more, especially given that excess reserves are falling to levels that may not be consistent with near zero overnight rates and the tightening of monetary conditions caused by the sharp rise in interest rates. 

The new governor of the Bank of England was chosen to a large extent because he promises to deliver a more activist monetary policy.  The BOJ's massive QE program is not even three months old and has much room to run.  Should yields begin rising in Japan again, additional measures cannot be ruled out. 

As a consequence, the dollar's role as funding currency is being unwound and as this process unfolds, it takes a life on of its own. Recall that as recently as the June 17-19 period, the US dollar was at 4-month lows against the euro and sterling (which was also reflected in the Dollar-Index).  In the week ending June 18, the net speculative position in euro futures at the CME switched to long side for the first time since early March. 

Before the weekend, the Dollar Index set new highs for the move, while sterling and the Australian dollar recorded new lows.  The euro and Canadian dollar came within ticks of the lows set earlier in the week.  While there may be some consolidation ahead of the key events next week, which include several central bank meetings (RBA, Riksbank, BOE and ECB), the monthly PMIs and US employment data, the US dollar is likely to continue to strengthen.

The euro's attempt to recover in the second half of last week fizzled near $1.3100 and closed below the 200-day average (~$1.3075) for the third consecutive session.  This area will likely contain upticks.  We look for the euro to test the trend line drawn off the early April and mid-May lows.  It comes in near $1.2850 at the end of next week.   This translates into dollar gains into the CHF0.9540-70 area. 

Sterling finished the North American session lower for four consecutive sessions. The trend line drawn off the mid-March and late May lows comes in near $1.5080 at the end of next week and additional support is seen near $1.50.  Corrective bounces are likely to be capped in the $1.5285-$1.5320 band. 

The greenback appears to be breaking out to the upside from a wedge or pennant chart formation against the yen. The retracement objective we have discussed was near JPY100 and this still seems like the immediate target, but the pattern break suggests potential toward JPY102.

The technical tone of both the Canadian and Australian dollars is poor.  The US dollar held above the top of its previous range against the Canadian dollar on a closing basis over the past week.  It is found by connecting the early March and late May highs.  It comes in near CAD1.0450.  On the upside, the CAD1.06-CAD1.0650 is the next technical target. 

The key reversal that the Aussie posted at the start of last week failed to stick and the beaten up currency fell to new multi-year lows at the end of last week.  The next objective is $0.9000, while prior support near $0.9200 becomes resistance. 

The Mexican peso was best performing currency (major and emerging market) last week, gaining almost 2.7% against the US dollar. We continue to like the fundamental story in Mexico, and while the peso suffered during the initial position adjustment phase, the generally favorable macro story, including attractive interest rates and a reformist government, underpins the positive sentiment.     Support for the dollar is seen in the MXN12.88-MXN12.93 area.  Additional support is seen near MXN12.80.  

Observations of the speculative positioning in the CME currency futures:

1.   The past reporting period was largely characterized by the reduction of speculative positions than taking on new risk.  There were a few exceptions.  Gross long and short yen positions grew, though minimally.  Together they rose by less than 2.5k contracts.  Gross long Canadian dollar positions were extended, practically doubling to 27.2k contracts.  Gross short peso positions were grew by a minor 4k contracts.

2.  The other main characterization of the position adjustment was that it was largely minimal.  There were 8 of 14 gross positions were track that changed by 5k or less contracts.  There were 4 gross position adjustments that of above 10k contracts.  These include gross long and short sterling positions were cut, the gross long Canadian dollar position, as we noted, was increased, and the gross long peso position was pared. 

3.  There has been a dramatic clearing of positions in the peso.  It had been the largest gross long speculative currency futures position.  For most of the last several months, it has been the only currency futures we track that remained in which speculators remained net long.  The overcrowded positioning has now been alleviated.  The net long position was 121k contracts in late May.  At the end of the most recent reporting period it stood at 5k contracts. 

4.  Part of the sell-off in the euro since the reporting period ended likely reflects speculative longs liquidating. At the end of the last reporting period, the gross long euro position was more than twice the size of the gross long position in any of the other currency futures.

See the original article >>

The Week Ahead: Will the Rates Rally Fizzle Or Sizzle?

by Tom Aspray

Last week’s stock-market rally helped to erase the month’s sharp early losses, but probably made it more difficult for bondholders. The sharp drop in the last 15 minutes of trading on Friday did erase a good part of the week’s gains.

Importantly, mortgage rates jumped the most in over 26 years last week. While they are still at historically low levels, bondholders and the largest bond-fund managers remain nervous.

Last week started off with another jolt, as overnight lending rates in China spiked to well over 10% in an effort to clamp down on their hidden banking system. The chart reveals that this was a breakout from a yearlong trading range (line a).

chart
Click to Enlarge

This action was in response to the high-risk activity of some banks, in what some have referred to as a “Ponzi scheme.” So it was not surprising that the Shanghai Composite plunged back to the late 2012 lows (line a), as it was down over 15% in June.

Many of the top bond managers have had a rough month. Up through last Monday, Pimco’s $285.2 billion Total Return Bond Fund (PTTAX) was down 3.8% for the month. But quite a few other bond funds actually did worse. In May, $1.32 billion flowed out of Pimco’s flagship fund, and early reports suggest these outflows have tripled in June.

chart
Click to Enlarge

Pimco was not alone: in the week ending June 26, a staggering $23.3 billion was pulled out of a wide gamut of bond funds, including emerging market, mortgage backed, high yield and investment grade.

In a January 18 column, I warned not to buy the junk. Since then, the SPDR Barclays High-Yield Bond (JNK) is down 4.5%.

So what is a bondholder to do in this environment? The completion of the weekly reverse head-and-shoulders bottom formation in T-Bond yields at the end of May has an “upside target at 4%.” The yield is currently at 3.49%, but well below the week’s high.

The weekly yield chart below illustrates that from a technical perspective, yields have risen too far, too fast. Rates are still close to the weekly Starc+ band. This makes a pullback to the 3.29% to 3.40% area likely over the next several weeks. This target level is highlighted on the chart by the yellow box.

chart
Click to Enlarge

This view is also consistent with the analysis of T-Note Futures, which violated important support (line b) two weeks ago. The futures dropped well below their Starc- band last week, before firming late in the week.

T-Notes are likely to rebound or at least move sideways in the coming weeks. The OBV did break key support at line c, so a rebound is likely to be followed by a further decline in T- Note prices.

Therefore, the rally in yields looks ready to fizzle in the coming weeks…but then probabilities favor a resumption of the uptrend in yields and even lower bond prices. The 30-year T-bond yield may not reach its 4% target until next year.

It has been a rough month for many of the markets, with selling especially heavy in the past few weeks. Gold is down more than $180 per ounce, so is not surprising that gold is the worst-performing asset class for the year, down over 26%.

Stocks have clearly been the only place to be. The Spyder Trust (SPY) is still up over 12% for the year. Next to stocks, bonds are the second-best performer of the four asset classes. TLT is down 8.8%, while the emerging markets, as represented by Vanguard FTSE Emerging Markets (VWO) is down 12.9% so far in 2013.

chart
Click to Enlarge

If the US economy is going to get stronger as the year progresses, which is my view, then it would be surprising if all of the emerging-market economies got worse. The outflows in June from emerging markets (see chart) were the highest since January 2008.

The chart of VWO shows that it is testing its weekly Starc- band, with next important support in the $34 area (line a). The OBV has turned lower from resistance (line b) and has dropped below its WMA. I continue to think there will be some more opportunities in the emerging markets this year, as we did well with some of them in the first quarter.

Overall, the economic data was quite positive last week, and helped support the stock market. Early in the week, the Dallas Fed Manufacturing Survey beat expectations, as did numbers on durable goods, new home sales and consumer confidence. All show quite positive trends from a technical perspective.

The S&P Case-Shiller chart also shows a very strong uptrend. It previously gave a great sell signal in 2006 when it broke a 14-year uptrend.

The GDP was revised downward, and the Chicago PMI was lower than expected. Pending home sales remained strong, as did the University of Michigan’s Consumer Sentiment Index on Friday.

We will get a further look at manufacturing activity on Monday, with the PMI and ISM Manufacturing indexes. Also on Monday, we’ll see the latest data on construction spending, followed Tuesday by factory orders.

Just before the Fourth of July holiday, the ADP Employment Report and the ISM Non-Manufacturing Index will be released. And on Friday we get the monthly jobs report. Since the markets will be thin, the volatility may be quite high.

What to Watch
As I noted last week, the daily technical studies were negative. But the market was getting quite oversold, which made a rebound likely last week. The rally was quite impressive, and though prices just reached the expected upside targets, the internals did act better.

The daily studies improved to slightly positive after Thursday’s close, but as I tweeted before Friday’s opening, the market was ready for a pullback, or at least a pause.

It is now looking more likely that the lows from June 25 will hold. It will take a sharp down day with very negative market internals to reverse the improvement.

The seasonal pattern is a bit more positive for July and August, but then September is generally a problem.

The market did get oversold enough on the recent drop to support the resumption of the uptrend, as the number of NYSE stocks above their 50-day MAs dropped below 28 last week and has now risen to 40. In November 2012 it dropped below 22, and at the June lows was at 13 (see arrows below).

chart
Click to Enlarge

As expected, sentiment numbers did turn a bit less bullish last week. Only 30% of individual investors are bullish according to AAII, down from 37.4%. Still, only 35% are bearish, and it would be good to see these numbers at more extreme levels.

The number of bullish financial newsletter writers also dropped from 46.8% to 41.7%, but at 25%, the number of bears is still quite low.

The number of new NYSE 52-week lows spiked to 546, which was a new high for the correction. The number of stocks making new highs still shows a pattern of lower highs.

The daily chart of the NYSE Composite shows that the former uptrend (line a) was tested on last week’s rally, and it was not able to move above the 20-day EMA at 9,188. First support is in the 8,900 to 9,000 area, and the correction has held above the 38.2% Fibonacci support at 8,757.

chart
Click to Enlarge

The McClellan oscillator does show a pattern of higher highs (line b) and moved above the zero line late last week. As I discussed in last week’s Trading Lesson, this bullish divergence is consistent with a market low, but it needs to be confirmed by the A/D line.

The daily NYSE Advance/Decline line has moved back above its downtrend (line c) and its WMA. A pullback and then a move above last week’s high would complete the bottom formation. For July, the monthly pivot is at 9,143, with stronger resistance at 9,255 and then 9,412.

S&P 500
The daily chart of the Spyder Trust (SPY) shows a similar formation as the NYSE Composite, but the 20-day EMA, now at $161.75, was tested.

The July pivot is at $161.50, with further resistance at $162.90. The daily Starc+ band is at $164.18, and a close back above $166.04 would confirm that the correction is over.

The daily OBV was not impressive on the recent rally, as it appears to have stalled well below the declining WMA and the former uptrend (line f). It needs to overcome the resistance (line e) to turn positive.

The S&P 500 A/D line moved through resistance (line g), so the extent of any pullback will be important. The A/D line did form lower lows (line h), but acted stronger than prices.

chart
Click to Enlarge

Dow Industrials
The SPDR Diamond Trust (DIA) moved above its 20-day EMA last Thursday, and then Friday’s decline closed below it. There is further resistance at $150.94 and then at $153.10.

There is initial support at $147.80, followed by the converging support (lines a and b). More important levels surround the doji low of $145.17. DIA did trigger a HCD last Tuesday.

The daily Dow Industrials A/D line is testing resistance now, and a strong breakout would be a very positive sign. The uptrend in the A/D line was tested last week.

Nasdaq-100
The PowerShares QQQ Trust (QQQ) was hit the hardest after the Bernanke comments. The 38.2% support at $69.73 was violated all the way down to a low of $69.15, which was just below our stop. Then, the rebound stalled below the still-declining 20-day EMA at $71.85. The daily downtrend (line d) sits at $73.27.

The Nasdaq-100 A/D line just slightly broke its long-term uptrend (line g) before turning higher. The downtrend (line f) was broken on last week’s rally, which is a positive sign. The A/D line should hold above its WMA on a pullback.

There is initial support now at $70.65, and then further levels at $69.81.

See the original article >>

SPY Trends and Influencers June 29, 2013

by Greg Harmon

Last week’s review of the macro market indicators suggested, heading into the first week of summer, the markets were continuing to look weak. The week might start with a bounce though as they have run down pretty fast. It looked for Gold ($GLD) to consolidate or bounce before continuing the downtrend while Crude Oil ($USO) moved lower in the prior broad channel. The US Dollar Index ($UUP) looked ready to continue higher while US Treasuries ($TLT) continued lower. The Shanghai Composite ($SSEC) and Emerging Markets ($EEM) were biased to the downside with risk of the Emerging Markets consolidating first. Volatility ($VIX) looked to keep drifting higher keeping the bias lower for the equity index ETF’s $SPY, $IWM and $QQQ. Their charts were in agreement with the IWM noticeably stronger than both the SPY and QQQ.

The week played out with Gold consolidating for a nanosecond before resuming lower while Crude Oil found a bottom and held near the recent range. The US Dollar continued higher while Treasuries made new lower lows before a week ending bounce. The Shanghai Composite made new lows as well while Emerging Markets caught a bid and retraced some of the down move. Volatility pulled back all week as the Equity Index ETF’s bounced off of lower lows made on Monday. What does this mean for the coming week? Lets look at some charts.

As always you can see details of individual charts and more on my StockTwits feed and on chartly.)

SPY Daily, $SPY
spy d
SPY Weekly, $SPY
spy w

The SPY printed a Spinning Top candle Monday which was confirmed higher Tuesday, signalling the bottom was in. But the Doji Tuesday, small body candle Wednesday after a gap and then a Shooting Star doji Thursday suggested some weakness in the move. The Shooting Star was confirmed lower Friday, with a candle that filled the gap lower. All of this happened under the 20 and 50 day Simple Moving Average (SMA) cross on the daily chart with a Relative Strength Index (RSI) that is continuing to trend lower and is turning back at the mid line and a Moving Average Convergence Divergence indicator (MACD) that is trying to improve. So many small body candles leading to confusion. Out on the weekly chart price retested the wedge breakout and held moving higher. The RSI has pulled back with a MACD that is falling. The divergence on the weekly chart is a bit troubling as well. There is resistance higher at 161.60, 163 and 166.50. Support comes lower at 159.70 and 157.10 before 153.50. If it breaks below 153.50 the uptrend is broken. A move back over 166.50 reignites the bull trend. Continued Rise in the Pullback in the Uptrend.

Heading into the Holiday shortened week the Equity markets look tired in their bounce. Look for Gold to consolidate or bounce in its downtrend while Crude Oil is biased higher in the consolidation. The US Dollar Index looks strong and ready to continue higher while US Treasuries may continue their bounce in the downtrend. The Shanghai Composite and Emerging Markets both look to bounce in their downtrends. Volatility looks to remain subdued but drifting higher keeping the bias lower for the equity index ETF’s SPY, IWM and QQQ. Their charts all look to be tired in upward move within their intermediate downtrends in the long term uptrend. Use this information as you prepare for the coming week and trad’em well.

See the original article >>

The Rise and Fall of Great Powers

by Charles Hugh Smith

The very attempt to reform an unstable, diminishing-return system often precipitates its collapse.


Our collective interest in the rise and fall of empires is not academic. The meteoric rise of China and the financialization rotting out global capitalism are just two developments that suggest we are entering an era where some great powers will collapse, others will remake themselves and others will gain ascendancy.

In How Empires Fall (April 17, 2013), I discussed Adrian Goldsworthy's How Rome Fell: Death of a Superpower and an old favorite on the same topic, Michael Grant's excellentThe Fall of the Roman Empire.

Paul Kennedy's influential book from 1987, The Rise and Fall of the Great Powers, seeks generalizations about what causes the rise and decline of great powers, be they empires or nation-states.

Kennedy avoids the temptation to extract grand theories from history, quietly mocking Wallersteins's "world systems" and related analyses. In this he follows fellow historian Fernand Braudel, who also hesitated to draw overarching theories from the messy history of capitalism.

Kennedy proposes one mechanism that he claims does hold true over time: it's not the absolute wealth and power of any one nation or empire that matters, it's the economic growth rate of competitors and its wealth and power relative to theirs that matter. A nation whose economic base is growing at a lower rate than a competitor slowly become relatively weaker than its rival, even though its absolute wealth is still increasing.

He also notes a tendency for powers in relative decline (i.e. those growing less robustly than their neighbors/rivals) to spend more on military security as their position in the pecking order weakens. This diversion of national surplus to military spending further saps their economic vitality as funds are shifted from investment to unproductive military spending. This creates a feedback loop as lower investment weakens their economic base which then causes the leadership to respond to this weakening power with more military spending.

This feedback creates lags, where an economically weakening power may actually increase its military power, until the overtaxed economy implodes under the weight of the high military spending.

This dynamic certainly seems visible in the history of the Soviet Union, which at the time of this book's publication in 1987 was unanimously considered an enduring superpower with a military that many believed could conquer Western Europe with its conventional forces.

This debate over the relative superiority of Soviet arms now seems quaint in the light of the collapse of the USSR a mere four years later, but it worth recalling that one of the most influential defense-doctrine books of the early 1980s was The The Third World War: August 1985 a novel by Sir John Hackett, about a fictional Soviet attack on Western Europe in 1985.

It was widely recognized by the late 1980s that the Soviets' relative power was in decline compared to the U.S., as the U.S. had worked its way through the malaise and restructuring of the 1970s and re-entered an era of strong economic and technological growth in the 1980s, rapidly outpacing the sclerotic Soviet economy.

It's also worth recalling the truly dismal status of the Soviet and Eastern Bloc economies compared to the Western economies: common inexpensive consumer items such as kitchen toasters were rare luxuries. In other words, while the Soviet economy was probably still expanding in the 1980s, the rate and quality of its expansion was considerably less than the growth of the West.

If one economy grows by 1% a year and another grows by 5% a year, in a mere decade the faster-growth economy will have expanded by more than 62%, while its slower-growing rival's economy grew only 10.5%.

Many observers (especially on the Left, where suspicion of military spending is never far below the surface) see the U.S. as following this same path to decline and fall, as post-9/11 defense spending has skyrocketed while growth has stagnated. Despite what I see as wasteful spending on overlapping intelligence agencies and insanely costly programs like the F-35 fighter, U.S. defense spending remains around 5% of GDP (Pentagon/National Security budget is around $690 billion, GDP is around $15 trillion).

Though statistics from the Soviet era are not entirely reliable, various scholars have estimated that fully 40% of the Soviet GDP was being expended on its military and military-industrial complex.

During the height of the Reagan buildup, the U.S. was spending about 6% of its GDP on direct military expenditures. If you include the Security State (CIA, NSA, et al.), the Veterans Administration and other military-related programs (DARPA, etc.), the cost was still less than 10% of GDP.

How about America's position relative to other Great Powers or alliances? Interestingly, America's decline has been noted (and predicted) since the 1970s. Other nations such as Japan were growing much faster and were expected to overtake the U.S., based on the extrapolation of high growth rates into the future.

Once again the same predictions are being made, only this time it is China that is logging high annual growth rates that are being projected far into the future. The more things change, the more they remain the same.

Kennedy ends his book with a brief chapter looking ahead from 1987. He is careful not to make any outright predictions, but it is fair to say that he completely missed the bursting of Japan's miraculous high growth economy and the implosion of the Soviet Union a mere four years later in 1991. With the benefit of hindsight, we can discern the dynamics that led to these abrupt declines of relative power. But at the time, Japan's economy was universally regarded as superior to the U.S. economy and the USSR was widely viewed as a permanent superpower rival to the U.S.

How can we be so wrong about projecting present trends when we have so much data at our disposal? Why can't we identify the trends that end up mattering? Reading political-economic history books written a few decades ago reinforces our humility: we cannot predict the future, except to say that projecting present trends leads to false predictions.

Virtually no one in 1987 foresaw the limited Internet of the time exploding into a globally dominant technology, yet a mere decade later the web browser, cheaper memory, faster processors and broadband cable and DSL launched a digital revolution.

In 1987, pundits were predicting that Japan's "5th generation" computing would soon dominate what was left of America's technological edge. They were spectacularly wrong, as the 5th generation fizzled and Japan became an also-ran in web technology, a position it still holds despite its many global electronic corporations and vast university research system.

Japan's modern economy was set up in the late 1940s and early 1950s to exploit the world of that time. Sixty years later, Japan is still a wealthy nation, but its relative wealth and power have declined for 20 years, as its political-financial power structure clings to a model that worked splendidly for 40 years but has not worked effectively for 20 years.

The decline is not just the result of debt and political sclerosis; Japan's vaunted electronics industry has been superseded by rivals in the U.S. and Korea. It is astonishing that there are virtually no Japanese brand smart phones with global sales, and only marginal Japanese-brand sales in the PC/notebook/tablet markets.

The key dynamic here is once the low-hanging fruit have all been plucked, it becomes much more difficult to achieve high growth rates. That cycle is speeding up, it seems; western nations took 100 years to rapidly industrialize and then slip into failed models of stagnation; Japan took only 40 years to cycle through to stagnation, and now China has picked the low-hanging fruit and reverted to financialization, diminishing returns and rapidly rising debt after a mere 30 years of rapid growth.

There is certainly evidence that China's leadership knows deep reform is necessary but the incentives to take that risk are low. Perhaps that is a key dynamic in this cycle of rapid growth leading to stagnation: the leadership, like everyone else, cannot quite believe the model no longer works. There are huge risks to reform, while staying the course seems to offer the hope of a renewal of past growth rates. But alas, the low hanging fruit have all been picked long ago, and as a result the leadership pursues the apparently lower-risk strategy that I call "doing more of what has failed spectacularly."


Though none of the historians listed above mention it, there is another dangerous dynamic in any systemic reform: the very attempt to reform an unstable, diminishing-return system often precipitates its collapse. The leadership recognizes the need for systemic reform, but changing anything causes the house of cards to collapse in a heap. This seems to describe the endgame in the USSR, where Gorbachev's relatively modest reforms unraveled the entire empire.

Director Michael Apted has been filming a remarkable series of documentaries following the lives of 14 English people since the age of 7: The Up Series (Wikipedia) is a series of documentary films produced by Granada Television that have followed the lives of fourteen British children since 1964.(The titles: 7 Up, 14 Up, and so on, the latest being 56 Up.) The Up Series, eight films (Seven Up - 56 Up)

We expect those children with few advantages in life (i.e. lower-class) to do less well than those with many advantages, and this linear expectation is fulfilled in some cases. (This is the expectation of the working-class children themselves.)

But in most cases, the individuals' lives are entirely non-linear: some decades they do less well, in others they do much better, and the dynamics that arise and dominate each stretch of their lives are not very predictable.

This series reinforces our humility about predicting the life paths of individuals.

So is there a unifying theme here? I would say yes, and it is embodied in this quote from Charles Darwin, co-founder of our understanding of natural selection and evolution: "It is not the strongest of the species that survives, nor the most intelligent, but the ones most adaptable to change."
This essay is excerpted from Musings Report 16. The Musings Reports are basically a glimpse into my notebook, the unfiltered swamp where I organize future themes, sort through the dozens of stories and links submitted by readers, refine my own research and start connecting dots which appear later in the blog or in my books.


The Musings Report includes an essay and three other sections: Market Musings, on the financial markets and trading, The Best Thing That Happened This Week and From Left Field.


If you'd like to receive the weekly Musings Reports, please subscribe ($5/month) via the links in the right sidebar or send $50 (the annual one-payment subscription fee) via the PayPal link.

See the original article >>

Gold and Silver Ground Floor Investor Opportunity In Next Super-Cycle?

By: Jeb_Handwerger

The gold (GDX) and silver (SIL) miners have been hammered down to historic 1999 lows, while the U.S. banks (XLF) and U.S. dollar (UUP) reach new heights.  This is a great opportunity for value investors to enter the mining sector at possibly the ground floor of a commodity supercycle. 
Many amateur investors may be prematurely assuming that all is well with the global economic picture.  The fine tuning of the economy by the Central Banks and specifically Ben Bernanke appears to have been a major success to the masses.  On the other hand, astute investors who have learned from history and are aware of the financial risks stemming from currency devaluation.  Could this really be an illusion?  Could the dollar be on the verge of a collapse?  Is The Fed losing control of interest rates that could spike higher? 


Gold (GLD) is undergoing a significant correction after making a huge run from the 2008 low below $800 to $1900 in August of 2011.  Gold is significantly below its 3 year trailing average at $1550 and its 5 year trailing average at $1327.  The last time this occurred was in the late 90’s.  Investors who acquired gold back then saw incredible 660% gains while the equity markets did nothing over the next 15 years.  A similar opportunity could be occurring right now in precious metals and the junior miners (GDXJ).
Long term investors are increasing realizing that this is a historic buying opportunity for natural resources and mining stocks.  We are near thirty year trough in the value of miners.  Commodities are cheap, interest rates are historically low and the U.S. housing, greenback and equity markets are near all time highs.  It seems that many of us, underestimated the powers of the Central Banks on the free markets to manufacture a recovery while suppressing commodity prices for the short term.  However, astute long term value investors realize that this is the time to acquire real assets for pennies on the dollar.  Every action has an equal and opposite reaction.  Eventually, contrarian value investors will be rewarded. 
Don’t get confused by the Fed’s bafflegab.  One week, Bernanke testifies in Washington saying easy money policies must continue to prop up a weak economy or else we could face a significant threat to this recovery.  The markets rally.  The next week, he says he may taper by 2014.  The markets fall.  The Fed appears to be micro-managing the markets as they fear a loss of control. 
Bernanke may have wanted to take a little froth off of the equity markets and prevent oil breaking the $100 mark.  Precious metals are now completely out of favor, which allows Central Bankers to continue devaluing the dollar.  Not allowing the free markets to balance itself out and these constant policy interventions could lead to unknown long term economic consequences.  Eventually, investors could lose confidence in paper assets and get “fed” up with potential devaluation.  Remember fiat currencies over the long term end up worthless as a form of money. Only precious metals have withstood the test of time.  Gold bulls know that time is on our side over the long run and the sector continues to get cheaper in the short term moving to historic discount valuations.
Remember Bernanke is on his way out and Obama is probably looking for an even more dovish successor.  Bernanke will be known for unleashing quantitative easing to boost housing and equities.  The turn for commodities after this two and a half year decline could be right around the corner. 
U.S. housing is now hitting multi-year highs.  Many homeowners destroyed their credit by walking away from their homes and capitulated near the lows four years ago.  We have witnessed a major “V” reversal in the housing and financial sector where the real losers were the ones who did not have patience and sold.  Learn from their mistakes in the resource sector, smart money picked up housing assets for pennies on the dollar back then, while the lemmings walked away from their homes and destroyed their credit.  It may be happening right now in the oversold resource sector.  Four years from now we could see exponential gains in the sectors which the masses are ignoring right now.  Remember most investors chase the latest fad and ignore a crucial rule in the market.  What was the worst performers were over the past two years could be the best performers over the next two.
Right now, we are witnessing a shakeout in the mining sector and precious metals. The losers will be those who capitulate (much like the homeowners who foreclosed) and sell their shares to the smart money, which is now entering the precious metals and commodities sector.  Insider buying and major strategic investments by smart money is increasing.
Now the buzzword in the media is tapering.  A few months ago it was fiscal cliff.  Tapering means to decrease gradually.  The Bankers actually are doing the opposite and are increasing money supply rapidly to the tune of $85 billion a month.  Our foreign debts have reached historic levels.  As interest rates rise from this purported exit, The Central Bank may do a 180 degree turn and continue to print dollars rapidly to pay down increasing debt payment and keep pace with other devaluing currencies like the Yen.
Silver is below its 5 year trailing average in the high teens and gold is breaking below it 5  year trailing average.  We are reaching 2008 and 2001 levels for both silver and gold miners.  At these oversold levels in the past the miners were able to reverse and make exceptional gains.

We should begin seeing some powerful bullish reversals in the junior miners as value investors continue to enter the sector.  It increasingly appears that we are near a potential secular bottom.
Don’t be manipulated by the mainstream press scaring you with headlines about the economic troubles in China or that mining is dead.  Negative people may tell you that the financing markets have dried up.  That is not true.
Already we have seen major increases of Chinese investment in energy, potash and precious metals.   This may be indicating that some of the smartest minds are taking advantage of this discount sale in the miners and are using the media to their advantage.  Be careful of all the bearish headlines on the miners and follow the money.  There is capital for the right mining projects in stable jurisdictions.  Real assets and commodities are historically the greatest hedges against inflation risk and monetary debasement.
Look to the companies that are attracting serious capital and institutional support.  Major value funds have been buying gold mining stocks over the past few months as the precious metal funds face redemptions.  This is characteristic of market bottoms.  Value funds are continuing to buy in one of the most difficult junior mining markets.
Over $11 million was raised this past week for quality Yukon junior miners, which are being completely ignored by the public. This shows strong support for higher precious metal prices.
Investors should look for platinum and palladium projects in safe jurisdictions as the fundamentals are extremely strong with rising industrial demand for these catalysts and declining supply from South Africa.  This supply demand imbalance should impact the price over the long term.
Look for location and the major partners. Watch the uranium space which is gaining a lot of attention as the Russia-US “Megatons to Megawatts” Program expires at the end of 2013.  Remember the U.S. produces around 4 million of the 55 million pounds consumed annually and has depended on these secondary supplies.  Japan is set to turn back on nuclear reactors this summer.  China is building new reactors.
The uranium price appears to be making a double bottom.  Remember the U.S. produces around 4 million of the 55 million pounds consumed annually.    It should be noted smart money is entering the sector in addition to Microsoft’s Bill Gates.  Warren Buffet’s Berkshire Hathaway took a stake in Chicago Bridge and Iron, which recently took over the Shaw Group, a nuclear services provider.  Could Buffett be signaling an opportunity in the undervalued uranium sector?
Keep a close eye on the near term uranium producers the United States.    Cameco just started additional production at their North Butte ISR mine.  Mark my words the Powder River Basin in Wyoming is a strategic area for the future of uranium production in the United States.
Obama just announced a major initiative to fight carbon emissions.  Countries around the world are also fighting air pollution.  The world we live in today is looking to reduce air emissions and the carbon footprint.  Uranium and rare earths are critical metals for that goal.  
In conclusion, turn off the negative news that is broadcasted to misdirect and confuse investors.  Follow the capital to quality situations, which are building value during challenging times and continuing to communicate to shareholders.  It is during these difficult times in the resource sector when the greatest opportunities are discovered.  Remember American Barrick Resources started off as a 16,000 ounce gold producer in the 80′s down market in gold and grew to be Barrick Gold Corp, the largest gold producer in the world.

See the original article >>

Weighing the Week Ahead: What do higher interest rates mean for stocks?

by Jeff Miller

Last week I suggested that the market might need to "digest" the FOMC announcement. Wow, was I right! This continues a pretty good streak of predicting the main theme for the coming week.

I really struggled with last week's forecast since I absolutely hate the idea of a delayed reaction. In general, I do not like such explanations, and sharp readers could easily find my own words on this subject. We got a lot more than digestion. It was a full-fledged hissy fit. Since the issue has not been settled, the debate continues.

We have a rather strange week ahead – plenty of data, an ongoing debate about the Fed, and a mid-week holiday that usually sends market participants on vacation by Tuesday, if not for the full week.

I predict that the market focus will be on the new higher interest rate environment, especially the question of the implication for stocks and overall asset allocation.

Last Week's Battle Lines

There was so much written and spoken. As usual, my weekly summary can only hit the high spots. I am going to identify three perspectives:

  1. The Fed. There were many speeches and all had the same theme: The markets misinterpreted, over-reacted, and were basically just wrong! The New York Times used this language to describe a speech by NY Fed President William C. Dudley, but much the same could be said about the more hawkish Dallas Fed President Richard Fisher's reference to "feral hogs." CNBC's colorful commentator Jim Cramer did the typical trader extrapolation saying that the "word went out" and that everyone was on message, even including Sports Center!
  2. The Traders. The story from these sources was that the Fed was clueless and did not understand markets. This viewpoint was repeatedly expressed by Santelli and friends, mostly in the typical notion that having an advanced degree in economics proves that you are dumb and disqualifies you from making policy decisionsJ Instead, let us cite the more measured commentary from Vince Foster at Minyanville. He describes the effect on the Eurodollar market. I suspect that few academics and almost no individual investors even know what this market represents (confusing it with the currency), and despite the importance and size.
  3. The Academics. There is an honest and extensive effort to evaluate the effect of Fed policy and the market reaction. With many, many posts in the debate, I need to focus on just one. Scott Sumner has had more effect on economic thinking and Fed policy than most realize. He wisely notes other influences on interest rates – not just the Fed. Read his "Orient Express" post and follow the links if you want to understand the academic perspective.

What should we make of this? The disagreements are sharp and no clear resolution seems possible. As one who has moved comfortably among top government officials, traders, and academics I have an unusual perspective. It deserves a thoughtful response, and I am working on that. Meanwhile, I'll provide some thoughts in the conclusion.  First, let us do our regular update of last week's news and data.

Background on "Weighing the Week Ahead"
There are many good lists of upcoming events.  One source I regularly follow is the weekly calendar from Investing.com. For best results you need to select the date range from the calendar displayed on the site. You will be rewarded with a comprehensive list of data and events from all over the world. It takes a little practice, but it is worth it.

In contrast, I highlight a smaller group of events.  My theme is an expert guess about what we will be watching on TV and reading in the mainstream media.  It is a focus on what I think is important for my trading and client portfolios. Each week I consider the upcoming calendar and the current market, predicting the main theme we should expect. This step is an important part of my trading preparation and planning. It takes more hours than you can imagine.

My record is pretty good. If you review the list of titles it looks like a history of market concerns. Wrong! The thing to note is that I highlighted each topic the week before it grabbed the attention. I find it useful to reflect on the key theme for the week ahead, and I hope you will as well.

This is unlike my other articles at "A Dash" where I develop a focused, logical argument with supporting data on a single theme. Here I am simply sharing my conclusions. Sometimes these are topics that I have already written about, and others are on my agenda. I am putting the news in context.
Readers often disagree with my conclusions. Do not be bashful. Join in and comment about what we should expect in the days ahead. This weekly piece emphasizes my opinions about what is really important and how to put the news in context. I have had great success with my approach, but feel free to disagree. That is what makes a market!

Last Week's Data

Each week I break down events into good and bad. Often there is "ugly" and on rare occasion something really good. My working definition of "good" has two components:

  1. The news is market-friendly. Our personal policy preferences are not relevant for this test. And especially -- no politics.
  2. It is better than expectations.

The Good

This was a very good week for economic data, despite the market reaction.

  • The Senate approved the immigration bill with a solid bipartisan vote (68-32). It is now up to the House. Most average voters do not understand the economics of this issue including both competition for jobs, tax payments, and government spending. We shall see.
  • Durable goods increased at a solid 3.6% pace.
  • Earnings per share move higher despite flat total earnings (and cash flow) growth. Ed Yardeni explains as follows:

    "…(A)lthough corporate cash flow has flattened along with corporate profits, it's done so at a record high. There is plenty of it to drive stock prices higher. For the S&P 500, the sum of buybacks and dividends totaled $702 billion over the past four quarters through Q1-2013. Since the start of the bull market during Q1-2009, the sum total is a staggering $2.3 trillion."

    He also notes that corporate buybacks seem to be less than announced or modeled – something to watch.

    Yardeni Earnings Total vs Per Share

  • Pending home sales were strong, 12.5% higher y-o-y and accelerating. (See Steven Hansen's analysis at GEI).
  • Personal income was up strongly at 0.5%. Calculated Risk has a good story with charts.
  • Michigan sentiment was solid. This was a final reading for June and a touch below May's final. I am scoring it as "good" because there has been a lot of variation from preliminary to final and the 84 range is important, as you can see from Doug Short (who shows GDP and recessions as well as the long-term series:

Dshort UM sentiment

The Bad

There was very little bad news.  Feel free to add in the comments anything you think I missed!

  • Q1 GDP? El stinko! With the second quarter about to end, there was little market interest in this final revision, just as I suggested in last week's preview. The very weak commentary from CNBC's floor analyst, struggling to explain the market rally, was that the weak number showed that the Fed would act more strongly. It is amazing that anyone would even think the Fed might be influenced by this. It does provide a historical record, where it is important to note the impact of reduced government spending. People seem to have difficulty in detaching their politics from the data. If you want to reduce government spending, there is an economic effect. That is why we have a national debate about priorities. Wisconsin Prof. Menzie Chinn has a typically thorough analysis. Here is a key chart:

Fiscdrag2

  • Mortgage rates spiked higher. Calculated Risk shows the impact on refinancing activity.

MortgageRatesRefiJune

  • Chicago PMI disappointed at a 51.6 reading. Bad news for next week's ISM report? 
  • China – a continuing worry about growth, but the data are difficult to interpret.

The Ugly

The failing search for safety was the clear winner of last week's "ugly" award.

Abnormal Returns has a powerful analysis of the "risk parity" ideas. These funds were supposed to provide protection against big losses, even when interest rates increase, by asset allocations to offsetting ideas. The funds represent the best efforts of some very smart managers. Tadas explains as follows:

"In light of this relative underperformance a good old fashioned balanced portfolio looks good. One of the key tenets of risk parity and most other asset allocation strategies is diversification. While a 60/40 portfolio is no slouch one can easily argue that additional diversification, including the rebalancing opportunities they represent, can add value over time. Diversification is no panacea as this month as shown but it hard to argue what the alternative may be."

Here is the featured chart from Tom Brakke:

13-0624-risk-disparity1-730x395

We can now add the "all weather" funds to the list of failed "safe investments," a theme I have been warning about for many weeks.

Getting some safe yield requires a path that is less traveled. Volatility increases call premiums and the "modest dividend" stocks do not have the same overvaluation as the Grandma names. Looking for enhanced yield is something you can do at home if you have a little wisdom, courage, and patience, as I suggested here.

The Indicator Snapshot

It is important to keep the current news in perspective. I am always searching for the best indicators for our weekly snapshot. I make changes when the evidence warrants. At the moment, my weekly snapshot includes these important summary indicators:

  • For financial risk, the St. Louis Financial Stress Index.
  • An updated analysis of recession probability from key sources.
  • For market trends, the key measures from our "Felix" ETF model.

Financial Risk

The SLFSI reports with a one-week lag. This means that the reported values do not include last week's market action. The SLFSI has recently edged a bit higher, reflecting increased market volatility. It remains at historically low levels, well out of the trigger range of my pre-determined risk alarm. This is an excellent tool for managing risk objectively, and it has suggested the need for more caution. Before implementing this indicator our team did extensive research, discovering a "warning range" that deserves respect. We identified a reading of 1.1 or higher as a place to consider reducing positions.

The SLFSI is not a market-timing tool, since it does not attempt to predict how people will interpret events.  It uses data, mostly from credit markets, to reach an objective risk assessment.  The biggest profits come from going all-in when risk is high on this indicator, but so do the biggest losses.

Recession Odds

I feature the C-Score, a weekly interpretation of the best recession indicator I found, Bob Dieli's "aggregate spread."  I have now added a series of videos, where Dr. Dieli explains the rationale for his indicator and how it applied in each recession since the 50's.  I have organized this so that you can pick a particular recession and see the discussion for that case.  Those who are skeptics about the method should start by reviewing the video for that recession.  Anyone who spends some time with this will learn a great deal about the history of recessions from a veteran observer.

I have promised another installment on how I use Bob's information to improve investing.  I hope to have that soon.  Meanwhile, anyone watching the videos will quickly learn that the aggregate spread (and the C Score) provides an early warning.  Bob also has a collection of coincident indicators and is always questioning his own methods.

I also feature RecessionAlert, which combines a variety of different methods, including the ECRI, in developing a Super Index.  They offer a free sample report.  Anyone following them over the last year would have had useful and profitable guidance on the economy.  RecessionAlert has developed a comprehensive package of economic forecasting and market indicators, well worth your consideration. Dwaine's leading indicators are currently showing some weaker readings, as you can see here.

Georg Vrba's four-input recession indicator is also benign. "Based on the historic patterns of the unemployment rate indicators prior to recessions one can reasonably conclude that the U.S. economy is not likely to go into recession anytime soon." Georg has other excellent indicators for stocks, bonds, and precious metals at iMarketSignals.

Unfortunately, and despite the inaccuracy of their forecast, the mainstream media features the ECRI. Doug Short has excellent continuing coverageof the ECRI recession prediction, now over 18 months old.  Doug updates all of the official indicators used by the NBER and also has a helpful list of articles about recession forecasting.  His latest comment points out that the public data series has not been helpful or consistent with the announced ECRI posture.  Doug also continues to refresh the best chart update of the major indicators used by the NBER in recession dating.

The average investor has lost track of this long ago, and that is unfortunate.  The original ECRI claim and the supporting public data was expensive for many.  The reason that I track this weekly, emphasizing the best methods, is that it is important for corporate earnings and for stock prices.  It has been worth the effort for me, and for anyone reading each week.

Readers might also want to review my Recession Resource Page, which explains many of the concepts people get wrong.

Our "Felix" model is the basis for our "official" vote in the weekly Ticker Sense Blogger Sentiment Poll. We have a long public record for these positions.  A few weeks ago we switched to a neutral position. It was a close call at the time and has remained so for the last month. This week we are switching to a bearish vote. The inverse ETFs have further strengthened in the ratings, but remain in the penalty box. These are one-month forecasts for the poll, but Felix has a three-week horizon.  The penalty box percentage measures our confidence in the forecast.  A high rating means that most ETFs are in the penalty box, so we have less confidence in the overall ratings.  That measure remains elevated, so we have less confidence in short-term trading.

[For more on the penalty box see this article. For more on the system ratings, you can write to etf at newarc dot com for our free report package or to be added to the (free) weekly ETF email list.  You can also write personally to me with questions or comments, and I'll do my best to answer.]

The Week Ahead

This week brings plenty of data despite the holiday-shortened week.

The "A List" includes the following:

  • The employment report (F). This is always given the most market attention, and the Fed emphasis can only increase that.
  • Initial jobless claims (Th).   The most timely and responsive employment indicator.
  • ISM index (M). Widely followed as an important concurrent indicator of manufacturing.

The "B List" includes the following:

  • ADP private employment (W). I view this as an important independent employment measure.
  • ISM services index (W). Less historical data than manufacturing but a growing part of the economy.
  • Construction spending (M). May data, but interesting given the importance of growth in construction.
  • Trade balance (W). Interesting both for overall economic health and as a component of GDP.
  • Factory Orders (T). May data.

NY Fed President Dudley speaks on Tuesday. Markets around the world have various vacation days. Were it not for Employment Friday I would expect a really slow week beginning Wednesday morning. Even so, we may have the "B Teams" on duty for Friday morning trading with things getting quiet swiftly after the opening. It could provide a good opportunity for those of us at work!

How to Use the Weekly Data Updates

In the WTWA series I try to share what I am thinking as I prepare for the coming week. I write each post as if I were speaking directly to one of my clients. Each client is different, so I have five different programs ranging from very conservative bond ladders to very aggressive trading programs. It is not a "one size fits all" approach.

To get the maximum benefit from my updates you need to have a self-assessment of your objectives. Are you most interested in preserving wealth? Or like most of us, do you still need to create wealth? How much risk is right for your temperament and circumstances?

My weekly insights often suggest a different course of action depending upon your objectives and time frames. They also accurately describe what I am doing in the programs I manage.

Insight for Traders

Felix has moved (marginally) to a bearish posture, but this is not yet reflected in trading accounts which have no positions. The overall ratings are slightly negative, and we might purchase one or more inverse index funds in the coming week. While it is a three-week forecast, we update the model every day and trade accordingly. It is fair to say that Felix remains cautious about the next few weeks. Felix did well to avoid the premature correction calls that have been prevalent since the first few days of 2013, accompanied by various slogans and omens. I should also note that the last time we anticipated the purchase of inverse funds, the market stabilized and the inverse funds never emerged from the penalty box. The bearish tilt is marginal.

Insight for Investors

This is a time both of danger and of opportunity for investors. The changes are not just about markets in general, but a shift in what is safe and what is not. My recent themes are still quite valid. If you have not followed the links, find a little time to give yourself a checkup. You can follow the steps below:

  • What NOT to do

Let us start with the most dangerous investments, especially those traditionally regarded as safe. Interest rates have been falling for so long that investors in fixed income are accustomed to collecting both yield and capital appreciation. An increase in interest rates will prove very costly for these investments. It has already started. Check out Georg Vrba's bond model, which continues to signal the risk.

  • Find a safer source of yield: Take what the market is giving you!

For the conservative investor, you can buy stocks with a reasonable yield, attractive valuation, and a strong balance sheet. You can then sell near-term calls against your position and target returns close to 10%. The risk is far lower than for a general stock portfolio. This strategy has worked well for over two years and continues to do so. I have had a number of questions about this suggestion, so I wrote an update last week. That post provides background as well as concrete examples showing how you can try this strategy yourself.

  • Balance risk and reward

There is always risk. Investors often see a distorted balance of upside and downside, focusing too much on news events and not enough on earnings and value. You need to understand and accept normal market volatility, as I explain in this post: Should Investors be Scared Witless?

  • Get Started

Too many long-term investors try to go all-in or all-out, thinking they can time the market. There is no reason for these extremes. While last week was a tough one for traders. Most were surprised by the market reaction to more FedSpeak. Our Felix model was safely on the sidelines.

For investors it was a different story. If you had your shopping list, there were good opportunities to buy stocks. For those following our enhanced yield approach you had both the chance to set new positions and to sell calls against old ones.

And finally, we have collected some of our recent recommendations in a new investor resource page -- a starting point for the long-term investor.  (Comments and suggestions welcome.  I am trying to be helpful and I love feedback).

Final Thought

My friends from the various competing groups are all very intelligent and experts at what they do. A policy maker has a long-term time frame and a viewpoint of avoiding imminent disaster. A trader, of necessity, translates any information into a simple rule. Doing otherwise can mean "blowing out." My academic friends develop data and evidence that stands up to peer review, but may not fit the relevance of the market.

At the moment, I think that all of these groups are correct. The Fed has accurately identified the actual economic effects of the QE policy – pretty minimal. The traders have exaggerated the Fed effects through rules like "don't fight the Fed," the Bernanke put, POMO, and the like. Perception becomes reality. Academics refuse to engage with the pop economists, which makes their work much less relevant than it could be. At least they are trying.

There are a few very savvy fund managers who understand what is going on. They know that higher interest rates are actually a sign of economic and market health. Barron's finally hit this theme in the current issue, and I predict that you will see it much more frequently in the weeks ahead. Take a few minutes to watch the advice of these three great interviews. It will be time well spent, explaining how stocks can thrive as interest rates rise.

For my own take, I find it helpful to think about a likely destination for the economy and financial markets. This is helpful in avoiding excessive focus on any single variable in a world where so many things are correlated. I expect the economy to improve, interest rates to move higher (starting with the long end), PE ratios to increase (as is usually the case when rates go to 4% or so), profit margins to decrease somewhat, and the U.S. deficit to decrease. This climate will be very negative for some stocks and sectors and very positive for others. (I provide more detail here.)

A key element is to avoid the fixation on the Fed. The idea that the Fed determines long-term interest rates is rapidly being proven wrong. James Hamilton shows (It's not just the Fed) that interest rates actually increased after the announcement of both QE2 and QE3. He writes, "It's worth emphasizing that the recent rise in interest rates has been a global phenomenon, not just something seen in the United States."

I have demonstrated that Fed buying is only 1% of daily trading in the cash markets. Nearly everyone confuses net new issuance of debt, total new issuance, and the float. This is a big mistake, and it can be a costly one.

And Finally

If you read one thing this week it should be Josh Brown's message about individual investors and market timing. You really need to read the entire post (and you should join me in reading everything else from Josh as well). Here is the key chart, showing the effect of investor attempts at market timing:

401k-trends-chart-1

Josh gets our highest accolade: We turn off the mute button and TIVO back when we see him on TV!

See the original article >>
New threats to China's property bubble

by SoberLook

In late 2011 many were expecting China's property bubble to burst. It looked as though housing prices had peaked and signs of stress were beginning to appear (see discussion). But the correction turned out to be quite shallow and in spite of China's government's multiple attempts to arrest housing price appreciation (and partially succeeding - see post), house prices went on rising.

Source: JPMorgan

With real rates on deposits remaining in negative territory for years, there were few places to turn for wealthy savers. Property became one of the primary vehicles to put away excess cash to escape inflationary pressures. Moreover, municipal governments made large sums of money selling land to developers, while banks ("encouraged" by municipalities) have been happily lending. And in many cases lenders and developers have set up arrangements that are a bit closer than "arms length" (see discussion). Except for ordinary families who got shut out of the housing markets, everyone benefited from this rally.
Housing investment as percentage of GDP has been growing unabated, and in recent years started approaching levels that other nations experienced at the height of their property bubbles.

Source: Credit Suisse

Now, based on the house price to wage ratio compiled by the IMF, China's large cities have the most expensive real estate in the world. Beijing is particularly expensive, as party officials deploy their "hard-earned" cash.

Source: Credit Suisse

And while Western economists debate if China's property market is truly a bubble, major Chinese developers are openly admitting it.

South China Morning Post: - China Vanke [one of the largest developers in China] chairman Wang Shi said the mainland's property market faces the risk of a "bubble", reiterating concerns the developer raised three months ago.
The bubble is not "light", Wang said at a conference in Shanghai yesterday. "If the bubble lasts, it will be dangerous."
Home prices have been increasing even as the government in March stepped up a three-year campaign to cool the market.
The measures have included raising down-payment and mortgage requirements, imposing a property tax for the first time in Shanghai and Chongqing, and enacting purchase restrictions in about 40 cities. New home prices jumped 6.9 per cent in May, the most since they reversed declines in December, SouFun Holdings, the mainland's biggest real estate website owner, said.
But bubbles can last for a long time. Are there indications that this market may have peaked? Two key economic developments point to rising risks to this multi-year housing rally.
1. Real rates on deposits have turned positive in China recently, which will reduce incentives to use property markets as a savings tool. If rich savers make more on interest than they lose to inflation, they are less inclined to look for alternatives to bank deposits.

Source: Credit Suisse

2. The recent madness in China's money markets and PBoC's "delayed reaction" to tight monetary conditions (see discussion) could potentially spill over into the broader credit markets, resulting in increased lending rates and tighter credit conditions in general. That's not great news for property markets.

JPMorgan: - We expect liquidity conditions to ease in July, but in the near term, there is a risk that the tough line taken by the PBOC will create an artificial liquidity squeeze and cause an increase in the lending rate to the real sector (the SHIBOR rate also increased significantly, to 5.4%), putting further pressure on already-weak economic activity. In our view, the PBOC should reintroduce reverse-repo [injecting liquidity] operations very soon to calm the panic in the interbank market.

These threats to China's property markets, combined with weakness in manufacturing, do not bode well for China's near term growth prospects.

See the original article >>
Has Gold Lost Its Shine For Good?

By: Profit_Confidential

George Leong writes: Back in April, I said gold was looking bad on the chart and that as long as the stock market continued to advance higher, the prospects for gold were dim. (Read “Is Gold’s Near-Death Crisis Over-Exaggerated? Concerns of a Market Meltdown May Not Be.”)

Fast-forward two months, and while stocks have been in a minor correction, there continues to be distaste for holding gold.

The reality is that inflation is benign and will likely stay that way for a few years. The world’s central banks continue to drive easy money into the system and investors are looking elsewhere to make money, ignoring the precious metals, especially gold, traditionally a safe-haven investment.
The problem now is that there’s really no need for a safe haven at this juncture.
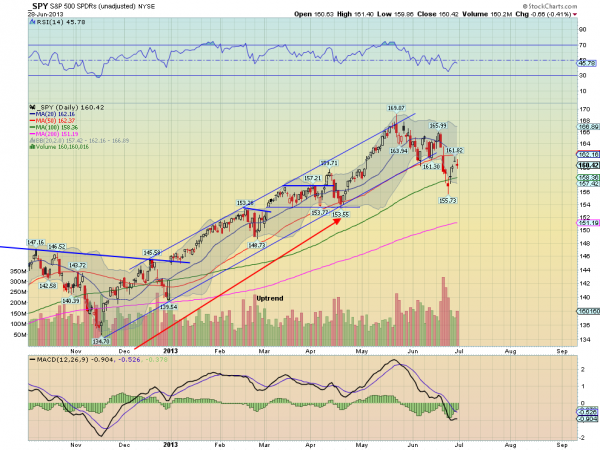
Gold is down 36% from its peak of $1,920 in September 2011, and it’s not looking good.
I even feel that gold is vulnerable to $1,200 on the chart. Take a look at the long-term chart of spot gold featured below. The lower support appeared to be in place until the slide on Wednesday to the $1,224 level. The threat now is that gold could continue to break down and make a move toward $1,200. If this happens, we could actually see a move down to the $1,100 level, based on my technical analysis.

Chart courtesy of www.StockCharts.com

Of course, the futures market appears to be betting on a rally. The contracts all the way out to December 2018 show the spot price above $1,200, but I have seen this more positive sentiment before, and it subsequently failed to pan out.
Even if gold holds, the upside over the next several years appears to be limited. The highest level is $1,407 for the December 2018 contract.
My view has not changed. I have little confidence in gold as an investment. You could make some money trading the commodity on weakness and selling on a rebound, but in my opinion, the bear market in gold is here to stay—at least for the immediate future.
Of course, some gold bugs talk about the fact that the ore is a limited commodity based on what is in the ground, but this supply needs to be found and extracted.
Also, India and China may be major buyers of gold, but both of those countries are facing some serious growth issues; I don’t see the demand surging to levels where it will impact prices.
For now, I just don’t see the heavy demand that could spark gold to another rally, so I’d suggest you stay out of the yellow metal unless you’re a trader. Holding gold for the long term isn’t going to make you rich.

See the original article >>
China's Economic Rebalancing Killed The Asian Locomotive

By: Andrew_McKillop

PEKIN SCHEMES, PEKIN DREAMS
As we know, if we believe what we read in the media, Edward Snowden might be trying to return home and face show trial, but “under his own conditions”. In any case Vladimir Putin will be glad to get rid of him the same way China's leadership very quickly passed the buck, or rather the Snowden hot potato to Putin. More important for the world economy, China is no longer playing Asian Locomotive and has radical new plans – due to the pressures causing the new plans – for steering its economy.

In the space of not much more than three months, culminating in last week's Chinese bank sector liquidity crunch which sent the cost of short-term loans to such giddy heights it roiled global markets, almost every financial institution and every major analyst have lowered their growth forecasts for China. The cutbacks are coming faster – and bigger. The World Bank's most recent forecast for 2013 Chinese growth was slashed by close to one percent, to an estimated 7.7 percent, but that is no longer a low-side estimate. Many banks and major players like Goldman Sachs have downgraded their China forecasts at an accelerating and deepening rate, making 7 percent the new high-end. Playing with the inflation rate also helps, because inflation in China is as segmented and variable from one sector to another, even inside the financial sector, as in major Western economies with the massive difference that in China, there is no trace of deflation – except when it concerns real asset values minus debt.

Why China's leadership would “want to slay growth” is not a question that can be asked in China. The leadership has a seamless wall of rhetoric and disinformation as an answer, propaganda as faultlessly false as that used by Ben Bernanke or Mario Draghi, but much more important, China has no choice but “rebalance” its economy.

CUT AND CUT AGAIN
All the present bank and institutional China growth forecasts are likely still too high. Nothing prevents China's economy doing what the Western economies did in 2008-2009, followed by most of them “recovering” to near-zero real growth for the years since 2010. China's economy, as its leadership says but using its own special coded language, is making a giant turning as it transforms from one based on export growth driven by export industry investment - to one driven by domestic spending and the reduction of debt.

Growth predictions are in fact rearview mirror images of China's former economy and can only underestimate the impact of this shift. They tell us about previous-only “trends continued”.

China's shadow banking system (SBS) as I noted in another recent article is massive, but at least as important as its uncontrolled and unregulated status, its size is also unknown. Some guesstimates suggest its SBS may marshal assets equal to about 50% of the formal banking system. The recent liquidity crunch, and the pressure which caused it, illustrates the difficulties China's economy will face in the future. Certainly since 2010, increasing all the time, major industrial corporations as well as finance-sector companies have operated as SBS entities to avoid central government controls, using foreign trade in any good, asset or instrument as the support for achieving their single goal of borrowing money from overseas lenders. This is often through offshore affiliates using fake trade invoices to import funds into China disguised as revenues from export sales of non-existent goods.

These funds are in priority used outside the industrial sector. The flood of mainly US dollars arising from fake exports, as well as dollar inflows from real exports, cannot be spent because they exceed Chinese spending on imported goods and Chinese overseas investment, with the direct result that the state's PBC central bank is forced to buy excess dollars to prevent the value of the renminbi or yuan going higher. Placing the surplus dollars as extreme low yielding US Treasury bonds while borrowing renminbi inside China at higher overnight rates results in ever-increasing losses for the PBC as its dollar reserves continually expand.

This has a number of negative impacts, including a huge increase in SBS lending activity and high rates of inflation outside the “official sector” as overall credit (dollars + renminbi) powers upward. Since May, the authorities have started clamping down on fake export invoices with an automatic decline in the apparent (but unreal) amount of exports made by China.  Foreign currency inflows into China have dried up, causing a liquidity crisis as the former rapid credit growth slows. How China manages this banking and monetary crisis remains to be seen – but the effects of this on distorted national accounts, showing massive but unreal exports, has already been major.

THEY CALL IT REBALANCING
The surprising thing about China's slowdown, called “rebalancing” is that it exists as a policy for at least three years, but has been applied in strange ways. What is happening is more insidious – the slowdown or “rebalancing” has applied itself.

Among the official rebalancing policy goals we find the intention to cut back on industrial investment and to reduce the role of corporate debt. The possible interpretation that increasing consumer credit – and therefore debt – is another goal can be rapidly discarded. This is light years away from the real situation, where the combined liquidity of the SBS and formal banking system taken together, is massive, but as shown by last weeks liquidity crisis, the overall system's ability to “turn on a dime” and run short of renminbi despite the vast amounts of “structural” liquidity, is a clear sign of instability.

At any time, inflation can explode.

Inside China, to the extent that policy speculation or criticism is permitted, some analysts say the administration of President Xi Jinping is hostage to the actions of it's predecessor, Hu Jintao, who engaged a policy of permanent expansion until very nearly the end of Hu's reign, While in public  President Xi promises he will stay the course, events like last week's liquidity crisis could cause his regime to take out the fire axe to pursue its growth-constraining “rebalancing” policy which includes a halt to credit expansion.

President Xi certainly knows the dangers of that strategy! Almost any previous Stars of Growth in the Chinese economy – real estate, cars, capital-intensive high-tech manufacturing – are experiencing serious debt or leverage problems and sometimes extreme difficulty adjusting to slower growth, while the bottomless pit of local and municipal government financing continues its craving for constant and rapid credit expansion. Halting this will certainly and surely mean a significant reduction in economic activity over the next decade.

WIDE-RANGING SPINOFF
US media reporting the Edward Snowden affair attempted to paint a picture of Putin's Russia crowing with evil pleasure at America's humiliation – while China's response was almost civilized. In fact Chinese media, all of it state controlled, has been harsher on the US, on the Snowden affair, than Russia's media which is only “regime friendly”.  China was polite but cold. It had no time at all for US whining. The emerging Chinese political attitude or stance to the rest of the world is that Pekin is playing a grave and difficult domestic game and if the rest of the world does not want to understand the stakes, or accommodate China's transition to a sustainable growth model, and for example starts playing hardball on trade relations – they will get massacred.

China is moving a lot faster than many persons realize. As policymakers in China continue to try to restructure the economy away from reliance on massive, debt-fueled investment projects which create little or no value for the economy, the rest of the world meaning the United States, Europe and Japan must understand that if they raise trade pressures at this time they can abort the difficult “rebalancing” which under any hypothesis can only, and will only reduce growth. As last week's small-sized but menacing banking crisis showed, the stability of China's economy especially as trade surpluses decline along with real foreign investment, is low. A trade war at this time may be devastating.

Just as certain, if China's economy tips into crisis driven by a monetary and banking crisis, this will also have devastating implications for global markets.

The Snowden affair and how China handled it – compared with Putin's Russia – provides us another window on how critical the “rebalancing” act has become in China, which has no time to play with “cyber spy” escapades with an American domestic political handle. Regardless of what happens next, talk about China's economy growing at around 7 or 8 percent over the next few years is unrealistic, even nonsensical.

As the reliable dummy for real economic growth in China – its coal burn and coal import data – will soon show, with a possible collapse of coal imports, the economy is slowing fast. Realistic analysts say that 3 or 4 percent growth is what we should expect but the number of open questions are as high as the closed doors for Edward Snowden. Adjusting to the end of the Asian Locomotive – which ran on coal - will be a tricky proposition but the real world policy of China, for years ahead, will be de-levering domestic debt, satisfying Chinese consumers and building a sustainable economy.

See the original article >>
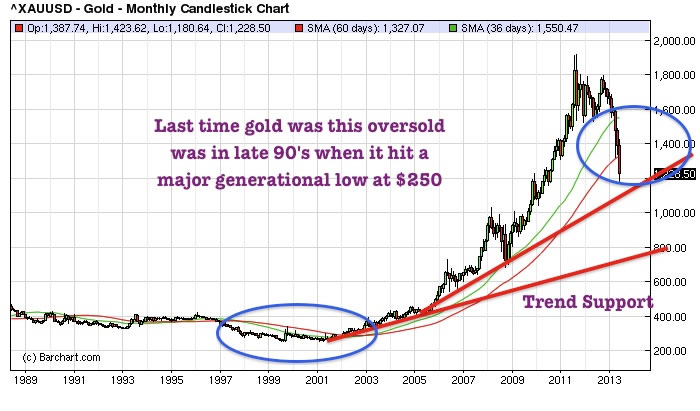
Follow Us