Sunday, September 11, 2011

The $ Cost of 9/11

By Barry Ritholtz

I try to avoid getting caught up in the 9/11 retrospective hype. I’ve already had my say (A Personal Recollection From a Day of Horror (September 12th, 2001).
Meanwhile, here is the NYT’s infographic of the numbers:
Al Qaeda spent roughly half a million dollars to destroy the World Trade Center and cripple the Pentagon. What has been the cost to the United States? In a survey of estimates by The New York Times, the answer is $3.3 trillion, or about $7 million for every dollar Al Qaeda spent planning and executing the attacks. While not all of the costs have been borne by the government — and some are still to come — this total equals one-fifth of the current national debt.
>
Click for interactive data:

Source: 9/11 : The Reckoning
NYT, September 8, 2011

PREPARING FOR A CREDIT CRISIS


I am sure the Euro will oblige us to introduce a new set of economic policy instruments. It is politically impossible to propose that now. But some day there will be a crisis and new instruments will be created.”

- Romano Prodi, EU Commission President, December 2001

Prodi and the other leaders who forged the euro knew what they were doing. They knew a crisis would develop, as Milton Friedman and many others had predicted. They accepted that as the price of European unity. But now the payment is coming due, and it is far larger than they probably thought.

This week we turn our eyes first to Europe and then the US, and ask about the possibility of a yet another credit crisis along the lines of late 2008. I then outline a few steps you might want to consider now rather than waiting until the middle of a crisis. It is possible we can avoid one but, as I admit, whether we do (and the extent of such a crisis) depends on the political leaders of the developed world (the US, Europe, and Japan) making the difficult choices and doing what is necessary. And in either case, there are some areas of investing you clearly want to avoid. Finally, I turn to that watering-hole favorite, the weather, and offer you a window into the coming seasons. Can we catch a break here? There is a lot to cover, so we will jump right in.

The Consequences of Austerity

The markets are pricing in an almost 100% certainty of a Greek default (OK, actually 91%), and the rumors in trading circles of a default this weekend by Greece are rampant. Bloomberg (and everyone else) reported that Germany is making contingency plans for the default. Of course, Greece has issued three denials today that I can count. I am reminded of that splendid quote from the British 80s sitcom, Yes, Prime Minister: Never believe anything until its been officially denied.

Germany is assuming a 50% loss for their banks and insurance companies. Sean Egan (head of very reliable bond-analyst firm Egan-Jones) thinks the ultimate haircut will be closer to 90%. And that is just for Greece. More on the contagion factor below.

The existence of a Plan B underscores German concerns that Greeces failure to stick to budget-cutting targets threatens European efforts to tame the debt crisis rattling the euro. German lawmakers stepped up their criticism of Greece this week, threatening to withhold aid unless it meets the terms of its austerity package, after an international mission to Athens suspended its report on the countrys progress.

Greece is on a knifes edge, German Finance Minister Wolfgang Schaeuble told lawmakers at a closed-door meeting in Berlin on Sept. 7, a report in parliaments bulletin showed yesterday. If the government cant meet the aid terms, its up to Greece to figure out how to get financing without the euro zones help, he later said in a speech to parliament.

Schaeuble travelled to a meeting of central bankers and finance ministers from the Group of Seven nations in Marseille, France, today as they face calls to boost growth amid increasing threats from Europes debt crisis and a slowing global recovery. (Bloomberg: seehttp://www.bloomberg.com/news/2011-09-09/germany-said-to-prepare-plan-to-aid-country-s-banks-should-greece-default.html)

(There is an over/under betting pool in Europe on whether Schaeuble remains as Finance Minister much longer after this weekends G-7 meeting, given his clear disagreement with Merkel. I think I take the under. Merkel is tough. Or maybe he decides to play nice. His press doesnt make him sound like that type, though. They are playing high-level hardball in Germany.)

Anyone reading my letter for the last three years cannot be surprised that Greece will default. It is elementary school arithmetic. The Greek debt-to-GDP is currently at 140%. It will be close to 180% by years end (assuming someone gives them the money). The deficit is north of 15%. They simply cannot afford to make the interest payments. True market (not Eurozone-subsidized) interest rates on Greek short-term debt are close to 100%, as I read the press. Their long-term debt simply cannot be refinanced without Eurozone bailouts.

Was anyone surprised that the Greeks announced a state fiscal deficit of 15.5 billion for the first six months of 2011, vs. 12.5 billion during the same period last year? What else would you expect from increased austerity? If you reduce GDP by as much as Greece attempted to do, OF COURSE you get less GDP and thus lower tax revenues. You cant do it at 5% a year, as I have pointed out time and time again. These are the consequences of allowing debt to get too high. It is the Endgame.

[Quick sidebar: If (when) the US goes into recession, have you thought about what the result will be? A recession of course means lower GDP, which will mean higher unemployment. That will increase costs due to increased unemployment and other government aid, and of course lower revenues as tax receipts (revenues) go down. Given the projections and path we are currently on, that means even higher deficits than we have now. If Obama has his plan enacted, and if we go into a recession, we will see record-level deficits. Certainly over $1.5 trillion, and depending on the level of the recession, we could scare $2 trillion. Think the Tea Party will like that? Governments have less control than they think over these things. Ask Greece or any other country in a debt crisis how well they predicted their budgets.]

The Greeks were off by over 25%. And they are being asked to further cut their deficit by 4% or so every year for the next 3-4 years. That guarantees a full-blown depression. And it also means lower revenues and higher deficits, even at the reduced budget levels, which means they get further away from their goal, no matter how fast they run. They are now in a debt death spiral. There is no way out, short of Europe simply bailing them out for nothing, which is not likely.

Europe is going to deal with this Greek crisis. The problem is that this is the beginning of a string of crises and not the end. They do not appear, at least in public, to want to deal with the systemic problem of too much debt in all the peripheral countries.

Without ECB support, the interest rates that Italy and Spain would be paying would not be sustainable. I can see a path for Italy (not a pretty one, but a path nonetheless) but Spain is more difficult, given the weakness of its banks and massive private debt. These are economies that matter.

How do they get out of this without a debt crisis on the scale of 2008? By coming to grips with the problem. Germany is apparently doing that this weekend, by preparing to use the money it was going to pour into Greece to shore up its own banks. That is a much better plan. But as a well-researched report (by Stephane Deo, Paul Donovan, and Larry Hathaway in the London office – kudos, guys!) from UBS shows, solving the problem will be very costly. The next few paragraphs are from their introduction.

Euro Break-Up The Consequences

The Euro should not exist (like this)

Under the current structure and with the current membership, the Euro does not work. Either the current structure will have to change, or the current membership will have to change.

Fiscal confederation, not break-up

Our base case with an overwhelming probability is that the Euro moves slowly (and painfully) towards some kind of fiscal integration. The risk case, of break-up, is considerably more costly and close to zero probability. Countries cannot be expelled, but sovereign states could choose to secede. However, popular discussion of the break-up option considerably underestimates the consequences of such a move.

The economic cost (part 1)

The cost of a weak country leaving the Euro is significant. Consequences include sovereign default, corporate default, collapse of the banking system and collapse of international trade. There is little prospect of devaluation offering much assistance. We estimate that a weak Euro country leaving the Euro would incur a cost of around 9,500 to 11,500 per person in the exiting country during the first year. That cost would then probably amount to 3,000 to 4,000 per person per year over subsequent years. That equates to a range of 40% to 50% of GDP in the first year.

The economic cost (part 2)

Were a stronger country such as Germany to leave the Euro, the consequences would include corporate default, recapitalization of the banking system and collapse of international trade. If Germany were to leave, we believe the cost to be around 6,000 to 8,000 for every German adult and child in the first year, and a range of 3,500 to 4,500 per person per year thereafter. That is the equivalent of 20% to 25% of GDP in the first year. In comparison, the cost of bailing out Greece, Ireland and Portugal entirely in the wake of the default of those countries would be a little over 1,000 per person, in a single hit.

The political cost

The economic cost is, in many ways, the least of the concerns investors should have about a break-up. Fragmentation of the Euro would incur political costs. Europes soft power influence internationally would cease (as the concept of Europe as an integrated polity becomes meaningless). It is also worth observing that almost no modern fiat currency monetary unions have broken up without some form of authoritarian or military government, or civil war.

Welcome to the Hotel California

Welcome to the Hotel California
Such a lovely place
Such a lovely face
They livin it up at the Hotel California
What a nice surprise, bring your alibis

Last thing I remember, I was running for the door
I had to find the passage back to the place I was beforeRelax, said the night man, We are programmed to receive. You can check out any time you like, but you can never leave!

- The Eagles, 1977

You can disagree with the UBS analysis in various particulars, but what it shows is that there is no free lunch. It is not a matter of pain or no pain, but of how much pain and how is it shared. And to make it more difficult, breaking up may cost more than to stay and suffer, for both weak and strong countries. There are no easy choices, no simple answers. Like the Hotel California, you can check in but you cant leave! There are simply no provisions for doing so, or even for expelling a member.

The costs of leaving for Greece would be horrendous. But then so are the costs of staying. Choose wisely. Quoting again from the UBS report:

the only way for a country to leave the EMU in a legal manner is to negotiate an amendment of the treaty that creates an opt-out clause. Having negotiated the right to exit, the Member State could then, and only then, exercise its newly granted right. While this superficially seems a viable exit process, there are in fact some major obstacles.

Negotiating an exit is likely to take an extended period of time. Bear in mind the exiting country is not negotiating with the Euro area, but with the entire European Union. All of the legislation and treaties governing the Euro are European Union treaties (and, indeed, form the constitution of the European Union). Several of the 27 countries that make up the European Union require referenda to be held on treaty changes, and several others may choose to hold a referendum. While enduring the protracted process of negotiation, which may be vetoed by any single government or electorate, the potential secessionist will experience most or all of the problems we highlight in the next section (bank runs, sovereign default, corporate default, and what may be euphemistically termed civil unrest).

Leaving abruptly would result in a lengthy bank holiday and massive lawsuits and require the willingness to simply thumb your nose in the face of any European court, as contracts of all sorts would have to be voided. The Greek government would have to conveniently pass a law that would require all Greek businesses to pay back euro contracts in the new drachma, giving cover to their businesses, who simply could not find the euros to repay. But then, what about business going forward?

Medical supplies? Food? the basics? You have to find hard currencies for what you dont produce in the country. Greece is not energy self-sufficient, importing more than 70% of its energy needs. They have a massive trade deficit, which would almost disappear, as who outside of Greece would want the new drachma? Banking? Parts for boats and business equipment? The list goes on and on. Commerce would slump dramatically, transportation would suffer, and unemployment would skyrocket.

If Germany were to leave, its export-driven economy would be hit very hard. It is likely that the new mark would appreciate in value, much like the Swiss Franc, making exports from Germany even more costly. Not to mention potential trade barriers and the serious (and probably lengthy) recession that many of their export and remaining Eurozone trade partners would be thrown into. And German banks, which have loaned money in euros, would have depreciating assets and would need massive government support. (Just as they do now!)

Can a crisis be avoided? Yes. But that does not mean there will be no pain. We can avoid a debt debacle in the US, but doing so will mean reducing debt every year for 5-6 years in the teeth of a slow-growth economy and high unemployment. It will require enormous political will and mean many people will be unemployed longer and companies will be lost.

Ray Dalio and his brilliant economics team at Bridgewater have done a series of reports on a plan for Europe. Basically, it involves deciding which institutions must be saved (and at what cost) and letting the rest simply go their own way. If they are bankrupt, then so be it. Use the capital of Europe to save the important institutions (not shareholders or bondholders). Will they do it? Maybe.

The extraordinarily insightful and brilliant John Hussman recently wrote on a similar theme. He is a must-read for me. Quoting:

The global economy is at a crossroad that demands a decision whom will our leaders defend? One choice is to defend bondholders – existing owners of mismanaged banks, unserviceable peripheral European debt, and lenders who misallocated capital by reaching for yield and fees by making mortgage loans to anyone with a pulse. Defending bondholders will require forced austerity in government spending of already depressed economies, continued monetary distortions, and the use of public funds to recapitalize poor stewards of capital. It will do nothing for job creation, foreclosure reduction, or economic recovery.

The alternative is to defend the public by focusing on the reduction of unserviceable debt burdens by restructuring mortgages and peripheral sovereign debt, recognizing that most financial institutions have more than enough shareholder capital and debt to their ownbondholders to absorb losses without hurting customers or counterparties but also recognizing that properly restructuring debt will wipe out many existing holders of mismanaged financials and will require a transfer of ownership and recapitalization by better stewards. That alternative also requires fiscal policy that couples the willingness to accept larger deficits in the near term with significant changes in the trajectory of long-term spending.

In game theory, there is a concept known as Nash equilibrium (following the work of John Nash). The key feature is that the strategy of each player is optimal, given the strategy chosen by the other players. For example, I drive on the right / you drive on the right is a Nash equilibrium, and so is I drive on the left / you drive on the left. Other choices are fatal.

Presently, the global economy is in a low-level Nash equilibrium where consumers are reluctant to spend because corporations are reluctant to hire; while corporations are reluctant to hire because consumers are reluctant to spend. Unfortunately, simply offering consumers some tax relief, or trying to create hiring incentives in a vacuum, will not change this equilibrium because it does not address the underlying problem. Consumers are reluctant to spend because they continue to be overburdened by debt, with a significant proportion of mortgages underwater, fiscal policy that leans toward austerity, and monetary policy that distorts financial markets in a way that encourages further misallocation of capital while at the same time starving savers of any interest earnings at all.

We cannot simply shift to a high-level equilibrium (consumers spend because employers hire, employers hire because consumers spend) until the balance sheet problem is addressed. This requires debt restructuring and mortgage restructuring. While there are certainly strategies (such as property appreciation rights) that can coordinate restructuring without public subsidies, large-scale restructuring will not be painless, and may result in market turbulence and self-serving cries from the financial sector about global financial meltdown. But keep in mind that the global equity markets can lose $4-8 trillion of market value during a normal bear market. To believe that bondholders simply cannot be allowed to sustain losses is an absurdity. Debt restructuring is the best remaining option to treat a spreading cancer. Other choices are fatal.

See ( http://hussmanfunds.com/wmc/wmc110905.htm for the rest of the article.)

You think the worlds central banks and main institutions are not worried? They are pulling back from bank debt in Europe, as are US money-market funds. (Note: I would check and see what your money-market funds are holding how much European bank debt and to whom? While they are reportedly reducing their exposure, there is some $1.2 trillion still in euro-area institutions that have PIIGS exposure.)

Look at the following graph from the St. Louis Fed. It is the amount of deposits at the US Fed from foreign official and international accounts, at rates that are next to nothing. It is higher now than in 2008. What do they know that you dont?
Graph of Factors Absorbing Reserve Funds - Reverse Repurchase Agreements - Foreign Official and International Accounts

The Slow March to Recession in the US

Until there is a real crisis in Europe, the US will continue on its path of slower growth. Economists who base their projections on past history will not see this coming. Analysts who base their earnings estimates on recent performance are going to miss it (again.) Note: analysts, as I have written numerous times in this letter, are so very, very bad as a group at predicting future earnings that I am amazed people pay attention to them; but they seemingly do. They consistently miss tops and bottoms. That is the one thing they are very good at.

John Hussman, in the same report, offers the chart below, which is a variant on themes I have highlighted in past issues, but with his own personal twist. It is a combination of four Fed indices and four ISM reports. And it has been reliable as a predictor of recessions – one of which it strongly suggests we are either in or heading into.
http://hussmanfunds.com/wmc/wmc110905a.gif
And recent revisions to economic data suggest that companies are going to have even more trouble making those powerhouse earnings that are being estimated. As Albert Edwards of Societe Generale reports this week:

at the start of 2011, productivity trends took a remarkable turn for the worse especially compared to what was initially reported. An initial estimate that Q1 productivity grew by 1.8% was transformed to show a decline of 0.6%. A slight 0.7% rise in Q1 ULC (unit labor costs) was transformed to show a staggering surge of 4.8%! In addition to that 4.8% rise, ULC rose a further 2.2% in Q2. But the news gets even worse Last week the BLS revised the ULC rise in Q2 up from 2.2% to 3.3% QoQ. US non-farm business unit labor costs are now rising by 2% yoy. That is very bad news for profits. Bad news for equities. And because the pace of ULC is a key driver of inflation (upwards in this instance), it is bad news for an increasingly criticized and divided Fed.

Preparing for a Credit Crisis

There is so much that could push us into another 2008 Lehman-type credit crisis. As I say, it is not a given, but the possibility should be on your radar screen. Lehman may have been the straw that broke the camel’s back, but there were a lot of other problems. Prior to 2008, we had seen several large companies in the financial world simply disappear. REFCO comes to mind. Not a whimper in the markets. But Lehman was one of a dozen problems all over the world resulting from the larger subprime crisis. Howard Marks of Oaktree writes about simultaneous problems in the markets and what happens:

Markets usually do a pretty good job of coping with problems one at a time. When one arises, analysts analyze and investors reach conclusions and calmly adjust their portfolios. But when theres a confluence of negative events, the markets can become overwhelmed and lose their cool. Things that might be tolerable individually combine into an unfathomable mess whose extent and ramifications seem beyond analysis. Market crises are chaotic, not orderly, and the multiplicity and simultaneity of contributing causes play a big part in making them so.

I did an interview with good friends David Galland and Doug Casey of Casey Research yesterday. They are decidedly more bearish than I am, so wanted an optimist to sit on their panel. But they forced me to admit that some of my optimism depends on the probability of US political leaders doing the right thing. Depending on your opinion about that, you are more or less prone to think there is a crisis in our future. And while I like to think it is not me showing a home-town bias, I think Europe has worse problems and a tougher situation than the US. A crisis there is more likely, I think.

But whether you want to make it 50-50 to 70-30 or (pick a number), there is a reasonable prospect of another credit crisis. So what should you do?

First, think back to 2008. Were you liquid enough? Did you have enough cash? If not, then think about raising that cash now. When the crisis hits, you have to sell what you can for what you can get, not what you want for reasonable prices.

I am personally raising more cash in my business. I usually invest money as soon as I can. Now, I am still investing, and you too should still put money to work in places that you think have the potential to do well in a crisis. Go back and see what worked in 2008 and buy more of it! Long-only funds did not work. Those that were more nimble did.

In the next crisis, opportunities to buy assets on the cheap will grow, so having some cash will make it easier to buy things you want to own for the next 10-20 years, whether income-producing or just something you want for fun.

Think through your portfolio. In 2008 I watched investors liquidate solid funds, or sell off assets at fire-sale prices, because that was the only way they could raise cash, when that was the time to invest more, not redeem. Make sure you are the strong hand.

Understand, I am not saying sell your conviction stocks. I have some and am buying more. But no index funds, no long-only, unhedged funds. I make very specific choices when it comes to long-only investments that I am looking to hold over and beyond a ten-year horizon. And those are risks I want to take (at least today).

I do not want to own anything that looks like an index fund or long-only mutual fund. Think 2008. I want funds and managers that have an edge and have a hedge, preferably both.

I would not be long money-center bank stocks or bonds, not in the US and especially not in Europe. I have had private off-the-record conversations with Republican leaders. There is simply no willingness to do another TARP-like bailout of bondholders and shareholders. I believe them. As Hussman suggested, this time bondholders will lose. I just dont know which ones will be ready, and there are lots of other places to deploy assets. If you feel you have some special insight, then be my guest; but I just see too much risk for the potential reward, especially in large bank bonds that pay so little. That is not to say they are all equally bad certainly not the regionals with less exposure to Europe. But do your homework.

(Caveat: I do think even the GOP leaders will have to cave in and allow the government to be debtor-in-possession of the too-big-to-fail banks we allowed to exist under the really bad financial bill called Dodd-Frank, which needs to be repealed and replaced. We have to preserve the system, but not shareholders and bondholders, who will lose this time.)

Think through your business. Banking relationships are not what they used to be. Spend time now getting commitments. Remember the odd spike in 2008 in bank lending? It was from credit lines being drawn down. But no one got new lines at the time. What can you do if sales get tough? What can you do to increase market share when your competitors start to pull back? The winners in 2008-09 were the companies that increased innovation and did not pull back (according to a Boston Consulting Group survey).

If you plan correctly, the next crisis will be an opportunity for you and not a personal crisis. And you will be better able to help those who need it.

A special note. In a few weeks I will be sending out an email that will contain a link to a totally free treasure trove of business and marketing ideas you can use to keep your business at the cutting edge, whether you are established are just starting out. It is one of those things I can do that costs me very little, but that sometime may mean a lot to you. I am just glad to be in the position to help a little.

I know I sound rather stark at times, but I really dont want you to dig a hole and get in and cover yourself up. I do not. While we are perhaps somewhat more cautious, we are also looking for ways to grow and be more aggressive here at my business. I will keep repeating: look for the opportunities. They are there. Just gauge your risk appropriately.

This Time is Different . . .

By Global Macro Monitor

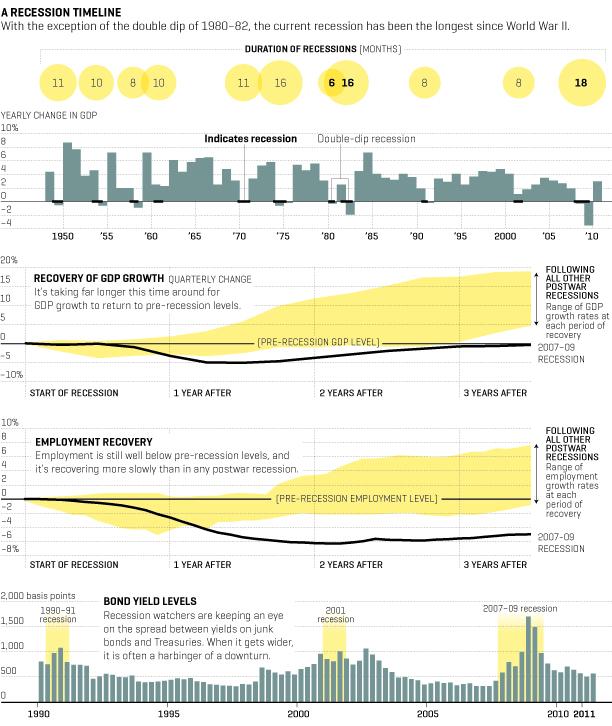
Those dreaded words you never want to hear as an investor. But check out the Fortune Magazine graphic of this recession relative to others since the WWII. Yes it’s a balance sheet problem and the economy needs more time to heal and delever.

We also maintain, however, at least some, if not much of the weakness, especially in the labor market, is structural and not cyclical. Take the U.S. Postal Service (USPS) as the poster child of the current problems plaguing the U.S. labor market. The USPS has 571,566 full-time workers making it the country’s second-largest civilian employer after Wal-Mart. It has eliminated 110,000 jobs in the past four years and according to the FT,
During the next five years, the service plans to cut 220,000 staff – about 120,000 through lay-offs – and close up to 300 processing centres on top of plans to shutter up to 3,700 post offices released last month.
Now why is this? Not enough stimulus? Monetary policy too tight? Insufficient quantitative easing? To paraphrase James Carville, “It’s technology, stupid!” The rise of the internet, e-mail, and Twitter coupled with some piss poor management, which failed to adapt to the changing times, and the result is one of the nation’s largest employers facing bankruptcy and mass layoffs.

Borders Books Inc. is also in the process of liquidating the last of its stores, which will result in a final mass layoff of close to 11,000 employees. True, they failed because of “lack of demand” for their goods and services. But not because of cyclical forces that could be offset by fiscal and monetary expansion. The rise of the e-book, Kindle, and iPad shut them down.

The Shumpeterian “creative destruction” of one sector is not being equally and instantaneously offset by job creation in the sectors benefiting from technology. This takes time, retraining, political vision and strong leadership. Companies can’t hire enough software engineers in these fields because the current labor pool lacks the education, training and skills.

Policymakers must recognize the global economy is sitting at the elbow of an exponential curve in technological advances that is and will uproot everything from manufacturing to how we read our mail and books to how medical services will be delivered.

We’ve posted several pieces on the Global Macro Monitor blog about the role of transformative tech, including medical apps where smart phones can be transformed into EKG monitors and cataract detecting devices. How do you think this revolution will impact the traditional health care workforce?

We haven’t even touched on the mobile payments revolution, which will reduce the demand for retail salespersons and cashiers. Not a near-term positive for employment as the the BLS points out,
Retail salespersons and cashiers were the occupations with the highest employment in 2010. These two occupations combined made up nearly 6 percent of total U.S. employment.
The painkillers of fiscal and monetary stimulus, including negative real interest rates and quantitative easing, has no doubt cushioned the blow of the great crash of 2007-08. We’re the first to thank Paulson, Bernanke, Geithner and Co. that we are not all farmers living under the freeway. They all deserve the Presidential Medal of Freedom in our book for saving and stabilizing the global financial system.

But the continued use of cyclical policies to deal with structural issues has created an acute addiction in the markets and economy causing more uncertainty, political angst, and volatility, in our opinion. This is especially true in the equity markets, which was evident yesterday in its reaction to Mr. Bernanke’s speech.

The policy medicine has now become an additional disease afflicting and distorting markets and the economy, which are now hooked on the painkillers.

Policies that address structural issues, though painful, will go a long way in healing the economy. A long-term credible budget plan which addresses the structural deficit will instantly reduce much of the uncertainty holding back investment. Punishing savers with negative real interest rates “for at least two more years” will not and may actually consume the rest of the decade in cleaning up the unintended consequences of the Fed’s serial distorting of the relative price of money.

There’s now talk of the Fed targeting unemployment. How ’bout this. As part of the next quantitative easing, the Fed creates a $1,000 checking deposit for every citizen who agrees to write ten letters to friends, especially in rural parts of the country. This stimulates demand for postal services and thus eliminates, for a time, the need for mass layoffs at the USPS.

In no way do we intend to be insensitive to the workers at risk of losing their jobs. But is this really where economic policy is headed? Where is the leadership?
>

>

The Dow Peaks Of 1937 And 2007

by Desi Hedge

In response to a special request last February, I created an overlay of two major Dow peaks — the 1937 high following the Crash of 1929 and the 2007 all-time high.

Now, a little over six months later, here is an update.

When we align the two highs, we see a radical parting of ways a little over three years into the future.
chart
Here is the same overlay, this time adjusted for inflation, which puts our current price level a bit closer to the corresponding level in late 1940.
chart
We can analyze market data with trendlines, flags, and Fibonacci ratios to our heart’s content. But sometimes market behavior is best understood as a consequence of historical events and policy decisions. The Battle of France in May 1940 was an example of the former. Perhaps the Federal Reserve’s last round quantitative easing is an example of the latter. The results, at least until a few months ago, were dramatically different.
chart
We can look back on Dow history and see the tumultuous impact of World War II on the market and the dramatic recovery that followed. The question now is whether a decade or two in the future QE will be seen as a masterful stroke of economic management or an inadequate or ill-conceived delaying tactic (“kicking the can down the road”) that ultimately worsened the Fiscal Crisis we still must face. This unconventional policy gamble is a game of high stakes — namely, the economic well-being of the United States and other parts of the world as well.

See the original article >>

Macro Week in Review/Preview September 10, 2011


Last week’s review of the macro market indicators looked like the moves that revealed themselves the previous Friday would continue. Gold and US Treasuries were ready to continue higher. Crude Oil looked poised to drop further and the US Dollar Index to move sideways in the top of its range. The Shanghai Composite and Emerging Markets looked to continue lower. Volatility looked to remain elevated with the US Equity Index ETF’s SPY, IWM and QQQ ready to continue lower in their bear flags. US Treasuries breaking out and Gold racing higher again could be the catalyst for a break of the bear flags lower.

The week began Gold making a new high before pulling back to consolidate, US Treasuries gapped higher and held there. Crude Oil held narrow range between 86 and 90 while the US Dollar Index marched to the top of the range and then peaked out. The Shanghai Composite and Emerging Markets did move lower but with a mid week blip higher for Emerging Markets. Volatility did hold higher with and the Equity Index ETF’s remained lower, but still in their bear flags. What does this mean for the coming week? Lets look at some charts.

As always you can see details of individual charts and more on my StockTwits feed and on chartly.)

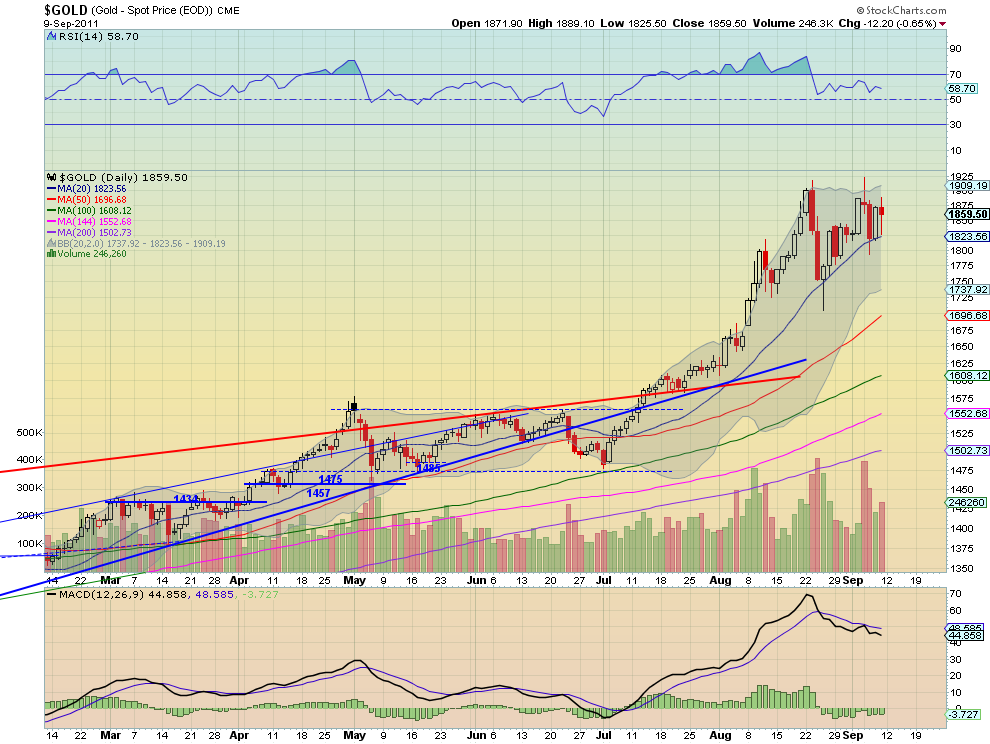
Gold Daily, $GC_F

Gold Weekly, $GC_F

Gold consolidated this week over the break out of the ascending triangle Monday and near resistance at 1875, after it made a new intraday high Tuesday. The Relative Strength Index (RSI) on the daily chart remains in bullish territory but moving sideways. The Moving Average Convergence Divergence (MACD) indicator has been running flat but slightly negative on the daily chart but has been rising on the weekly chart. The RSI on the weekly has held in the high 70′s for several weeks. Look for the bull flag on the weekly chart and symmetrical triangle on the daily chart to play out with either more upside or continuation of consolidation near 1875 in the coming week. Any pullback should find support at 1840 or 1800 lower. A move over 1930 triggers a target of 2250.

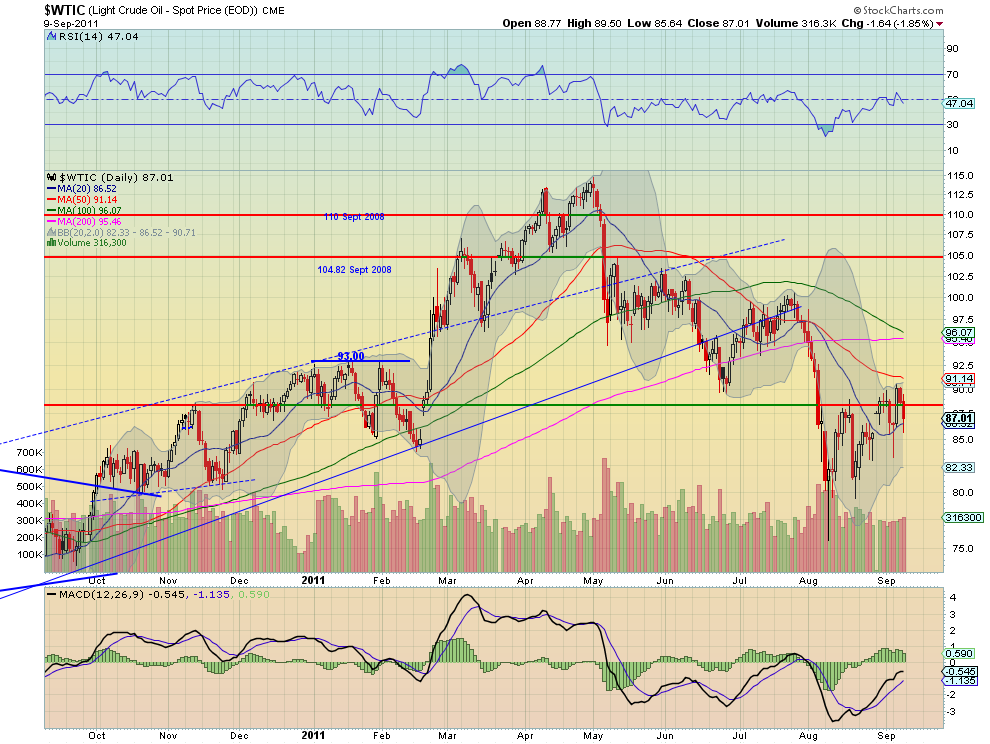
West Texas Intermediate Crude Daily, $CL_F

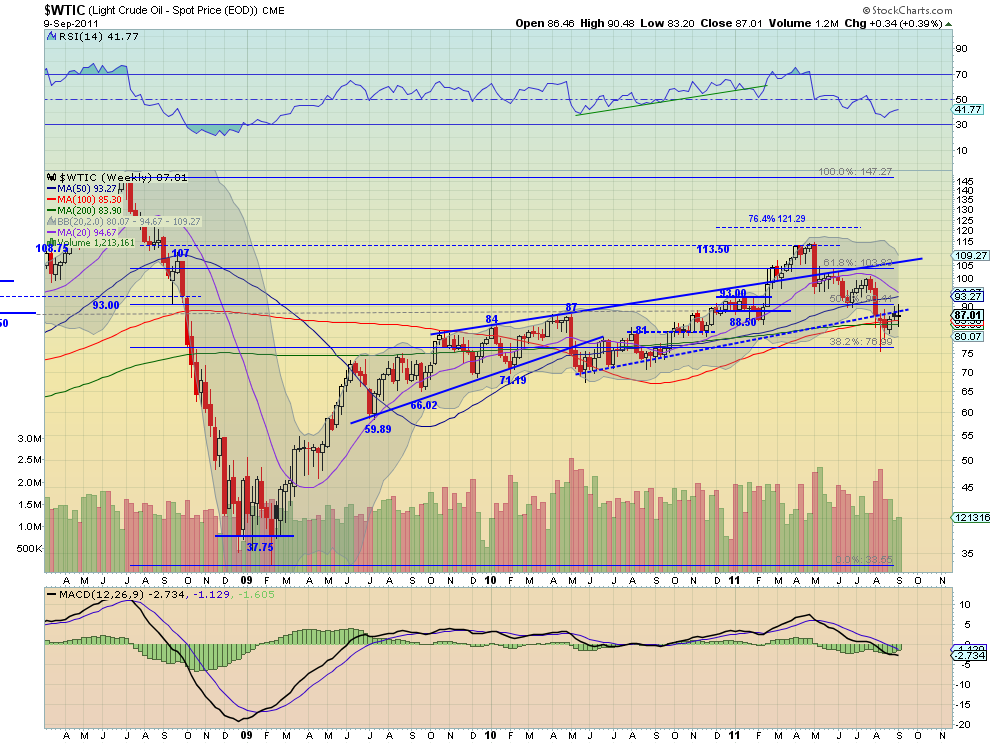
West Texas Intermediate Crude Weekly, $CL_F

Crude Oil continued its bear flag ending the week little changed and vacillating around the 88.50 support/resistance line. The weekly chart shows that resistance of the rising trendline extension form May 2010 is holding. The RSI on the daily chart has stalled near the mid line and the MACD is positive but fading slightly. The weekly chart shows the RSI currently rising but in a downtrend and the MACD improving. These suggest the bear flag will continue next week. Look for upside to be capped at 90 and a move to 93 above that as a break of the bear flag. A move under 84 finds support at 81 and then 77 lower which would trigger a target of 70 on the Measures Move (MM) out of the bear flag.

US Dollar Index Daily, $DX_F

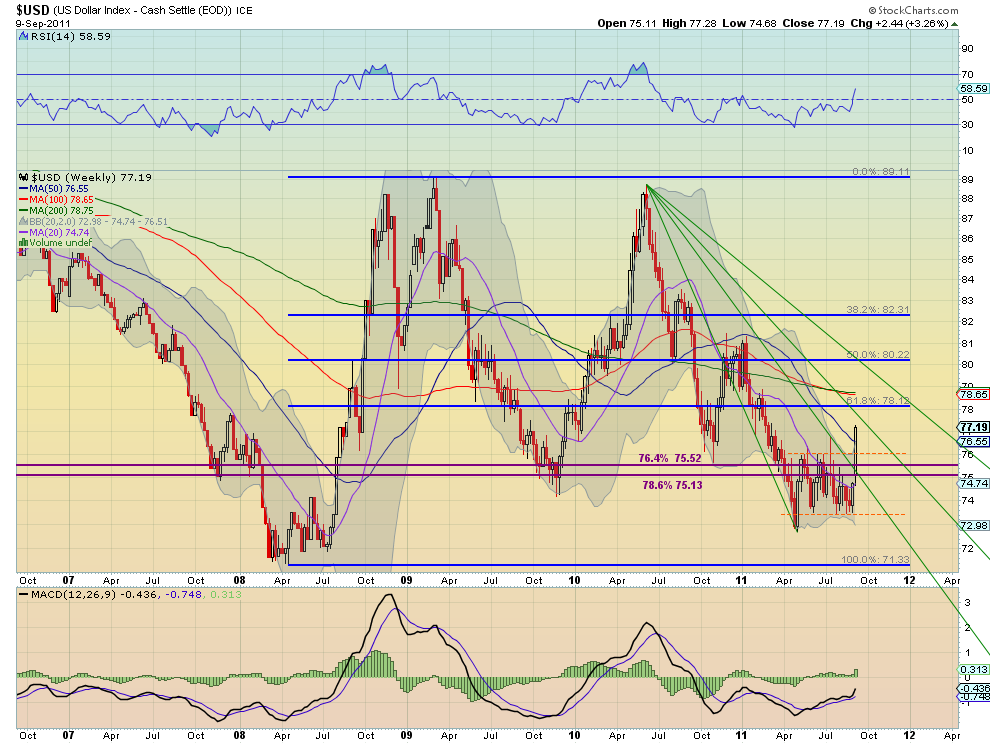
US Dollar Index Weekly, $DX_F

After peaking over the channel Thursday, the US Dollar Index broke the channel higher Friday. It has a RSI that raced higher all week and is strongly in bullish territory, and a MACD that is increasing on the daily chart. The weekly view shows a vault over the resistance area, opening over the Fibonacci Fan line and rising strongly towards the next line. The RSI on this timeframe moved steeply higher and the MACD jumped higher. Look for continued movement to the upside in the coming week with resistance higher at 77.50 and 78.15 as it heads to the channel breakout target of 78.50 near the previous 78.66 resistance area from February. As with any breakout, a retest of the channel at 76 is possible and a move below it has support at 75.52 and 75.

iShares Barclays 20+ Yr Treasury Bond Fund Daily, $TLT

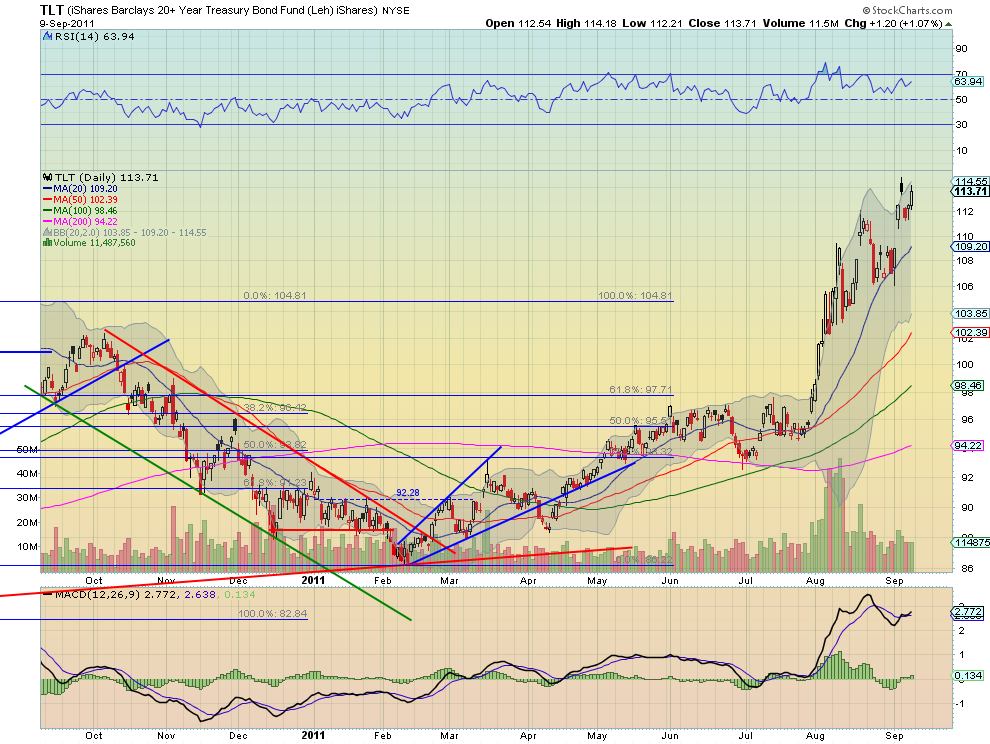
iShares Barclays 20+ Yr Treasury Bond Fund Weekly, $TLT

US Treasuries, measured by the ETF $TLT, gapped up higher on Monday and held the gap. The daily chart shows the RSI continuing to move in a range in bullish territory but with a MACD that has crossed positive. The weekly chart adds that it broke the broad consolidation around the 106 to 111.33 area and now has a MM higher to about 120.70. The RSI on this timeframe remains bullish in the high 70′s with a MACD that is increasing. With a touch of 115 this week, next week or shortly after looks a lock to tag 120.70 and above that triggers a target on the symmetrical triangle break at 137. Any pullback will find support 111.33 and 109.30, with a move under 106 signalling a trend change.

Shanghai Stock Exchange Composite Daily, $SSEC

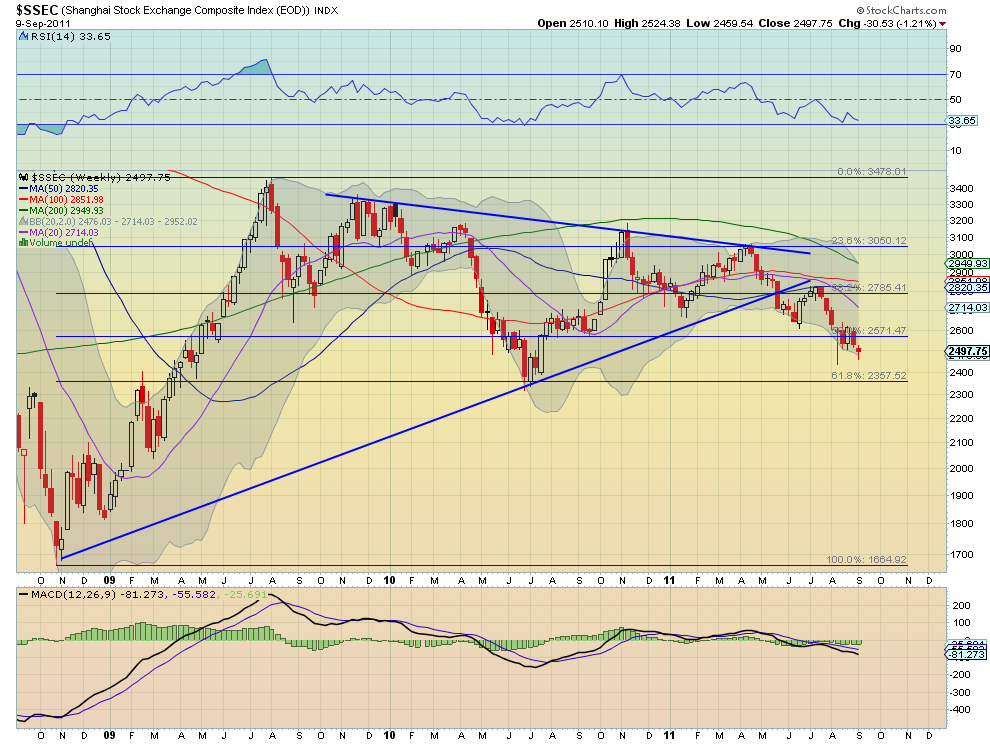
Shanghai Stock Exchange Composite Weekly, $SSEC

The Shanghai Composite showed continued resistance at the 2500 level holding lower for the week. The daily chart has a RSI that has been bumping along the 30 technically oversold level, but no where near an extreme reading while the MACD fluctuates around zero. The weekly chart shows the long trend of the RSI lower, making lower highs, and the flat MACD. It also shows that it is starting to fall out of the bear flag lower. Continue to favor the downside in the coming week a move below support at 2400 leading to a test of 2357 and a target of 2300 on the bear flag break. Upside should be capped for the week at 2571-2590.

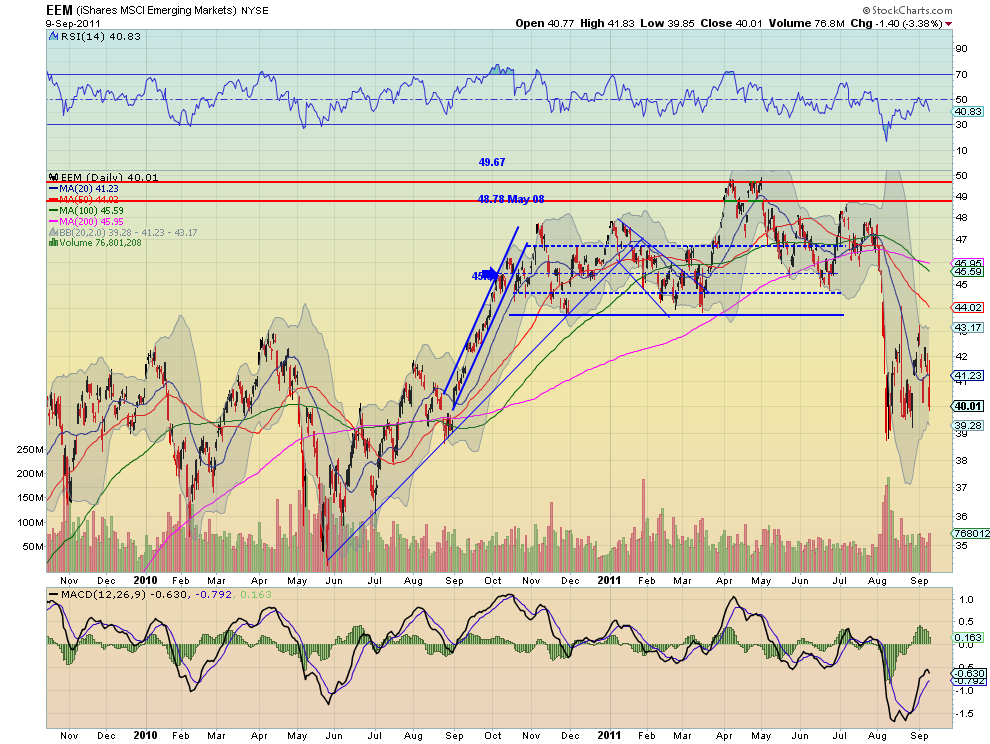
iShares MSCI Emerging Markets Index Daily, $EEM

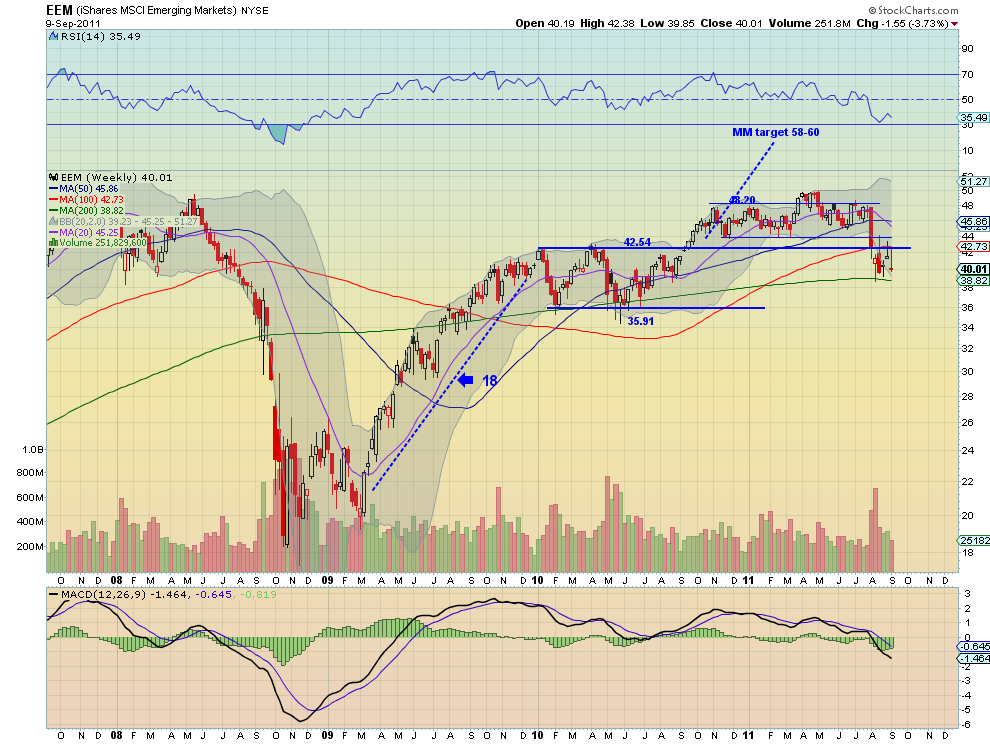
iShares MSCI Emerging Markets Index Weekly, $EEM

Emerging Markets, as measured by the ETF $EEM, continued in their bear flag similar to the domestic markets. Notice the RSI on the daily chart rejected lower at the mid line continuing in bearish territory as the MACD fades lower. On the weekly chart the bear flag is distinct under the 42.54 resistance level. The RSI on this timeframe is struggling to stay over 30, and is bearish, but the MACD is starting to improve. The downward bias remains for eh coming week with a break below 39, out of the bear flag seeing support lower at 35.91 and triggering a target of 32. Any upside will meet resistance at 42.54 and then 44.10 above that.

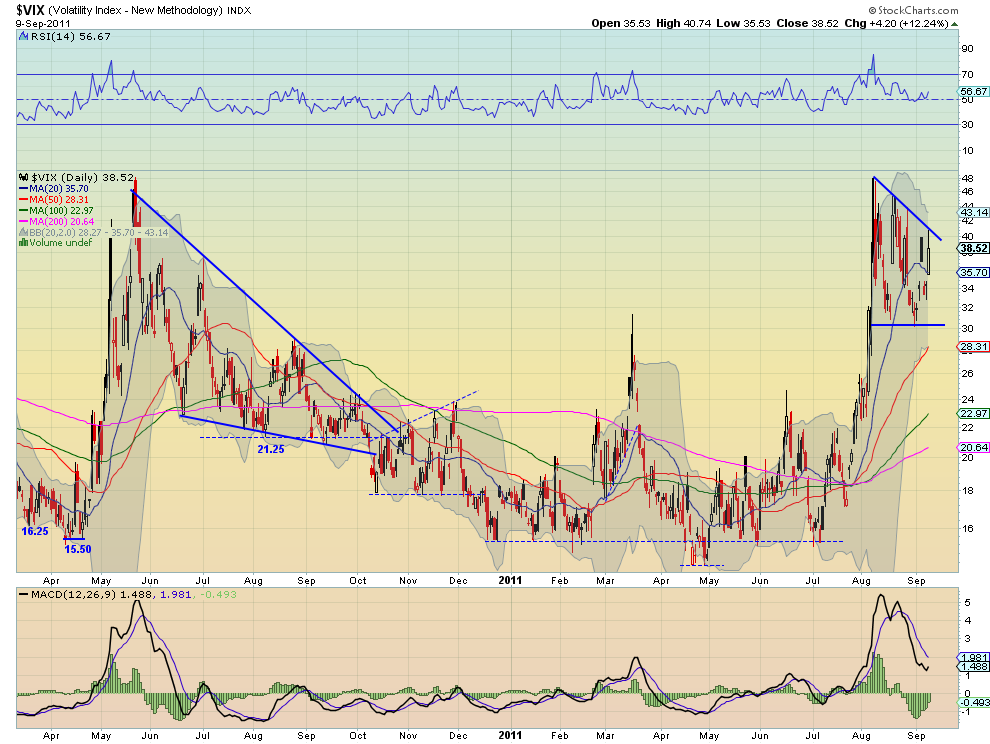
VIX Daily, $VIX

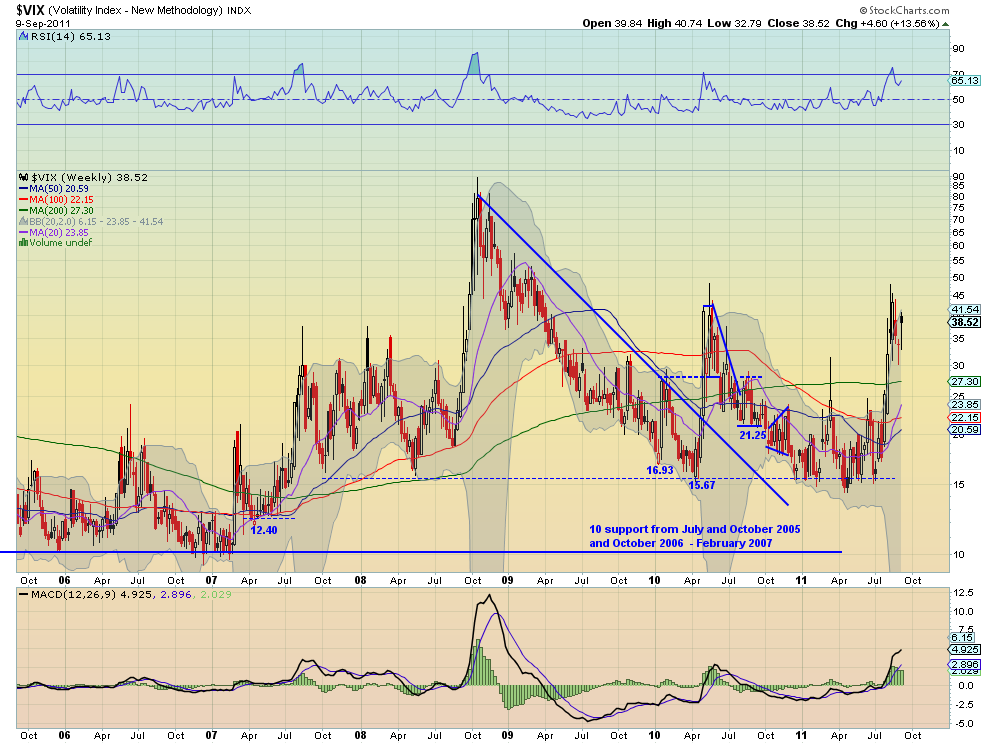
VIX Weekly, $VIX

Volatility continues to remain elevated. The daily chart is sporting a descending triangle and is testing the top side resistance with a RSI that refuses to fall back below 50 and a MACD that is improving quickly. The RSI and MACD on the weekly chart equally are supportive of further upside in volatility. Look for volatility to continue to remain high next week with a move above 40 and then 45 triggering a target of 58. It would take a break below 30 to change the mood and expectations for a move to support at 28 or 23 lower. The charts do not show that now.

SPY Daily, $SPY

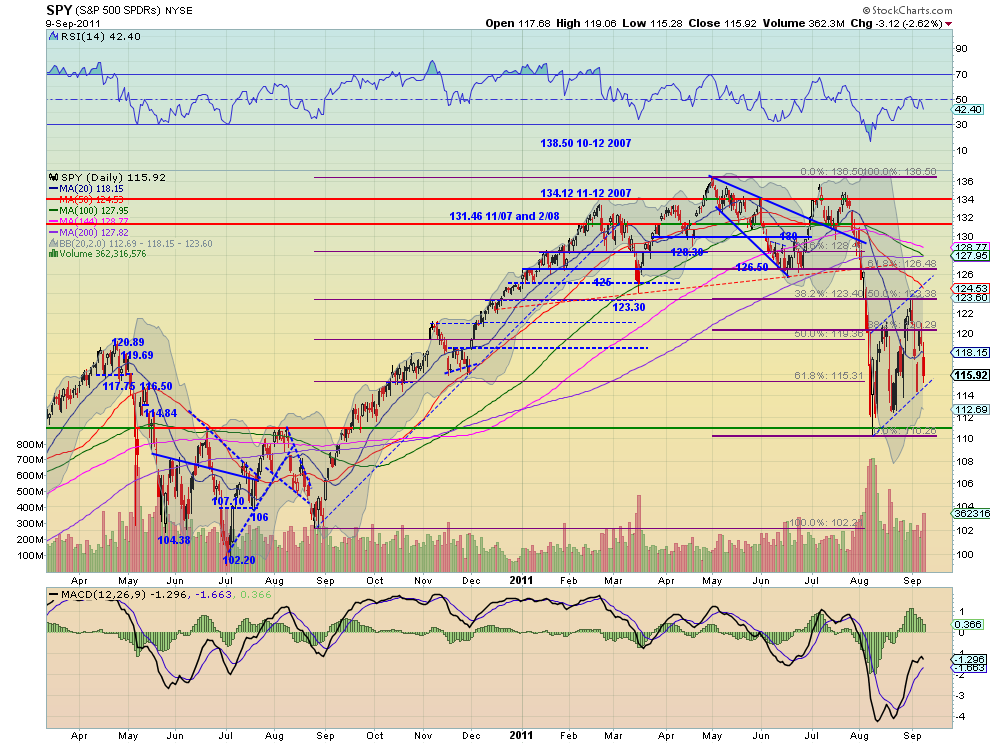
SPY Weekly, $SPY

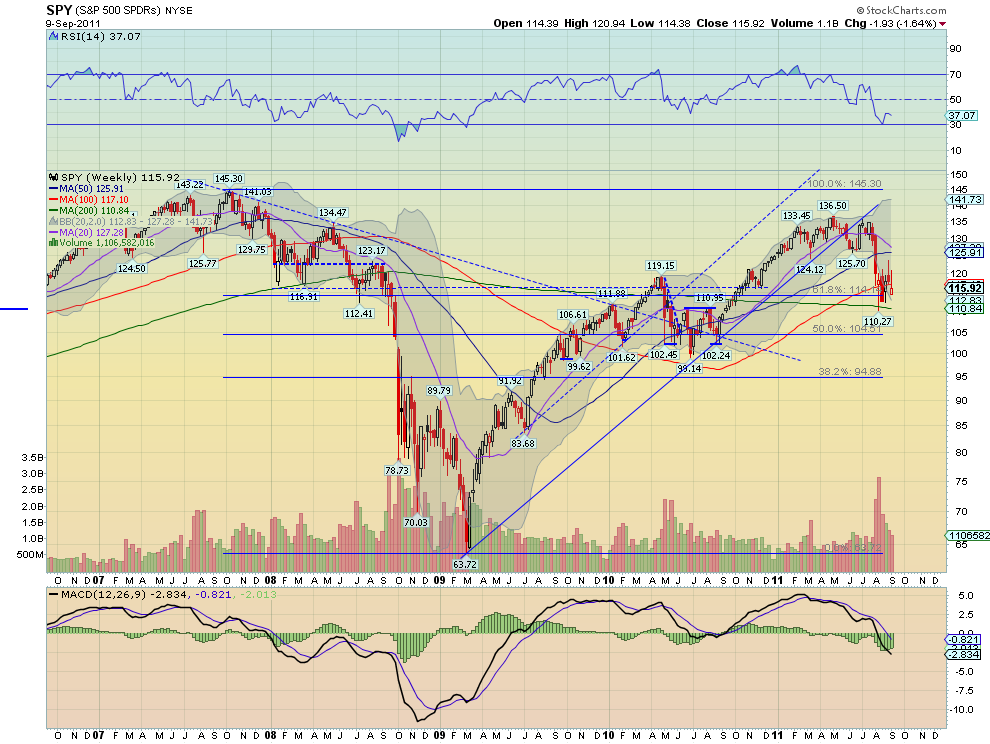
The SPY continued in the bear flag this week moving back lower after rejecting a retest at the 38.2% Fibonacci level from the broad move lower. It has a RSI that also rejected at the mid line and is heading lower on the daily chart and a MACD that continues to fade. The weekly chart shows the RSI bounce off of the 30 level fading back towards it and the MACD remaining negative. The downtrend remains for next week. If it breaks the flag lower under 115.30 there is support at 111.15 and 104 on the way to a target of 95-100. Any upside should find resistance over 121.50 at 123.30. Above that the trend may be changing.

IWM Daily, $IWM

IWM Weekly, $IWM

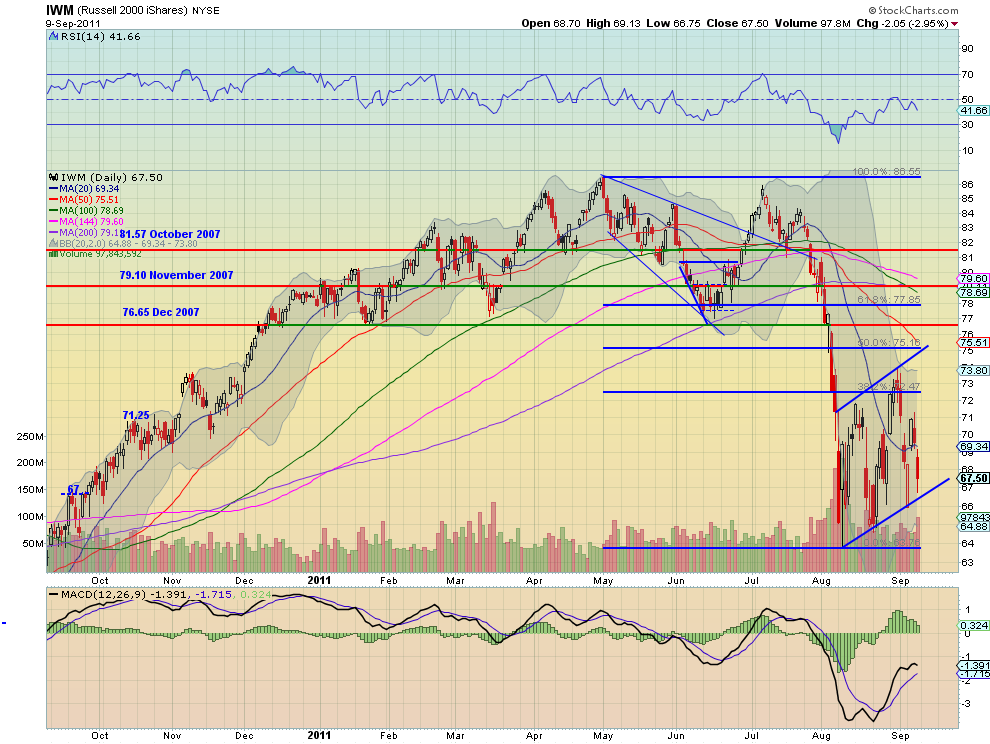
The IWM moved in its bear flag this week, moving back lower after rejecting at resistance at 71. It has a RSI that rejected at the mid line and is heading lower on the daily chart and a MACD that continues to fade. The weekly chart shows the same RSI bounce off of the 30 level fading back towards it and the MACD remaining negative. The downtrend remains for next week. If it breaks the flag lower under 66 there is support at 62.80 and 58.68 on the way to a target of 44. Any upside should find resistance over 71 at 73.60. Above 75 the trend may be changing.

QQQ Daily, $QQQ

QQQ Daily, $QQQ

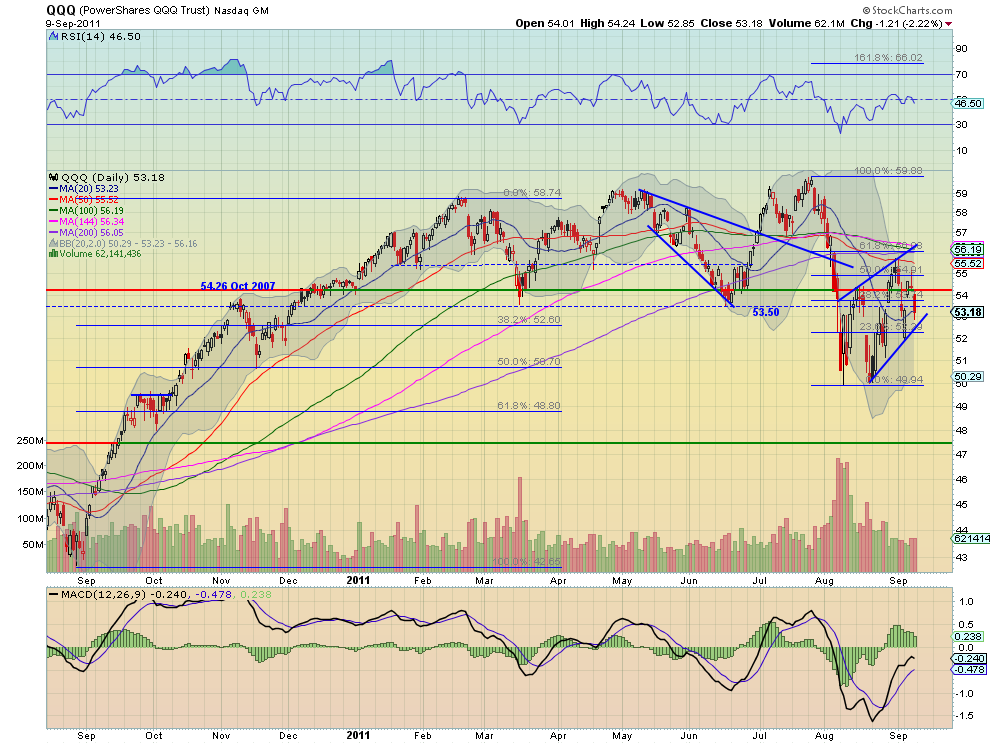
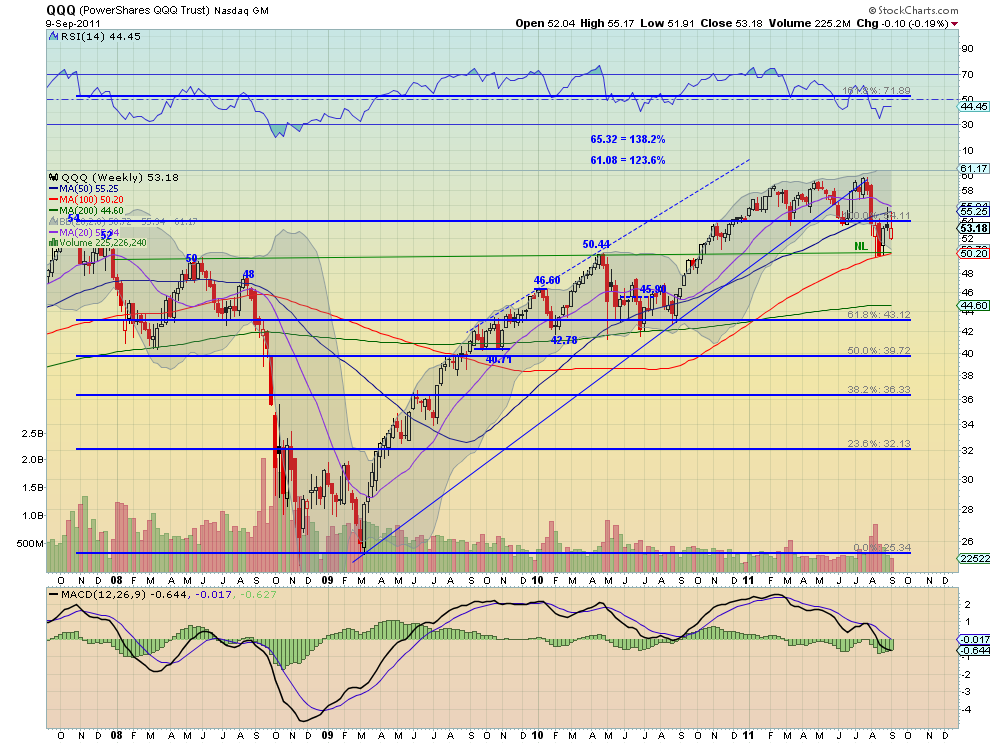
The QQQ moved in its bear flag as well, moving back lower after rejecting at the 50% Fibonacci level. It has a RSI that rejected near the mid line and is heading lower on the daily chart and a MACD that continues to fade. The weekly chart shows the same RSI bounce leveling and the MACD remaining negative as the flag sits on the 100 week Simple Moving Average (SMA). The downtrend remains for next week. If it breaks the flag lower under 52.60 there is support at 50.03 on the way to a target of 46-46.60. Any upside should find resistance over 55.50 at 57. Above that the trend may be changing.

The coming week looks positive for US Treasuries and the US Dollar Index. Gold looks to continue to be biased higher and Crude Oil lower, but both may also continue in the respective bull and bear flags. The Shanghai Composite and Emerging Markets continue to favor the downside. Volatility looks to remain elevated with a bias towards heading higher. This backdrop suggests favoring a downside bias in the US Equity Index ETF’s SPY, IWM, and QQQ. They may continue to hold their bear flags but a big push higher in the US Dollar Index and US Treasuries are likely to push Volatility higher out of its range and lead to the Equity flags breaking lower. Use this information as you prepare for the coming week and trade’m well.

The Week Ahead: Fasten Your Seatbelts


A further down move would not be surprising next week, but we’re unlikely to see a repeat of August’s panic selling, and certain stock groups are still attractive buys, writes MoneyShow.com senior editor Tom Aspray.

After a see-saw week, stocks were punished on again Friday. The action was even worse than what we saw before Labor Day weekend.

This time the financial media reported that stocks were lower because of Obama’s job plan, the surprise resignation of Germany’s top representative on the ECB’s executive board, and worries over a default by Greece.

From a technical standpoint, last week’s action just completed the rebound from the August lows. The sharp drop after the Labor Day weekend caused further deterioration in the technical outlook.

The mid-week rebound—in reaction to a sharp rally in the German Dax index—created another good selling opportunity. The German market was boosted when their constitutional court rejected lawsuits filed to block Germany’s participation in the Eurozone rescue funds. Thursday’s lower close set the stage for Friday’s drop.

If the key support levels are violated early this coming week, it is likely to trigger another wave of selling—but I doubt it will have the panic qualities of what occurred in August.
chart
Click to Enlarge

There was little apparent reaction in the equity markets last week to the surprising decision by the Swiss National Bank to stem the Swiss franc’s sharp rise. The safe haven status of the franc has caused a dramatic surge in the currency, not only against the US dollar but also against the euro.

This long-term chart from the Financial Times shows that the Swiss franc has had a dramatic rise against the euro since early in the financial crisis, when it was trading at 1.6 francs/euro. Early attempts to intervene were unsuccessful, and finally they stopped in 2010.

Last month, the franc surged versus the euro and hit parity. After pulling back from these extremes, the franc again started to rally last week, which prompted the Swiss to act. After some slight weakening, the franc started to again turn higher.

The decision to stop the franc from dropping below 1.2 per euro caused a sharp rise in other currencies like the Norwegian krone, as investors looked for another safe haven. While Norway can cut rates to help stem the Krone’s rise, Brazil and Japan have fewer choices.

Brazil just cut rates in the hope that it could escape a global slowdown, while Japan’s rates can’t go much lower. As I discussed last week, Japanese investors have been making a large bet on the Brazilian economy, and negative sentiment on the emerging markets by US investors is making them ones to watch.

Key Levels to Watch


Stocks and crude oil have rebounded nicely from the early Tuesday lows, but the daily charts suggest that Friday’s action may be critical. The key levels to outlined below need to hold to keep the uptrends intact.

Many of the major averages show similar formations, as the rebounds from the August lows have just reached strong areas of retracement resistance.

Though the stock-market averages and the ETFs that track them have not moved above last week’s high, crude oil did make new rally highs on Wednesday. As I discussed last week, crude oil and the Spyder Trust (SPY) often trace out similar chart formations.

Therefore, watching the key support and resistance levels on both, as well as some of the other key market averages, can often give you advance warning of a breakout in the other markets. If any of the key support levels are violated today it is likely to set the tone for next week’s action.
chart
Click to Enlarge

Chart Analysis: The Spyder Trust (SPY) came very close to the 50% retracement resistance at $123.72 last week, as the high on August 31 was $123.51. The more important 61.8% retracement resistance is at $126.90.
  • Tuesday’s drop tested the lower boundary of the flag formation, line b. A break below $114.38 should signal a drop at least to the $112.41 to $110.27 area
  • The 127.2% downside target from the flag formation is $106.65
  • The NYSE McClellan oscillator hit overbought levels at +264 last week, but has now broken its uptrend, line c. It often leads prices, and may be signaling a break of key price support levels
  • The McClellan oscillator closed just above the zero line and it will take strong A/D numbers Friday to turn it higher
  • There is initial resistance for SPY at $121, with the upper boundary of the flag formation (lines a and b) following in the $124.80 area
The Nasdaq Composite retested the early August lows on August 19, which is in contrast to the action in the S&P 500. This suggests better relative performance…and the Composite did show better relative strength last week.
  • The Nasdaq did slightly exceed the 50% retracement resistance at 2,609 last week, and came very close to the declining 40-day MA
  • The more important 61.8% resistance stands at 2,675 and this level needs to be overcome on a closing basis to turn the outlook more positive
  • The McClellan oscillator on the Nasdaq shows a similar but slightly more negative formation than that on the NYSE. The former uptrend, line e, was just tested Wednesday, but it is now back below zero
  • If prices break below the August lows, the McClellan oscillator could form a positive divergence
  • There is short-term support now at 2,480 with more important levels in the 2,400 area
chart
Click to Enlarge

The Dow Jones Transportation average has led prices on the downside since the weekly on-balance-volume (OBV) formed a negative divergence in May.
  • The current chart shows a short-term flag formation, lines b and c. The rebound from the August lows has been weaker, as it just retraced 38.2% of the prior decline
  • The longer-term downtrend, line a, is in the 4,900 to 5,000 area
  • Volume on the rebound has not been impressive, as the daily OBV is still below short-term resistance, line d. The weekly OBV (not shown) is still negative
  • There is short-term support now at 4,380, and a drop below 4,270 (line c) would complete the flag formation
  • This would give downside targets in the 3,950 area
The chart of the November crude oil contract shows that prices are reaching the apex of its flag formation, lines f and g. Wednesday’s high at $90.67 was below the 38.2% retracement resistance at $91.35 and the downtrend, line e, is in the $93.80 area.
  • The OBV showed good strength last week, but has once again turned lower. It is still above its support (line h) and its rising WMA
  • The weekly OBV (not shown) is slightly positive, but needs a positive close for the week (above $86.70) to keep it positive
  • The support from the flag formation (line g) was broken early Tuesday, and therefore Tuesday’s low at $83.47 and the chart support at $83.30 are the key levels to watch
  • A completion of the flag formation has downside targets in the $72 to $73 area
What it Means: As I discussed in detail in this week’s trading lesson, flag formations are generally continuation patterns or pauses in a major trend. This does not bode well for the market over the near term.
Here are some key support levels to watch.
  • Spyder Trust (SPY): $114.38
  • SPDR Diamond Trust (DIA): $109.18
  • PowerShares QQQ Trust (QQQ): $51.91
  • iShares Russell 2000 (IWM): $65.93
  • iShares Dow Jones Transports (IYT): $77.24
  • November Crude Oil: $83.30
A break of these levels will signal a drop back toward the August lows, but it is possible that these lows will hold. The formations do not require that the markets drop significantly below the August lows, but it cannot be ruled out.

How to Profit: Over the past several weeks, I have suggested that investors use a market rally to retracement resistance to lighten up on those stocks that are acting weaker than the market, as well as to hedge their other holdings.

Though I think the Spyder Trust could test the $110 to $112 area, the high option premiums make specific put recommendations more difficult.

Bull call spreads on one of the inverse ETFs would allow one to participate in a decline, but with limited risk and reward.

See the original article >>

Gold and Silver Final Parabolic Upswing? Comparison of Two Bull Markets


In a nutshell, this week we decided to provide you with the analysis of the previous bull market in the precious metals. The goal is to see how the current bull market compares with the previous one. After all, since history rhymes, looking at the analogy should provide us with clues as to what can happen next. In particular, we will be able to estimate if we’re currently on a verge of the final parabolic upswing and if this bull market is likely to end soon.


The above chart presents the DJIA:Gold ratio in two time spans: 1950-85 (red line) and 1999-2011 (golden line). The 1999-2011 has been superimposed on the older data. The chart points to the fact that in the period between 1965 and 1975 the ratio had been falling roughly in the same way it did between 1999 and 2011. We live in a globalized world, so looking at gold’s price relative to stocks might be more appropriate for long-term tendencies than a look at the gold price itself, simply because the major shift in investor’s sentiment happens when investors prefer gold to the most popular investment class – stocks.

The methodology here is, therefore, to compare the decline in the DJIA:Gold ratio around the 70’s bull market and compare it to the decline seen in the more recent years. Things to look at include the size of the decline, the time it took before the decline ended and the overall shape of the downswing.

As far as the size of the decline is concerned – in both: time and range – the slide seems far from being over – which means that the bull market in the precious metals is likely to continue. The analysis of shape confirms that both bull markets are indeed similar. However, the most interesting implication is based on the late 1974 rally in the ratio.

As we see that 1974 and 1975 marked a significant trend reversal, we might expect a similar move to happen in the near future. This would imply a significant correction in the precious metals sector and possible rallies in the general stock market before the precious metals sector regains its strength and continues moving up.

Clearly, this is not the time to stop paying attention to warning signs about a possible decline in the precious metals. Let’s take a look at the gold chart.


In the chart above, you see the price path of gold in the years 1999-2011 (golden line) superimposed over gold’s price path between 1950 and 1985 (red line). The vertical axis represents the older data while the values of the recent data have been rescaled to properly reflect the corresponding price changes. After a short comparison you might notice that today gold seems to be in a similar situation to where it was in 1975. This would suggest that we are in for a significant correction in the precious metals sector before the bull market resumes. It would also imply that any correction seen in the following month would not end the current bull.


The above chart is similar to the previous one, except for the fact that it presents silver, not gold. Once again, the current bull (green line) has been superimposed over the price path between 1950 and 1985. Even though the price paths here are less similar than in previous cases, they still point to the fact that the silver rally might be followed by a substantial short-term correction or at least by a sideway trend. Just as in the previous cases, this should not be perceived as the end of the current bull.

Summing up, there will be a time gold and silver move straight up without any corrections, but analysis of the previous bull market suggests that this moment is still years from today. Moreover, this is not the time to stop paying attention to signals indicating a significant correction around the corner. Finally, this is not the time to stop trading the precious metals market (in general).

To make sure that you are notified once the new features are implemented, and get immediate access to my free thoughts on the market, including information not available publicly, we urge you to sign up for our free e-mail list. Gold & Silver Investors should definitely join us today and additionally get free, 7-day access to the Premium Sections on our website, including valuable tools and unique charts. It's free and you may unsubscribe at any time.

See the original article >>

Only twice in the last 11 years (2000 & 2007) have all of my directional weekly moving averages turned down into a negative crossing, which subsequently confirmed that an acute, intermediate-term bear phase was underway.

In 2000, after the downside moving average inflection point, the S&P 500 declined from 1380 to 768 (-45%), and in 2007 the SPX declined from 1475 to 666.79 (-55%).

Looking at the weekly chart of the SPX, let's notice that all of my intermediate-term directional moving averages are pointed down, which in and of itself argues strongly that the dominant trend direction is down, with the "fast" 13-week MA having crossed beneath the declining 26- and 52-week MAs early in August.

The 26-week MA also is pointed sharply to the downside, but has not crossed beneath the 52 week MA. That said, any net weakness next week will assure such a downside crossing, thereby triggering a completed negative weekly moving average sell signal -- the third such signal since 2000.

This is an apparent pre-condition for a potentially very powerful decline -- or, in the current case, downside continuation towards optimal target zones at around 1000, and possibly 800 thereafter.


Follow Us