Analyzing last week's CFTC Commitment of Trader data continues to confirm our assumption that ever more speculators are honing in on rice as the fulcrum commodity. Jumping to a fresh year high of 6,652, non-commercial net spec contracts are the highest they have been since December 2009, when they hit 6,773, and approaching the record from early 2008. Yet while the price of rough rice in late 2009 was comparable to recent price levels in the $16 region, the peak from early 2008 was 50% higher, approaching $25. Therefore it is safe to assume that should speculative interest continue surging at the current rate, and if it were to approach the spec exposure of ~8,000 last seen in early 2008, then the price of rice has a long way to go...
And some other CFTC charts, confirming that spec exposure in grains and softs continues to be near recent all time highs:
Looking at the 2, 5 and 10 Year Treasury spec exposure, we see a huge plunge in 2 Year spec positions, which dropped by 100k in the past week, the biggest drop in over a year, as increasing more spec are worried that the short end is about to surge. There was also a pick up in 10 year spec contracts, confirming that specs are expecting a flattening of the curve.
Lastly, and no surprise here, dollar non-commercial net specs have dropped to a fresh multi year low, declining by 3.8K contracts W/W to -7.4K. There was a modest increase in Yen and GBP specs, and a modest decline in CHF and EUR positions.
It amazes us that in the 11th year of the gold bull market, there are still so many people around who fail to understand gold on the most basic, fundamental level. One of them is of course none other than the Big Cheese of the Fed himself, Ben Bernanke. However, while everybody should be slightly worried by the Fed chief's admission that he 'doesn't understand gold', and is 'puzzled by its price rally', he is at least admitting it. The irony is of course that he, Bernanke, through his actions, is one of the chief instigators of gold's price strength.
Before we delve into this further, we would like to point out that there has been a proliferation of articles recently that bemoan the allegedly short term bearish technical condition of gold and gold stocks. Here are two well-reasoned examples – the first one is by Chris Vermeulen at Minyanville , the second by long term bull Dudley Baker at Goldseek.
The reason why we want to briefly comment on these articles is that quite a number of slightly worried gold bugs (gold bugs are, by dint of bitter experience, always worried that victory will be snatched away at the last moment) have pointed them out to us.
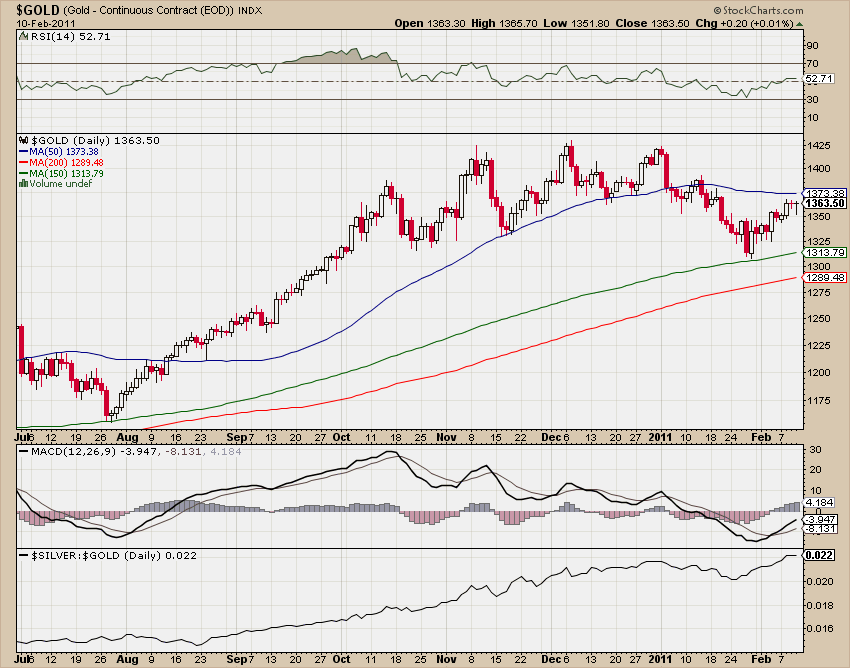
Gold: bounced from the 150 day ma, still below the 50 day. Alas, it is not overbought and MACD is on 'buy' – click for higher resolution.
Looking at gold's chart above, we would note that, yes, it is close to a zone of short term resistance. Alas, there is no evidence yet that the recent decline was anything but a small routine pullback. For gold to indicate that it was more than that, it would have to first break below its recent lows and the 150 day ma it bounced from.
Apart from this technical indecision – neither bulls nor bears can prove much with the help of this chart because neither a breakout to the upside nor one to the downside has occurred as of yet – we would note that gold actually never tends to top out in a 'triple top' type formation.
It normally doesn't happen because this is a very emotional market, in the latter stages of rallies often driven by naked fear. Fear produces spike tops, not lengthy distribution tops. The latter are far more frequent in the stock market (which works exactly the other way around actually, by producing rounded distribution tops and spike lows).
In addition, the mere fact that worried gold bugs are pointing us to these articles is anecdotal evidence of the current widespread uncertainty that is fully confirmed by quantitative sentiment data as well.
Mark Hulbert's HGNSI (a measure of the average recommended gold exposure by gold timers) briefly went negative at the recent lows, the Rydex precious metals fund lost over 40% of its assets due to outflows and open interest in gold futures and the net long speculative position have dropped to two year lows.
While this is obviously not a guarantee for a particular outcome, these facts support the bullish rather than the bearish case. The one thing that looks a bit worrisome for bulls is the fact that many other commodities have recently made blow-off-like moves to the upside and may be ripe for a correction.
Widespread weakness in the commodity sector would likely weigh on gold as well – alas, no such weakness has occurred as of yet.
To come back to what we wrote at the beginning – amazingly, gold remains widely misunderstood by market analysts. Many people will be familiar with Kitco's chief gold analyst Jon Nadler, who continues to analyze gold as though it were the same as copper or aluminum. In his worldview most gold fans are probably slightly loopy, a view that is colored by the fact that the conspiracy fringe in gold bug-land has chosen Nadler as one of its favorite enemies (he's easy to make fun of admittedly). This is due to the fact that he has remained steadfastly bearish throughout the most persistent bull market of the past decade. Why is he bearish? He doesn't understand gold, that's why.
This is yet another great irony of course – the 'chief gold analyst' of one of the biggest precious metals trading firms in the North Americas (Kitco is based in Canada) actually doesn't understand the gold market. It would be difficult to make this one up.
Meanwhile, a very recent example of someone suffering from a similar affliction has been provided by David Berman in the 'Globe and Mail' under the title 'The Case Against Gold'. Even if there were a 'case against gold' (right now there really isn't), this could not possibly be it.
Berman makes -similar to Nadler – the often seen mistake of thinking of gold as though it were an industrial commodity. He regales his readers with statistics of annual jewelry demand, mine supply and central bank selling. He somehow forgets to mention that the all time record high in jewelry demand was recorded in 1999 – at the very low point of a 20 year long bear market in gold. We don't recall seeing any articles at that time arguing that 'record jewelry demand means that gold prices must go up'. As it were, jewelry demand is completely immaterial to gold's price – as are all the other 'fundamental factors' (mine and scrap supply, central bank selling) Berman cites – including the alleged 'impact of exchange traded funds'.
Just about the only thing that contains a grain of truth is Berman's statement that
The bullish argument for gold rests primarily upon fear – the fear that paper currencies are being devalued by governments and central banks; the fear that the world is awash in money, which will lead to problematic inflation; and the more general fear that the world is falling apart, and prudent doomsayers will need more than shotguns and tins of beans to survive.
There is nothing new about these fears. But in recent years, they have gained heft as terrorist attacks, stock market collapses, Wall Street implosions and creative monetary policies have rattled investors’ confidence in paper currency.
Yes, fear of the devaluation of paper currencies plays a big role in gold's rally. Not only the 'fear' of same of course, but the quite obvious fact of same. As we recently related, US true money supply TMS-2 is close to tripling from its level a decade ago. So we are well beyond the stage of 'fear of devaluation' by now into the realm of actual, massive devaluation. It is true that therefore, 'investor confidence in paper currency has been rattled'. It's the 'creative monetary policies' (why printing gobs of money is considered 'creative' is not quite clear to us, unless it was meant to be sarcastic) that have done it. Note here that the influence of 'terrorist attacks' on gold can be safely ignored, as it rarely lasts beyond a few hours of trading (as an example, the WTC attack occasioned a $20 one day spike in gold that was given back in its entirety over the following two weeks).
It is a pity that Berman didn't think this particular argument about currency devaluation through further – instead he segues from there into discussing gold ETFs, which he deems to be the chief culprits of gold's rally. Gold ETFs have made investing in gold easier for institutions and retail investors alike, and as such have certainly paved the way for a little more gold investment at the margin than would have otherwise occurred. However, the assumption that they are an indispensable major factor in determining gold's price is just as flawed as the assertion that jewelry demand has an important impact. In reality, all these things are but a drop in the ocean.
As we have pointed out previously, the chief mistake Berman, Nadler et al. make is to regard gold as a commodity akin to an industrial commodity like e.g. copper, the stocks of which are regularly used up. For more background on this, look at 'Some Thoughts on Gold' Part One and Part Two . In part two, we criticized a similarly flawed analysis of gold that was published in the WSJ last year.
The total stock of gold in the world is about 165,000 tons. All of it still exists. Annual mine supply of 2,500 tons, jewelry demand of 1,700 tons and the largest gold ETF's holdings of 1,250 tons are insignificant compared to this accumulated stock. At the LBMA (London Bullion Market Association), the annual mine production of gold is turned over in trading every three to four business days. All the jewelry makers in the world could basically buy their entire fabrication stock in less than three trading days there – and that is only the LBMA. There is quite a bit of gold trading going on in other ventures such as Dubai, Zürich, New York and Shanghai as well.
Gold is not analyzable as a commodity that gets 'used up' in industrial processes. Its large stock-to-flows ratio indicates that it must be analyzed as what it really is, a currency, or a financial asset. It is the reservation demand of the current holders of this large stock of gold that is the most important factor in its valuation. It should be quite obvious in this context that reservation demand encompassing 165,000 tons of gold will not be influenced much by a central bank selling 100 tons here or an ETF gobbling up 50 tons there.
In short, it is monetary or investment demand, which in turn is technically divisible into outright new demand and reservation demand, that is the main driver of gold's price. If one wants to analyze gold's likely price trend, it would be perfectly legitimate to completely ignore annual mine and scrap supply and annual industrial and jewelry demand for gold. One might perhaps mention these as 'marginal factors', but they really are unimportant in terms of the bigger picture. Instead, one must concentrate on the factors driving above mentioned monetary demand.
These factors are, in no particular order:
the level of real interest rates (i.e., nominal interest rates minus market-based inflation expectations),
the dollar's exchange rate,
the rate of growth of the true money supply,
the steepness of the yield curve,
credit spreads (and other indicators of waxing or waning economic confidence),
the desire to increase or decrease savings, and
confidence in government, the monetary authority and the financial establishment generally.
One thing we can take away from Berman's article is that there are still quite a few people out there that need to be apprised of the gold market's workings. This in turn means that there remains a large source of potential gold demand that is as of yet untapped. People who don't understand gold are likely to be wary of buying it upon hearing that 'jewelry demand has fallen precipitously'. After all, on the surface it sounds like just the thing that might be bearish. In reality, jewelry demand is but a tiny component of overall gold demand and its most price elastic one to boot. Note here that a certain percentage of jewelry demand is actually part of the investment demand for gold. This is especially true in India, where 'bullion jewelry' is sold at a very small mark-up to the spot price of gold and used not mainly for adornment, but as a form of savings.
In any case, it seems important to us that the flaws in Berman's analysis and similar attempts to disparage gold investment on the basis of irrelevant data be pointed out. We would add to this that the situation has actually improved somewhat in recent years in terms of mainstream analysis provided by banks and investment banks, which is certainly a gratifying development.
Lastly, we want to point readers to an article that has recently appeared at Zerohedge – the Dutch Central Bank is unhappy with a pension fund allocating too much money to investment in gold and is ordering it to divest. It is interesting in this context that government debt securities are apparently exempted from the 'prudent man' rule that is supposed to stand in the way of this 'concentration risk'.
Ironically, yields on Portuguese government bonds hit a fresh all time high just as this order was handed down – so government debt is deemed a 'prudent investment' even if it goes to hell in a hand basket, but gold is 'too risky'. The Dutch Central Bank makes the same analytical mistake as Berman - it keeps referring to gold as a mere 'commodity'. The pension fund on the other hand points out in its deposition that gold is actually – gasp! – money.
Federal regulators announced Friday that farmers can plant a corn genetically engineered for ethanol production as early as this spring. But as the corn and ethanol industries celebrated the decision, critics of genetically modified crops sounded warnings, saying the corn could contaminate food supplies.
The corn, which is designed to make ethanol processing more efficient, was developed by Monsanto competitor Syngenta AG, based in Switzerland. Monsanto, based in Creve Couer, does not market a corn specifically modified for ethanol growth or production, but does sell a hybrid variety geared to ethanol.
For Midwestern corn growers, the announcement by the U.S. Department of Agriculture's Animal and Plant Health Inspection Service came as good news.
"What it means for producers is that there's a new specialty market that's being developed," said Nathan Fields, a spokesman for the Chesterfield-based National Corn Growers Association. "This gives them a chance to diversify."
Last year, 86 percent of American corn was grown with genetically modified seed. About 40 percent of the nation's corn is converted to ethanol. But the Syngenta corn will be the first on the market that is engineered specifically for ethanol and processing improvements.
The corn, while it will not be marketed for food, was deemed safe as food or feed by regulators in 2007. But the food industry, particularly corn millers, have said that any cross-contamination into the food supply could be ruinous to their businesses, because it could diminish the quality of corn products, and could be damaging to export markets that don't allow genetically modified foods.
Syngenta has said that farmers who grow the corn will enter into "closed loop" agreements that require them to sell the corn only to certain ethanol processors, thereby minimizing the risk of contamination.
The Canadian government has also approved the cultivation of the Syngenta corn. The company plans to work with small groups of growers and plants in western Nebraska and Kansas, and will broaden production next year.
Advocacy groups point to previous control problems. From 2001 to 2004, Syngenta accidentally sold a corn variety, called StarLink, to American farmers without approval to do so.
"The resemblance to StarLink is uncanny," said Bill Freese, of the Washington-based advocacy group, the Center for Food Safety. "Much like StarLink, Syngenta's corn poses allergy concerns and is not meant for human food use."
Margaret Mellon, of the Union of Concerned Scientists -- a nonprofit science advocacy group that seeks greater regulation of genetically modified food -- argues current safeguards won't prevent contamination.
"There is no way to protect food corn crops from contamination by ethanol corn," Mellon said. "Even with the most stringent precautions, the wind will blow and standards will slip. There are no required precautions."
Iowa farmers have seen this one before: Corn prices go up, and so do fertilizer prices.
But this time, fertilizer prices may stay high longer than normal. That will cut into farmers' profit margins and possibly discourage them from planting more corn acres when supplies of corn are the tightest since the mid-1990s.
In 2008 corn prices briefly reached above $7 per bushel. By early 2009, nitrogen prices, in the form of anhydrous ammonia, more than tripled to $900 per ton. Last year things quieted down, with corn below $4 per bushel and nitrogen back in the $400- to $450-per-ton range.
Now corn is soaring again, at 30-month highs near $7 per bushel. Right on schedule, nitrogen has jumped to as much as $780 per ton.
"We see this every time corn prices go up," said Harry Ahrenholtz, executive vice president for agronomy for West Central Co-Op in Ralston, which sells fertilizer at its 24 elevator locations in central Iowa. But this year's fertilizer price surge has a key difference, one that suggests that unlike 2008, the high prices won't fall back.
The 2008 prices were driven by record prices for natural gas, the key catalyst in turning oxygen into nitrogen.
This year natural gas has fallen back to about $4 per thousand cubic feet, less than half its price of mid-2008. Yet fertilizer prices are approaching their 2008-09 highs.
"Natural gas prices have less to do with the price of anhydrous now," Ahrenholtz said. This time the upward pressure comes from the competition for fertilizer from farmers in China, India and South America.
"Demand is very heavy in international markets now," said Dave Coppess, executive vice president at Heartland Co-Op in West Des Moines, which sells fertilizer from 50 cooperatives between Guthrie and Iowa counties.
"Farmers are in a world market for fertilizer," he said. "It's a situation much like the market for oil; as agriculture expands in other countries demand rises all over." Anhydrous ammonia, the most widely used fertilizer for corn, is up 57 percent in price from a year ago. Phosphorus is up 46 percent, urea up 17 percent and potash (also referred to as potassium) up 15 percent.
Higher fertilizer prices are a tipping point in the battle for acres between corn and soybeans.
Corn needs nitrogen, particularly if planted on the same ground two years consecutively.
Soybeans need some phosphorus and potash but don't require the 140 pounds of nitrogen per acre that corn needs. Also, farmers have agronomists from the extension services and seed companies looking over their shoulders, and most experts frown on corn-on-corn repeat plantings.
"When you're getting near $14 per bushel for soybeans, farmers will think hard before they change their normal rotations," said Randy Hertz, owner of a Nevada-based farm management company.
"Most farmers do their corn and soybeans on a 50-50 rotation, and don't like to change," Hertz said. For that reason most early surveys of farmers' intentions show that corn will gain about 2.5 million to 3 million acres above the 88 million acres planted nationally (12 million acres in Iowa). But commodity traders say corn needs an additional 5 million acres nationally to alleviate the tightest domestic supply situation since the mid-1990s.
The U.S. Department of Agriculture pegged supplies last week at less than half the 1.7 billion bushels of corn in reserve a year ago. Those tight supplies are the prime reason the price of corn has shot up from $3.50 per bushel last June to $6.50 per bushel this month. Some analysts predict that corn prices will drive through the $7- to $8-per-bushel level if those 5 million more acres of corn plantings don't materialize by March 31, when the USDA reports on its survey of farmer planting intentions.
Ahrenholtz and Coppess said fertilizer sales have been strong but don't indicate a major shift in acres to corn in Iowa.
A CEO who takes charge of a company in decline typically has one of two options: either act as caretaker of that decline, making it as painless as possible, or do something radical and risky.
Neither way is very palatable. We've watched the first option in Carol Bartz' management of Yahoo ( YHOO ). And you can now see the second option in action, with Stephen Elop's handling of Nokia ( NOK ).
Elop's High-Stakes Game
For outsiders, the Elop show is by far the more interesting spectacle, and not just because of the panache he brings to the dull art of the corporate memo . Or even because, by arranging a hasty partnership with Microsoft , Elop has managed to to alienate both Google ( GOOG ), by rebuffing its popular Android platform, and Intel ( INTC ) by junking its partnership in the Meego mobile OS.
What seems to have captured everyone's attention is the high-stakes, Russian roulette game Elop is playing. And nobody even knows how many bullets there are in the chamber of Elop's metaphorical revolver.
Considering where Nokia is today -- a mobile device giant with a shrinking global market share-- and where it wants to be -- a viable player in that global market -- a Nokia-Microsoft partnership makes sense. Elop also gets credit for forthrightly declaring that Apple's ( AAPL ) iOS and Google's Android are eating away at his company's customer base.
Sound Business Strategy?
From a strategy standpoint, there's some sound reasoning behind Elop's thinking. Most likely there is room for a third player at Apple and Google's poker table -- but Research-in-Motion's ( RIMM ) Blackberry, HP's webOS and Microsoft are all gunning for that coveted seat. Nokia wants in, too, but neither the Meego software it developed nor its high-end smartphones make it a strong contender: There may be only one Meego product in the market this year, if that many. Foregoing Android also makes strategic sense. Android may be helping to revive Motorola's (MOT) smartphone sales , but it's hard for an Android latecomer like Nokia to differentiate itself from Motorola, HTC and others. Besides, many of the $150 smartphones competing with Symbian phones abroad are powered by Android.
So, at least on paper, the deal sounds persuasive. Nokia brings with it a deep network of designers and suppliers, and a worldwide distribution system that will take its rivals years to equal. Microsoft has ready-for-market software that is winning mixed-to-positive reviews -- but it needs more mindshare among consumers and app developers. The strengths of each partner will match the other company's weaknesses.
But, of course, business doesn't happen on paper; it happens in markets. And sudden shifts in strategy like the one Elop is engineering can run into trouble, when it comes to executing new plans.
For one thing, the shift away from Meego and eventually Symbian is sure to be a morale-killer. HP and others have put out the word that any less-than-happy Nokia employees are welcome to help develop HP's webOS. And many at Nokia seem disgruntled: More than 1,000 of the company's workers staged a mass walkout on Friday.
Memo to Elop: Bad morale can weigh down a turnaround.
Investors vs. App Developers
Investors, meanwhile, have staged their own version of a walkout. Nokia's stock fell 14% Friday, erasing any gains the company had made since September. Another big concern is when will Nokia start selling Windows-based smartphones, especially given that the ink on its partnership with Microsoft has barely dried and some details still remain to be worked out.
But not all the reactions are negative. One group responding favorably to a Nokia-Microsoft tie-up is app developers: a community crucial to the success of the partnership. And according to Flurry, a smartphone analytics company, the number of new Windows app projects launched this week surged 66% , making Windows Phone 7 more popular than Android among developers for the first time.
In Elop's now-famous memo he conjured up the image of a man on a burning oil platform, jumping into icy waters to save his life. While the jump may be scary, the hardest part is swimming to safety. Nokia has jumped -- now it has to swim. And if developers can throw Nokia a lifeline, the company just might make it.
Hundreds of women will take to the streets of Italy’s cities today calling on scandal hit Premier Silvio Berlusconi to resign after prosecutors requested he be sent to trial for having sex with an underage prostitute.
Protesters say evidence leaked from the probe into Berlusconi, 74, allegedly paying for sex with then 17 year Moroccan belly dancer Karima El Mahroug, and show he has little respect for female dignity.
Wiretaps leaked from more than 600 pages of the prosecution file suggest he surrounded himself at parties at his home with starlets and other women hoping to use their looks to gain positions in politics or within his Mediaset TV empire.
Protests are scheduled to take place in 200 cities and towns across Italy as well as London and New York, with the largest due to be held in Rome and Milan and counter demonstrations by activists from Berlusconi’s People of Freedom party area also planned.
Organisers have called the protest ”If Not Now, When?” which is also the title of a famous novel by the Italian award winning writer Primo Levi and which tells the story a group of Jewish partisans behind German lines during World War II as they seek to continue their fight against the occupier and survive.
Iaia Caputo, of the organising committee, said: ”The Ruby case has revealed a system of political selection based on an exchange of sex and power.
”If we accept this as normal, we risk prejudicing the free choice of women.
”We want to send a message to the country and to the parties that do not see themselves a part of what has happened over the last few weeks - it’s possible to change route”.
Men have also been encouraged to attend the rallies and prostitutes and nuns have also said they will attend to voice their anger and disgust at Berlusconi’s alleged lewd behaviour.
For almost a month now billionaire media tycoon Berlusconi has been in the spotlight over claims of stripping nurses and policewomen at his infamous ”bunga bunga” parties.
The phrase is said to refer to a crude after dinner sex game and Berlusconi has insisted that the regular parties he held at his mansion at Arcore near Milan were nothing more than convivial social events.
Following a tense meeting with Italian president Giorgio Napolitano about the scandal the respected daily Corriere Della Sera published a cartoon of the two men on its front page.
It showed Berlusconi telling the president: ”Bunga bunga is a perfectly innocent game - if you like I can show you”, which is greeted with a look of surprise from Napolitano.
The scandal seems to have had little effect on Berlusconi’s popularity with just a 5% drop in his approval ratings and polls show that if an immediate general election were held he would win.
He has plenty of supporters in Italy who agree with him, including many women, and they plan demonstrations in support of him outside the prosecutor’s office in Milan.
In a reference to his numerous battles with the Italian judiciary they plan to hold placards reading:”Hundred trials, no convictions equals persecution”, and ”Palace of Injustice”.
They claim his privacy has been violated by the investigation and are urging him to ”resist, resist, resist” as one supporter who was interviewed on Italian TV put it.
They are also urging women to show their support by going to pro Berlusconi rallies or not attending the demonstrations against him - popular Italian pop star Anna Tatangelo said she would not be taking part.
She said: ”I don’t think the protest will help the climate in Italy. It’s necessary to calm things down and restore order in the political situation and the basic things that concern our country. Don’t go and protest, think about how we can really get back up”.
Preliminary hearings judge Cristina Di Censo is not expected to announce before Monday or Tuesday whether she has granted the prosecution request to send the case to trial and if approved it could start as early as April.
Global rice production may rise to a record in the 2010 season following improved prospects in China, Cambodia and Thailand, the United Nations Food & Agriculture Organization, or FAO, said.
Rough rice production may be 700.7 million metric tons, or 467.3 million tons of milled grain, up about 3 million tons from a November estimate, the agency said in an e-mailed report. The forecast would be a 3 percent rise from the 2009 season, it said.
The price of rice, the staple food for half the world, may increase as a rally in the cost of wheat drives consumers to seek alternatives, Robert Zeigler, director general of the International Rice Research Institute, said Feb. 11. The forecast for record output depends on secondary harvests in the northern hemisphere in the next few months that would bring the 2010 season to a close, according to the FAO.
“Asia is anticipated to account for the bulk of the production increase despite several climatic setbacks experienced over the season,” the FAO said. “Larger crops are also forecast to be harvested in Africa, North America, Europe and Oceania.”
Major buyers return to market
Thai rice prices, the benchmark for Asia, advanced to the highest in more than a month, according to the Thai Rice Exporters Association on Feb. 9. The price of 100 percent grade-B white rice increased to $558 a ton, it said. Rough-rice futures on the Chicago Board of Trade declined 1.7 percent to $15.885 per 100 pounds on Feb. 11.
Countries in Asia were estimated to have purchased 15.4 million tons of rice in calendar 2010, almost 600,000 tons more than previously reported and 1.9 million tons more than in 2009, the FAO said.
International trade in calendar 2011 was likely to be 31.4 million tons, it said, slightly below a year earlier. Thailand’s exports may rise to 9.7 million tons from 9 million tons in 2010, more than the official target of 9.5 million tons, partly boosted by prospects for secondary crops, the FAO said.
International prices would be influenced by the return of major buyers into the market in the coming months, while the effect of climate on the secondary crops will need to be monitored after the first harvest of the season was disappointing in many countries, according to the report.
“Currency factors and developments in other cereal markets will also exert an important influence on world rice quotations in the coming months,” it said.
The world’s economy is powered by oil. Although coal produces most of the world’s electricity, there are alternatives in electric power generation: nuclear, solar, natural gas, and wind. But the cars and trucks that enable personal transportation, the transport of goods, and the mining of Earth’s raw materials, are all predominately fueled by derivatives of oil – gasoline and diesel.
This is a fundamental fact which investors should always remember. My opinion is that worldwide oil production will have much difficulty keeping up with worldwide demand and that, therefore, the world economy is on an economic yo-yo based on the rise/fall of oil prices. Stephen Leeb describes this in great detail in his wonderful must-read book The Oil Factor. Leeb has even developed a stock market indicator based on changes in oil prices.
In this article the case will be made that it is oil prices that drive gold prices. If my theory that oil prices are going much higher based on supply/demand fundamentals, and my theory is correct, this means gold will go much higher as well. Let’s take a look at history.
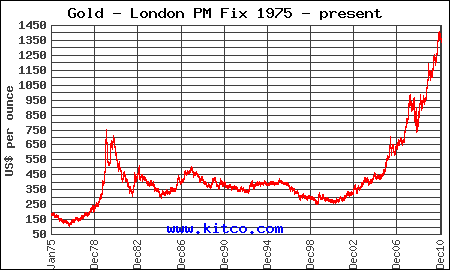
By now, most investors are familiar with the following historical gold price chart:
Now let’s take look at historical oil prices (click to enlarge images):
The charts show how oil prices drove gold higher after the oil embargo and Middle East turmoil of the 1970’s. In the 1980’s, we saw oil prices (and gold prices) decline as the embargo ended, Saudi Arabia pumped all-out to hurt competitors, and new supply from Alaska and the North Sea came online. In the new century, we once again saw oil prices drive gold higher on increasing oil demand, the Iraq war and decreased supply from Iraq, and a much tighter supply/demand equation. These events led to the 2008 oil price spike and subsequent blow-off we all remember all too well.
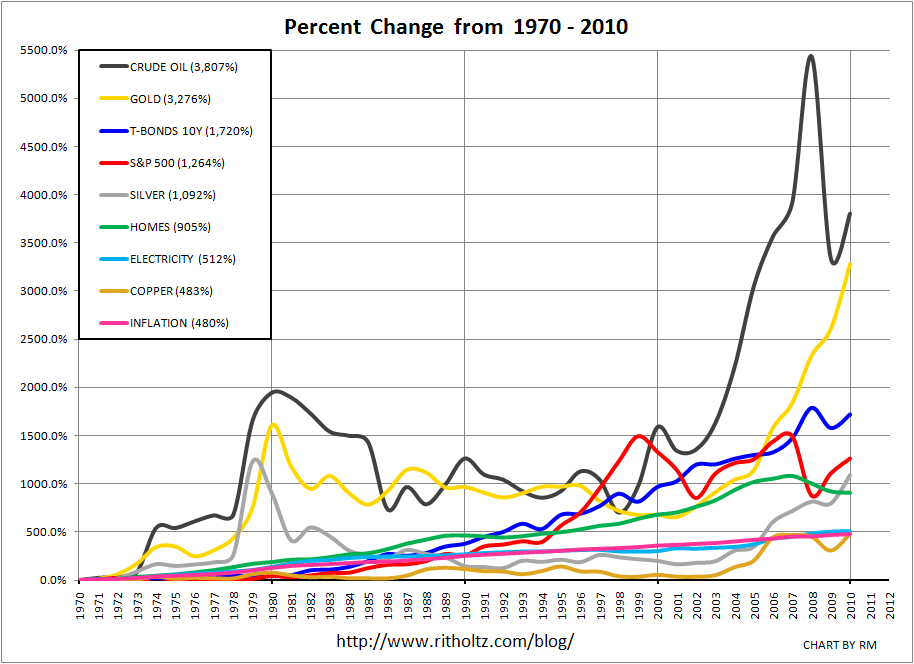
It is clear there is a direct relationship between oil prices and gold prices. Some would say the connection of gold is based more on inflation expectations. I would counter that it is oil that drives inflation and therefore ultimately oil that drives gold. Regardless, it doesn’t really matter who is right in that debate as the crust of the biscuit can be seen in this chart I found courtesy of Barry Ritholtz’s blog:
This excellent chart of the direct relationship between oil and gold prices clearly shows oil prices(black line) lead gold prices (yellow line). So, if one wants to know the direction of gold prices in the future, the question is simply:
Where are oil prices headed?
We’ve seen oil prices hit $147/barrel in the recent past, and I would say that is why gold has run to $1400/oz. Today, oil is around $100/barrel (brent crude) while the world’s largest consumer of oil, the U.S. at ~25% of all world oil production, has a sputtering economy and high unemployment. While it is true the United States is the third largest oil producer (after Russia and Saudi Arabia), it is also the world’s largest importer of oil at roughly 60% of all consumption (at a cost of over $1billion a day).
Meanwhile, China has overtaken the U.S. as the largest car market in the world. But gasoline powered automobiles are also proliferating throughout emerging markets – including India, the Middle East, and southeast Asia. Clearly oil demand is going to rise. Can oil supply keep pace? That is the subject of another article and clearly there are two very different opinions on this matter (you all know where I stand).
On the policy front, we now know after two years of Obama there is essentially no meaningful difference in Republican and Democratic energy policy. The country is still an oil centric country. We still have no strategic long-term comprehensive energy policy as the one I have been suggesting for years now. American refuses to utilize its #1 economic advantage against all other countries (its extensive natural gas pipeline system combined with its huge natural gas reserves) by adopting natural gas transportation. This even as other countries have proven that natural gas transportation works – it’s clean and it’s half the price of gasoline derived from foreign oil. And it’s domestic!
While the myth of the “clean coal”/electric car architecture has been embraced so eagerly by Congress, the media, and so-called environmentalists over the past 4-5 years or so, the U.S. could have used its stimulus dollars to build a natural gas re-fueling infrastructure that would not only pay for itself in a very short timeframe ($1 billion/day leaving the country for oil would pay for a lot of natural gas refueling stations…), we would have in the meantime reduced foreign oil imports by 5,000,000 barrels a day by transitioning only half the cars and trucks in American to run on nat gas.
Meanwhile, China is building 20 LNG terminals on its southern coast and is snapping up natural gas assets around the globe – particularly in Australia and, as of yesterday, Canada, when the announcement of an over $5 billion deal with Encana. It is clear China “gets it” and will surely adopt natural gas transportation on a large scale as soon as the infrastructure is in place, leaving the U.S. far behind. This is because China’s energy policy is predominately crafted by engineers while in the U.S. lawyers in Congress develop our “policy”.
China knows it needs to diversify away from oil while the U.S. is fighting oil wars so it can stay addicted to oil.
So, these wrong-headed policies are all tremendously bullish for oil prices and therefore gold prices. Additionally, we finally have an elected representative (Ron Paul) who understands the U.S. Constitution and realizes that the only form of money should be backed by gold and silver. He will hold Ben Bernanke’s feet to the fire on the Fed’s incompetent monetary and fiscal policies.
Perhaps even more bullish is the recent announcement by J.P. Morgan that the firm will accept gold bullion as collateral for stock transactions. Gold will be treated as the equivalent as U.S. Treasury bonds or other stock securities and can be used for leverage. This is way overdue - looking at the energy and fiscal policies of the U.S. and the inability of either political party to craft logical problem-solving solutions, it is clear gold (and silver) are superior “securities”. If these weren’t reasons enough to own gold, we also have hundreds of millions of Chinese and Indians who are acquiring wealth and are firm believers in the long-term value of gold and silver.
In summary: Oil is going higher. Much higher. And that means gold will follow it to new historic highs. The recommendation is to accumulate gold and never sell until you see natural gas transportation adopted and a meaningful reduction in oil consumption. But gold bullion and for your IRAs, buy the GLD and SLV ETFs. Of course the other play is energy and energy service stocks where I continue to like Conoco Phillips (COP), Chevron (CVX), Marathon (MRO), Exxon Mobil (XOM), and Petrobras (PBR). But as we saw in the market correction after the last oil price spike, these oil companies can suffer severe haircuts. It may well be that gold and silver are the least volatile of the two asset classes.
That said, both will continue to march higher in the years ahead.
Red-hot copper hit another new all-time high this week, extending its mighty upleg to a 66.6% gain since June! As always after any strong run, investors and speculators are pretty excited about this essential base metal these days. But this incredible bullishness, along with overbought technicals, actually suggests copper is on the verge of a major correction today.
Corrections are perfectly normal, necessary, and unavoidable within even the strongest bull markets. All prices flow and ebb, advancing two steps forward before retreating one step back. These ebbings are critical because they rebalance sentiment, bleeding away excess greed and complacency before it grows to upleg-ending or even bull-ending extremes. Corrections keep bull markets healthy.
It always amazes me how much traders resist the very idea of corrections when markets near major highs. As investors and speculators, our mission is to buy low and sell high. The best opportunities to buy low within any ongoing bull market only occur after a major correction has run its course. Only then is sentiment poor enough to yield seriously beaten-down prices in the stock markets and commodities.
This innate resistance traders harbor against corrections just before one ignites is often buttressed by fundamental arguments. But while core supply-and-demand fundamentals do indeed drive the primary secular-bull trends, they are completely irrelevant for corrections. Corrections are sparked by extremely unbalanced sentiment and overbought technicals. Fundamentals have nothing to do with them.
In copper’s case, today you will often hear that copper is heading higher because of fundamental factors. China is buying, the emerging world is industrializing, existing mines are depleting, miners are striking, new mines are years away from production, et cetera. But realize these indeed-bullish supply-demand trends have been in force more or less continuously since late 2001 when this secular copper bull was stealthily born.
Despite the inherent bullishness of global demand growth outpacing global supply growth on balance, copper still had to weather many major corrections over this past decade. So don’t fall into the rookie trap of rationalizing away extreme sentiment and overbought technicals with fundamental arguments. All bulls correct from time to time no matter how awesome their underlying fundamentals happen to be.
Unfortunately copper doesn’t share the stock markets’ excellent array of sentiment indicators. But if you look around, it is readily apparent consensus opinion is pretty darned bullish on this base metal. Articles in the financial press advance endless fundamental arguments for why copper is heading higher. And professional money managers, traders, and analysts interviewed on financial television expect the same.
But even though copper doesn’t have some neat indicator like its own VIX, its technicals are clearly overbought today. Its price has risen too far too fast to be sustainable. How can we know? By comparing copper’s recent highs to this metal’s technical conditions just before its previous major corrections. We’ll start out by examining the blue copper line compared to its black 200-day moving-average line.
In order to define “too far too fast” for copper specifically, we need some kind of baseline. And its 200dma is a perfect one. It gradually rallies to reflect the higher prevailing copper levels as this secular bull marches on, but still moves slowly enough to distill out all the day-to-day volatility. Expressing any price as a multiple of its 200dma (dividing the price by its 200dma) is the basis of my Relativity trading system.
In copper’s case, earlier this week this metal was trading at 1.287x (times) its 200dma. Compare this to the Relative Copper readings before each of its previous several corrections. In November 2010 before a sharp 8.7% retreat, this metric stretched to 1.217x. In April 2010 before copper plunged 23.4%, it climbed to 1.218x its 200dma. And in January 2010 before this metal fell 18.7%, rCopper peaked at 1.334x.
So we have plenty of precedent over this past year alone showing that copper is very overextended and overbought once it stretches 20%+ beyond its trailing 200dma. rCopper running 1.2x+ is the point where traders need to start being wary of an imminent correction. Copper has a tough time sustaining an advance that sees it rally far enough and fast enough to exceed this benchmark. And this week we were well beyond that warning sign and pushing the super-extreme 1.3x level!
Now this alone warrants a very cautious near-term outlook on copper. The odds overwhelmingly favor a major correction. Again this has nothing to do with fundamentals, which are utterly irrelevant to short-term price action when sentiment and technicals reach extremes. Personally I wouldn’t go long copper or copper stocks based on this rCopper indicator alone when it’s at these levels. The near-term downside risk is far too high.
But add in a couple of other major factors driving copper prices, and the odds for an imminent correction approach certainty. They are the state of the general stock markets today and the trends in the London Metal Exchange’s global copper stockpiles. Each alone is a very ominous near-term portent for copper, and considered together along with copper’s overbought technicals present a nearly-ironclad correction case.
Believe it or not, the major driver of copper price action in its current cyclical bull since early 2009 is the state of the US stock markets! It sounds crazy at first, shouldn’t copper be reacting to its own supply and demand and not stock-market action? Of course. But the stock markets’ fortunes have a massive impact on traders’ sentiment worldwide. When the stock markets are up, they feel good and are more likely to buy commodities including copper. When they are down, traders dump everything including copper.
While this link is purely psychological, sentiment is what drives most short-term price action in anything. And there is some logic underlying this relationship. Advancing stock markets lead traders to expect an improving world economy, which means higher copper demand. So they buy this metal and the stocks of its producers. Retreating stock markets make traders assume the economic outlook is deteriorating, implying lower copper demand. So they react accordingly by selling the copper complex.
The best way to measure the US stock markets’ performance is through the broad S&P 500 stock index (SPX). It contains the 500 biggest and best American companies that collectively represent the vast majority of the total market capitalization of the US stock markets. In the chart above, I superimposed the past couple years’ copper action on top of the SPX in red. Their correlation is visually-astounding!
On a hard statistical level, this critical copper-SPX correlation is rock-solid mathematically as well. Since those brutal post-panic SPX lows in March 2009, copper has had a correlation r-square with the SPX of 93.4%. Over 93% of all the daily price action in copper over the last couple years is directly explainable by the SPX’s own! For whatever reason, copper traders are buying and selling copper in sync with the SPX.
And realize this relationship does indeed flow in this causal direction, from the SPX into copper. Every trader in the world watches the stock markets like a hawk. Their behavior and resulting psychological spillover affects everything else including copper. Meanwhile, general stock traders are definitely not eagerly watching copper prices to guide their every decision on buying and selling equities. The SPX is definitely influencing copper psychology, as suggesting copper drives the stock markets is absurd.
Note that all three of copper’s latest corrections in this bull, and 5 of 6 in total, corresponded exactly with pullbacks (less than 10%) or corrections (greater than 10%) in the SPX. Last November copper sold off 8.7% in just 4 trading days over a span where the SPX retreated 2.9%. Between early April and early June, copper plunged 23.4% over a span where the SPX corrected 10.7%. The worst copper correction of this entire cyclical bull was directly driven by the only correction in the SPX’s own cyclical bull!
And a year ago in January and February, copper dropped 18.7% in less than 4 weeks while the SPX fell 7.0% in its biggest pullback of this bull. Other than that initial post-panic recovery in 2009, which was an anomalous situation, every copper correction has perfectly corresponded with a parallel pullback or correction in the general stock markets. A retreating SPX scares traders into reducing all their risky trades, including copper exposure.
This is super-relevant today because the stock markets, for their own internal reasons that have nothing to do with copper, are also due for an imminent correction. I wrote an essay several weeks ago that explains exactly what is going on in sentiment and technicals in the SPX and why a correction looms. When (not if) the SPX inevitably rolls over, copper is going to get sucked into the maelstrom of selling like usual.
Copper just can’t resist the overpowering bearish sentiment that floods out of the stock markets when they are correcting. Almost nothing can, other than the US dollar and Treasuries which act as temporary safe-haven destinations for capital in times of mushrooming anxiety and fears. And today’s coming SPX correction is likely to be major, so all investors and speculators need to take its risks very seriously.
If you compare copper’s declines in its half-dozen corrections in this cyclical bull to the SPX’s parallel ones, both shown above on the chart, it is crystal-clear that copper tends to amplify stock-market downside. It is much more speculative than the stock markets, usually at least doubling SPX selloffs. So a garden-variety 15% SPX correction, no big deal at all, would probably lead to a massive copper correction approaching a third. Copper equities would get utterly slaughtered.
Several other factors argue for a serious copper correction beyond its extreme technical overboughtness and SPX-correction risk. After just hitting new all-time highs, copper is ripe for a selloff. Corrections off of records tend to be more severe, as such highs attract in new traders who buy near the top. These weak hands are easily spooked into selling fast.
In addition, copper hasn’t seen a material correction (over 10%) since last spring. It has rallied in a tight uptrend mirroring the SPX ever since, leading to very unbalanced sentiment. The longer any bull advances without a rebalancing selloff, the greater the odds one is coming soon.
And there is one final factor to consider that will really weigh on copper once selling starts. And it is fundamental! While fundamentals don’t matter in corrections sparked by sentiment and technicals, any temporarily-negative fundamentals can still add to this selling pressure. They exacerbate the bearishness and worries sparked by selling-off stock markets. Today the LME’s copper stockpiles are climbing again!
The London Metal Exchange runs a global network of warehouses that act as a buffer between copper miners and copper consumers. While most copper mined is shipped directly from producers to consumers, occasionally a miner will have excess production or a consumer will need more copper than usual. So these physical players can directly sell to or buy from these LME warehouses. The LME publishes its aggregate global copper-stockpile data daily. And it greatly impacts copper-price trends.
Prior to that epic once-in-a-century stock panic in late 2008, copper prices trended inversely to LME stockpile levels. When these above-ground copper stockpiles were rising, copper prices would fall as traders sold it because supplies weren’t as tight. When stockpiles were falling, copper prices were bid higher to reflect the leaner buffer between supply and demand. There were actually times when LME stockpiles represented only days’ worth of global copper consumption! Copper challenged $4 then.
During the stock panic, copper plummeted with all other risky assets thanks to the immense psychological splash damage from the plunging stock markets. But there was actually something of a fundamental basis for some of copper’s freefall, as LME copper stockpiles rocketed up dramatically. Thanks to the stock panic, the great majority of the business world feared a new global depression. So copper consumers (factories making products using copper) slowed their production and bought less LME copper.
Then in early 2009 as those silly and irrational depression fears abated, LME stockpiles started falling again and copper rallied sharply. But these critical stockpiles soon stabilized at much higher levels than what existed before the stock panic. So traders wondered whether copper prices would stay lower (around $3) for a while to reflect the reduced scarcity and risks of a supply shock. And initially they did.
But as the stock markets recovered out of the panic and the SPX soared, speculators flooded into copper again to bet on the mending global economy. So between the middle of 2009 and early 2010, copper prices rallied despite LME stockpiles blasting back up above their same extremes seen in the heart of the panic.
Copper was still recovering from its own ridiculously-low panic levels, which contributed to this particular disconnect from its usual inverse relationship with stockpiles.
Then after consolidating sideways in a volatile and choppy manner in the first half of last year, behavior driven by the pulling back and then correcting SPX, copper started surging again last summer. And there was some basis for this rally in the stockpile draws, until early December. At that point LME stockpiles bounced just under 349k metric tons and started rising. In the 8 weeks since, LME stockpiles have surged 14.2% higher at best while copper has rallied 24.6% at best (since mid-November). This is a big disconnect!
So for the copper fundamentalists out there, ever since this metal was trading around $3.90 in early December the copper gains haven’t been righteous. Copper should have fallen since then on rising LME stockpiles, but instead it was bid higher. Why? Because all the bullishness spilling out of the rallying stock markets bled into copper like usual! From its recent all-time record high of $4.60, copper would have to plunge almost 16% just to return to levels it should have started correcting from in early December!
The $0.70 run since then is all froth, pure speculation spurred on by the strong stock markets. While copper’s imminent correction is going to erupt for sentimental and technical reasons, these bearish near-term fundamentals could really exacerbate this selloff’s sharpness and depth. While this fundamental disconnect alone isn’t sufficient to call for a correction, considered in addition to everything else it is quite ominous.
So what to do? If you are an investor, relax and don’t worry about it. You are holding your copper stocks for many years so short-term corrections are ultimately meaningless. But gird yourself to weather the psychological storm corrections bring. Expect it and the copper selloff won’t worry you like it would if you had no idea it was coming. But if you are a speculator, this imminent copper correction is a huge deal.
You should realize gains in short-term copper-stock trades before copper starts sliding. Just like copper will amplify the SPX correction, copper stocks will leverage the metal’s own decline. So we could be looking at severe corrections in copper stocks, making locking in existing profits imperative. On the bright side, after this copper correction matures we’ll see some amazing buying opportunities in thrashed copper stocks. Selling before the correction ensures you will have a big cash war chest to buy the bargains left behind in the correction’s wake.
The bottom line is copper is due for a major correction. Sentiment in this metal is wildly bullish thanks to its recent massive upleg and new all-time highs. Copper is very overbought technically, it has rallied too far too fast by its own bull-to-date standards. And it has ignored a major trend change in its LME stockpiles in order to follow the stock markets higher. Together, all this is a recipe for a serious selloff.
Compounding these risks, copper has an incredibly-tight positive correlation with the US stock markets. And they are due for a major correction of their own. When they roll over, copper is going to get crushed like usual. On the bright side, a copper correction will drive serious carnage in copper stocks. If you can prudently amass cash before the slide, then after this correction runs its course you can buy some of the best copper-stock bargains seen within this ongoing bull.
It's recently become an article of faith for many governors as they try to attract jobs: raising taxes during a recession is a nonstarter, choking off growth and damaging a state's fragile economic recovery.
With the notable exception of Illinois, where Democratic Gov. Pat Quinn last month signed a 66 percent temporary personal income tax increase and a separate corporate rate hike to help close a $15 billion budget gap, governors this year are mostly vowing to cut regulations and hold the line on taxes to attract employers and rebuild after a brutal recession.
"We ... hope that every bill you consider passing will be viewed through the lens of its impact on our economic growth," Colorado Democratic Gov. John Hickenlooper told lawmakers in his State of the State address, sounding a theme many governors share. "This doesn't mean we compromise our standards or put our land, air or water at risk, but it does mean that we'll keep a fierce and even relentless focus on jobs."
Whether they can hold to that promise will become clearer in the coming months as governors release their new budget proposals.
But there's a catch to the anti-tax, pro-business rhetoric: Businesses consider a range of factors when deciding where to locate, including the quality of schools, roads and programs that rely on a certain level of public spending and regulation. And evidence suggests there is little correlation between a state's tax rate and its overall economic health.
"Concerns about taxes are overstated," said Matt Murray, a professor of economics at the University of Tennessee who studies state finance. "Labor costs, K-12 education and infrastructure availability are all part of a good business climate. And you can't have those without some degree of taxation."
States' tax rates also do not predict their resilience during an economic downturn.
While high-tax states such as New York, New Jersey and California have been clobbered by the current recession, so too have states that pride themselves on low tax rates, including Nevada, Texas and Arizona. The collapse of the housing market and the financial industry meltdown largely drove the current conditions, sparing almost no state regardless of its level of taxes.
Governors agree this is a particularly challenging budget year, with federal stimulus dollars drying up after years of deep state budget cuts. Some 34 states raised taxes or fees as recently as 2009 to help close budget shortfalls.
Now, chief executives from both parties mostly have little appetite for new tax measures after Republicans successfully ran on tax issues last fall — they now control 29 governorships — and President Obama and Senate Republican leaders teamed up to extend Bush-era tax cuts, even for the wealthiest Americans.
Illinois' big tax hike is considered an anomaly — an emergency measure that includes strict spending limits to close a budget hole that is the largest of any state as a percentage of its overall budget.
Neighboring states such as Wisconsin quickly pounced, urging businesses to relocate from Illinois even though its tax rate remains lower than those of many states in the region.
Meanwhile some other governors have opened the door to potential tax increases, insisting the measures are necessary to offset fiscal calamity.
In California, Democratic Gov. Jerry Brown has been promoting a package of temporary tax increases as a ballot measure for voters to consider, while also proposing deep cuts to higher education and social services.
Two newly installed New England governors — Connecticut's Dan Malloy and Rhode Island's Lincoln Chafee — have told state residents to expect some taxes to go up. Most are pairing their tax increase proposals with targeted spending cuts and promises of fiscal discipline over the long term.
To be sure, several governors, including Republican Chris Christie of New Jersey and Democrat Andrew Cuomo of New York, say they have sworn off tax increases. Some other governors — such as newly sworn-in Republicans John Kasich of Ohio and Rick Scott of Florida — say they plan to cut taxes even as they try to bring their budgets into balance. Scott wants to reduce the Sunshine State's corporate income tax despite the fact that Florida faces a projected budget gap next fiscal year of at least $3.5 billion; the corporate income tax now generates about $2 billion a year.
Other governors, despite tight budgets, want to boost spending on economic development projects to bring jobs to their states.
In Nebraska, Republican Gov. Dave Heineman has proposed a $16.5 million initiative aimed at attracting jobs while saying he will not raise taxes. The money would be spent on several measures, including an internship program pairing graduates of Nebraska universities with state-based companies, and a fund offering start-up cash and technical assistance to small businesses.
In an interview, Heineman said his state must spend money on education and job programs to attract economic development.
"We're competing for jobs with other states and other countries, and I'm trying to do it in a healthy and positive way," Heineman said. "The only way I can compete is to have a better tax and regulatory climate, but education and a quality work force are also key to that."
Kansas Republican Gov. Sam Brownback is requesting $105 million for universities in his state to do targeted research in the areas of animal health, cancer and aviation. Virginia Republican Gov. Bob McDonnell has proposed a $54 million jobs initiative for the state to compete more aggressively against neighbors North Carolina and Maryland.
The quality of a state's labor market is another significant factor for businesses as they choose where to locate, in some cases mitigating the level of taxes they will have to pay.
"As much as Nevada talks about getting California business because of their low taxes, their population would need a substantial amount of retooling," said Kim Reuben, a senior fellow at the Tax Policy Center in Washington. "Nevada has survived largely on growth, a place where people without much education could get relatively good jobs in construction and casinos. California is a place that has great intellectual institutions and will always attract talent and overcome its taxes."
But Kail Padgitt, an economist with the conservative Tax Foundation, said a state's tax burden might not have affected its performance during the recession but certainly will affect the pace of its recovery.
"When the economy starts to pick up, that's where you're going to see more the impact of taxes," Padgitt said. "Where businesses are going to expand operations, where new investments are going to be made — a lot of these companies want to know what their taxes are going to be."
How much the lure of lower taxes acts as an incentive for businesses seeking to relocate or expand remains an open question.
In late 2008 and early 2009, California lawmakers and then-Republican Gov. Arnold Schwarzenegger approved a series of corporate tax breaks that was estimated to save businesses about $1.3 billion a year. At the time, Schwarzenegger and GOP lawmakers promoted the tax cuts and credits as a way to create jobs, but there is little evidence they have done so.
California's unemployment rate rose in December to 12.5 percent and has remained above 12 percent for a year and a half. The questionable connection between corporate tax policy and job creation prompted a Democratic state lawmaker to call for legislation that would force companies to prove they were using tax breaks to boost employment.
"The bill is not to deny them those tax credits. I want to give them those tax credits because they make a rather credible argument why they need them," state Sen. Leland Yee said. "All I'm asking is for them to prove it."