Monday, March 17, 2014

Control your risk with simple and winning rules

SIMPLE AND STRICT TRADING RULES

With our Super Commodity strategies can operate on all commodities markets with a simple, safe and reliable method, generating significant capital growth, with simple and strict trading rules and risk management rules.
Our Super Commodity Trading Signal Service takes + 269.35 % from 1 January 2009 to 31 January 2014!


BUY LOW AND SELL HIGH!

Super commodity System wants to be a solid reference point for all those investors which want to approach the commodities markets world with a robust tool with low risk levels.
This strategy works automatically searching for specific patterns around markets, those highly profitable patterns with a good success percentage. These graphic formations demonstrated during the years to be turning points in robust and reliable manner. Super Commodity was born in order to use these points as very good launch points for its trades.
Super Commodity must be considered a pattern recognition system which searches graphic formations with preselected features. The system uses six different patterns which determine particular rules the system uses to manage trades.

Download Historical Results Pdf

Dowload some trades example

31t1laf0.a1h

MANAGED ACCOUNT SERVICE

Minimum Account Size $ 100K

Historical Drawdon $ 25K

RisK Per Trade $ 2500/contract

Our company receives a limited power of attorney on an account that the client opens with the broker Berkeley Futures (www.bfl.co.uk) or Interactive Brokers (www.interactivebrokers.com).


TRADING SIGNALS SERVICE

Minimum Account Size $ 100K

Historical Drawdon $ 25K

Max RisK Per Trade $ 2500/contract

We pleased to offer to ours readers the opportunity to test and evaluate for free for 30 days the full version of Super Commodity system. The signals service with all trading signals will be sent by email at the end of day, around 6:00pm Eastern time, and in case again in the next day to intraday updates, through a daily report like this and this. In addition, customers may view at any time the trading signals also on a special page through secure internet access.

After the free trial period, the service will continue to pay a monthly $ 395.00 fee. To activate the service, use the free trial period and receive daily updates please contact me

Contact me at michele.giardina@quantusnews.com


Material in this post does not constitute investment advice or a recommendation and do not constitute solicitation to public savings. Operate with any financial instrument is safe, even higher if working on derivatives. Be sure to operate only with capital that you can lose. Past performance of the methods described on this blog do not constitute any guarantee for future earnings. The reader should be held responsible for the risks of their investments and for making use of the information contained in the pages of this blog. Trading Weeks should not be considered in any way responsible for any financial losses suffered by the user of the information contained on this blog.


Geopolitical risk in spades

By Phil Flynn

Crimea Vote

Crimea voted in an election to succeed from Ukraine and to join Russia leaving the markets to ask, what is next? We know that sanctions may follow assuming that Russia recognizes the vote and there is no sign that they will not. In the meantime the commodity markets are moving on not only Ukraine woes but China, Libya, Nigeria and the EU. While the initial risk on seems to be slowing, there is no doubt the markets remain on edge. Comments by Mario Draghi suggesting that the EU is looking to “act against deflation” adds a new element to buy euro, ask questions later trade is not a given.

Bloomberg News Reports that “Draghi said his forward guidance may help to weaken the euro and lower real interest rates, easing the risk that inflation won’t return to the goal set by policy makers.

Guidance “creates a de facto loosening of policy stance, as real interest rates are set to fall over the projection horizon,” Draghi said in Vienna yesterday. “At the same time, the real interest-rate spread between the euro area and the rest of the world will probably fall, thus putting downward pressure on the exchange rate, everything else being equal.”

China also is a risk as they try to engineer a soft landing and unwind and deleverage risk against a backdrop of Fed tapering. The Chinese yuan is taking a hit as the Chinese central bank widened the trading range but still will set the closing price. 

Reuters News reports that China's yuan eased against the dollar on Monday after the central bank doubled the currency's daily trading band as part of its commitment to let markets play a greater role in the economy. Yet the currency moved in a relatively narrow range reflecting market views that the People's Bank of China will seek to limit currency swings at a time when markets fret over China's cooling growth and the quality of corporate debt.

"The PBOC, with the help of major state-owned banks, will for certain tighten the grip on yuan's value in coming days and weeks to prevent what it sees as excessive volatility," said a dealer at a European bank in Shanghai.

In the longer run, however, the central bank is expected to allow the currency to move in a broader range in a sign of its confidence that it can keep speculators at bay and that the economy was mature enough to handle greater uncertainty about the exchange rate. "Over time, the widening will pave the way for the PBOC to gradually lessen intervention in daily trading and will help China's reforms to make the yuan fully convertible eventually."

On Saturday, the People's Bank of China doubled the yuan's daily trading range, so that it can now rise or fall 2% around the daily midpoint rate. The currency opened at 6.15 to the dollar, just 0.29% weaker of the official mid-point rate. It briefly fell to an intraday low of 6.1642, 0.2% weaker than Friday's close.

Since the start of this year the yuan has lost 1.8% against the dollar, largely as a result of central bank's efforts, reversing much of last year's near 3% rise as Beijing sought to change the perception the yuan was a safe one to one appreciation bet. Beijing's efforts to clamp down on such trades combined with concerns over China's economic health are expected to keep the yuan on the back foot in coming weeks.  Earlier this month, a Chinese company became the first to default on a corporate bond, and concerns about economic growth were highlighted by a dramatic 18% fall in exports in February and sluggish manufacturing. "Given China's recent relatively weak export performance, we see little upside for the yuan this coming year," said Tao Wang, an economist at UBS in Hong Kong.

Libyan oil production has played havoc with the Brent market and a tanker that was taken over by rebels has been boarded by the United States. The New York Times reports that U.S Navy commandos seized a fugitive oil tanker in the Mediterranean waters southeast of Cyprus on Monday morning, thwarting an attempt by a breakaway Libyan militia to sell its contents on the black market, the Pentagon said. No one was hurt in the operation, the Pentagon said in a statement. The fugitive tanker, called the Morning Glory, had sailed into the Libyan port of Sidra under a North Korean flag but North Korea disavowed the ship and denied providing any authorization. News reports have said it was operated by a company based in Alexandria, Egypt, and that after leaving Libyan waters it appeared to have sailed the Mediterranean in search of a buyer for its oil.

In a statement early Monday morning, the Pentagon said that the Libyan and Cypriot governments had requested American help in seizing control of the tanker. President Obama authorized the operation just after 10 p.m. Sunday night, the statement said. Within a few hours a Navy SEAL team on the guided missile destroyer Roosevelt boarded and took control of the tanker, “a stateless vessel seized earlier this month by three armed Libyans,” the statement said. The Roosevelt also provided helicopter support, the statement added, but it did not say how many Americans had participated in the seizure or what force might have been used.

The American intervention is a salvation to the fragile transitional government in Tripoli, the Libyan capital, which faced the loss of its main source of revenue and sole source of political power if renegade militias succeeded in selling Libya’s oil. Despite days of furious bluster, the Libyan authorities were unable to stop the tanker from arriving in the eastern port of Sidra early last week or from leaving with the oil a few days later. The loss of control over oil revenue threatened the government so gravely that the transitional government appeared to teeter, with Parliament voting to remove its prime minister without any consensus on his long-term replacement. The seizure of the oil, which the United States Navy says it is now returning.

The AP Is reporting that Officials say Fulani Muslim herders attacked three Christian villages and killed more than 100 civilians. Hundreds of thatched-roof huts were set ablaze. Thousands have been killed in recent years in competition for land and water between mainly Muslim Fulani herdsmen and Christian farmers across Nigeria’s Middle Belt. More than 100 people were killed in similar attacks in neighboring Katsina state last week.

Dow Jones reports that spot gold reached a fresh six-month high in early European trading hours Monday. Last week's jitters surrounding Chinese economic and credit conditions and ongoing tensions surrounding Ukraine briefly carried into the new week – gold touched $1,392.08 per troy ounce, its highest price since early September, before slightly to just below Friday's settlement price at $1,378.30 per ounce.

Bloomberg Reports that wheat traded near the highest level in almost five months, extending a weekly gain, after a referendum in Crimea to leave Ukraine and join Russia boosted concerns supplies from the Black Sea region will be disrupted. The contract for May delivery climbed as much 1% to $6.9425 a bushel on the Chicago Board of Trade and was at $6.9275 by 2:01 p.m. in Singapore. Prices climbed 5.1% last week, touching $6.965 on March 13, the highest since Oct. 25. Futures are set to gain 14% this quarter, the most since the three months through September 2012.

See the original article >>

Inflation evident as ETF flows converge with investor choices

By Cordell Eddings and Daniel Kruger

The Federal Reserve’s attempt to lift inflation to a level that would reflect a healthier U.S. economy is starting to take hold in the bond (CBOT:USM13) market.

For the first time in 19 months, investors are stepping up their buying of exchange-traded funds that hold Treasuries tied to cost-of-living increases, data compiled by Bloomberg show. At the same time, inflation expectations over the next five years surpassed 2% to reach the highest level since May after a government report showed hourly earnings among U.S. workers jumped more on average in February than economists forecast.

The shift in bond-market perceptions shows that some investors now anticipate consumer demand in the world’s largest economy will be strong enough to push inflation toward the Fed’s elusive 2% target. Last year, investors were so convinced the persistent lack of price pressure had become entrenched that Treasury Inflation Protected Securities, or TIPS, posted their worst losses since they were introduced in 1997.

“Inflation is coming,” Michael Pond, the head of global inflation-linked research at Barclays Plc, one of the 22 primary dealers that trade with the Fed, said in a telephone interview from New York. We’re starting to break “free from some of the deflationary shackles of last year. The labor market is picking up, which will cause wages to pick up.”

While a recovery in consumer spending would validate the Fed’s move to scale back its quantitative easing after flooding the U.S. economy with more than $3 trillion since the financial crisis, the risk of inflation has prompted some investors to favor TIPS over Treasuries that pay a fixed rate of interest.

Purchasing Power

Unlike Treasuries, whose fixed payments lose value as living costs increase, TIPS appreciate. The securities returned 2.75% this year, rebounding from a 9.4% plunge in 2013 and outperforming the broader market for U.S. government debt, index data compiled by Bank of America Merrill Lynch show.

Many investors have been overly optimistic “inflation will stay relatively contained and that the Fed will make a graceful exit from QE,” Zach Pandl, a senior interest-rate strategist at Columbia Management Investment Advisers, which oversees $340 billion, said by telephone from Minneapolis. “The economy has made a lot of progress and is accelerating.”

Pandl, who is avoiding Treasuries because of the likelihood the economy will strengthen, is buying TIPS. Yields on the benchmark 10-year TIPS have fallen 0.31 percentage point this year to 0.49%, while those on similar-maturity Treasuries have declined to 2.68% from a more than two-year high of 3.03% on Dec. 31.

Consumer Spending

Net purchases of the 12 ETFs that hold U.S. inflation- linked bonds have totaled $399 million in March, the first time combined inflows have surpassed redemptions from the funds since August 2012, data compiled by Bloomberg show.

The largest such ETF, the $13 billion iShares TIPS ETF run by BlackRock Inc., is poised to snap its longest streak of withdrawals since its inception a decade ago with the biggest monthly net increase in two years, the data show.

Inflation expectations have picked up on signs that wage growth will lead to more consumer spending. The gap between yields on five-year Treasuries and similar-maturity TIPS widened to a 10-month high on March 7, implying that consumer prices will rise an average 2.01% over that span.

As recently as June, the break-even inflation rate was 1.63%, the lowest since January 2012. It was at 1.95% as of 10:30 a.m. in New York.

Minimum Wage

Average hourly earnings for all U.S. workers climbed by 9 cents, or 0.4%, to $24.31 last month, according to the Labor Department, the biggest gain since June.

Employers added more workers than forecasters estimated, a sign the U.S. economy is starting to shake off the effects of severe winter weather that slowed growth at the start of 2014.

The Obama administration is also calling on Congress to raise the federal minimum wage by almost 40% to $10.10 an hour over the next three years, which may boost the ability of the lowest wage earners to buy more goods and services.

“Inflation may move up higher than people think,” David Leduc, the chief investment officer at Standish Mellon Asset Management Co., which manages $160 billion, said in a telephone interview. The Boston-based firm began buying TIPS with maturities as long as five years this month, he said.

After falling to a four-year low of 1% in October, the annual inflation rate has risen for three straight months to reach 1.6% in January, data compiled by Bloomberg show. Economists in a Bloomberg survey anticipate the cost of living will rise 1.7% this year and 2% in 2015.

Stagnant Incomes

It’s still too soon to start worrying about inflation because stagnant incomes will keep consumer spending in check, according to Jennifer Vail, head of fixed-income research of the Minneapolis-based U.S. Bank Wealth Management, which oversees $112 billion. Disinflation, or a slowdown in price gains, is instead the more immediate threat to the economy, she said.

Incomes in the U.S. have increased an average 2.1% over the past five years since the financial crisis, less than the 3.3% growth during the previous decade, according to data compiled by Bloomberg.

The Fed’s preferred gauge of inflation, known as the personal consumption expenditures deflator, has been below the central bank’s 2% goal for 21 straight months and rose just rose 1.2% in January from a year earlier. In the past year, the index has fallen below 1% three times and has never exceeded 1.5%. The last time inflation based on the Fed’s measure was so low during an expansion was in 1998.

Not Soon

Bond-market expectations for consumer prices in the latter half of the coming decade, another measure used by the Fed called the five-year, five-year forward break-even rate, has declined to 2.41%, the lowest since July.

“The Fed is still much more concerned with disinflation right now, and it’s a valid concern,” Vail said by telephone. “Will inflation rise eventually? Yes, but no time soon.”

More jobs, higher home values and record stock prices are helping to give consumers more reasons to spend, according to Wilmer Stith, a Baltimore-based money manager at Wilmington Trust Investment Managers, which oversees $14 billion.

Household wealth in the U.S. increased by $2.95 trillion last quarter to a record $80.7 trillion, data compiled by the Fed show. Last month, retail sales increased for the first time in three months, according to a Commerce Department, a sign the harsh weather that curtailed spending is abating.

‘Half-Full’

Consumer spending is one reason why economists are anticipating faster growth. They predict the U.S. economy will expand 2.7% this year and accelerate 3% in 2015, which would be the fastest in a decade, data compiled by Bloomberg show. Last year, the economy grew 1.9%.

While the strength of the U.S. economy has prompted economists to predict the Fed will continue to pare its monthly bond buying by $10 billion each month until ending its stimulus by year-end, the purchases will ultimately help to spur prices and buoy demand for inflation protection, Stith said.

“All of a sudden it seems the class is half-full instead of half-empty for TIPS,” Stith, who has been boosting his TIPS holdings, said by telephone. “There is upward pressure on wages and the Fed, while tapering, is still expanding its balance sheet, increasing the prospects of inflation.”

Inflation has already emerged across financial markets, with bond yields moving inversely to stock prices for the first time since 2007, according to Jim Paulsen, Minneapolis-based chief investment strategist at Wells Capital Management.

Latent Risks

Signs of price pressures may also be lurking in short-term unemployment data. The jobless rate for Americans who have been out of work less than 27 weeks was just 4.2% last month. That’s close to the lowest since April 2008 and 0.6 percentage point below the average since 1948, Labor Department data show.

The depressed level suggests the U.S. labor market is tightening, raising the odds a pick-up in wages will eventually lead to faster inflation, according to Michelle Girard, chief U.S. economist at RBS Securities Inc. in Stamford, Connecticut.

For bond investors, the latent risk means they should be buying TIPS now, said Matt Freund, chief investment officer of USAA Mutual Funds, who oversees more than $60 billion.

“Every day the potential for inflation grows,” Freund said in a telephone interview from San Antonio, Texas. “Once people are worried about inflation, it’s too late.”

See the original article >>

Did John Williams Just Predict The Next Recession??

by Lance Roberts

There are three things that are often spotted, widely believed, and actively sought after with little evidence they actually exist:  Big Foot, Ghosts and Economic "Soft Landings."  If you are interested in the first two, you can catch weekly episodes of Animal Planet's "Search For Bigfoot" and SyFy's "Ghost Hunters."   The funny thing is that both of these shows remind me of "Get Smart" because when it comes to actually finding any real evidence it is always "missed it by this much."

When it comes to "economic soft landings" the story line is really changed that much.  By definition an economic soft landing is:

"The process of an economy shifting from growth to slow-growth to potentially flat, as it approaches but avoids a recession."

The chart below is the annual change in economic growth from 1854 to present with recessions identified.

GDP-Recessions-1854-Present-031714

Over the past 159 years, there is not much evidence that an economic "soft landing" has ever occurred.  However, it is not without precedent that as the economy reaches the latter stage of the growth cycle that the words "soft landing" are uttered by economists and Federal Reserve members.

In 1999, according to the FOMC minutes, Ms. Johnson stated in her remarks:

"Provided foreign officials do not unnecessarily limit output growth from achieving its new potential, such a development could result in stronger demand for U.S. exports and more balanced growth in the global economy. Such a scenario is one version of a so-called soft landing."

In the August, 2000 FOMC press release Alan Greenspan stated:

"The incoming data seem to have convinced participants in the financial markets that the odds of a soft landing have risen."

Then again following the September 2000 FOMC Meeting:

"Financial market participants seem to be reading the recent economic data as further confirmation that a soft landing is in train."

Of course, as we know now, the recession soon followed in 2001.

One of the things you have to admire of those that hunt for ghosts, "Big Foot" or aliens is that they live by the "Jason Nesmith" motto of "Never give up...never surrender."

Apparently, the same holds true for the members of the Federal Reserve as during the December 12, 2006 FOMC meeting, the now Fed Chairwoman, Janet Yellen remarked:

"In summary, I continue to view a soft landing with moderating inflation as my best-guess forecast, conditional on maintaining the current stance of policy. But there are sizable risks on both sides to the outlook for growth, and the downside risks are now more palpable."

Followed by then Chairman Ben Bernanke:

"So like most people around the table, I think that a soft landing with growth a bit below potential in the short run looks like the most likely scenario."

Of course, it was just 12 months later that the US economy dipped into the worst recession since the great depression.

Why do I bring this up?  Bihnamin Appelbaum, via the New York Times, recently interviewed John Williams, the President of the Federal Reserve Bank of San Francisco, who stated:

"John Williams, president of the Federal Reserve Bank of San Francisco, is feeling pretty good about the economy. He is ready to continue the Fed’s retreat from bond-buying and forward guidance. And he says he’s optimistic that this time, the Fed will manage to produce a soft landing."

However, Bihnamin understands that "soft landings" are rare and gives John a chance to extract himself:

Q.  You've said several times during our conversation that we're returning to normalcy. A lot of people are uneasy about the Fed's ability to manage that return.

A.   I think we've got significant challenges ahead of us that are far greater than normal periods of monetary policy. Not only the communication around the taper but more generally that whole exit period of moving from zero interest rates after many, many years, and what happens to our balance sheet, these are clearly big issues that are ahead of us and getting the soft landing right is very difficult.

Q.  But the Fed almost never lands softly.

A.  Maybe this will be the one time we have a soft landing. We haven't had a lot of breaks in the last few years."

If history serves as any guide, John's prognostication started a 12-18 month countdown to the next recession.  Of course, as John suggests, "this time could certainly be different."   As I wrote previously:

"The next major market correction will very likely coincide with the next economic recession.  Of course, by simply writing the 'R' word this article will be summarily dismissed by the 'financial illuminati' who continue to marvel at the day to day levitations of the markets with the inherent belief 'trees can grow to the sky'.  Ultimately, all economic recoveries will eventually contract.  The chart below shows every post recession economic recovery from 1879 to present.

Economic-recoveries-112513

The statistics are quite interesting:

  • Number of economic recoveries = 29
  • Average number of months per recovery = 39
  • Current economic recovery = 57 months
  • Number of economic recoveries that lasted longer than current = 6
  • Percentage of economic recoveries lasting 53 months or longer = 24.14%

Think about this for a moment.  We are currently experiencing the 7th longest economic recovery in history with most analysts and economists giving no consideration for a recession in the near future."

While there is always the possibility that ghosts are real, "Big Foot" is alive and a "soft landing" will be achieved, there is just precious little historical evidence to support that claim.  Unfortunately, such claims of a "soft landing" have always come just prior to recessions as any claim different by a Federal Reserve member would likely spark a panic in the financial markets accelerating a recessionary event.

What it does suggest is that the Federal Reserve is far more worried about the current economic state than what they reveal.  For the Federal Reserve, "forward guidance" is their "Omega 13."  The hope of is that communication can put the markets, and economy, on a controllable "glide path."  The problem is that in order for forward guidance to work you have to make the assumption that the Federal Reserve, through monetary policy, can control, or potentially eliminate, real economic cycles.

Is that possible.  Sure.  Historical probabilities suggest something far different.  Regardless of the outcome, just remember to "Never Give Up, Never Surrender."

See the original article >>

SPX in a Position to Decline Further

By: Anthony_Cherniawski

SPX futures tumbled 10 points at the open on Sunday, but were rescued by the JPY carry. There seems to be some confusion on how the Pre-market reads this morning. It shows the SPX up 10 points, but that appears to be from the Sunday open. The actual value is only 1843.00…maybe on the assumption that no one would read the news over the weekend.

Meanwhile, Crimea is moving ahead with the annexation by Russia, despite all the warnings from the West.

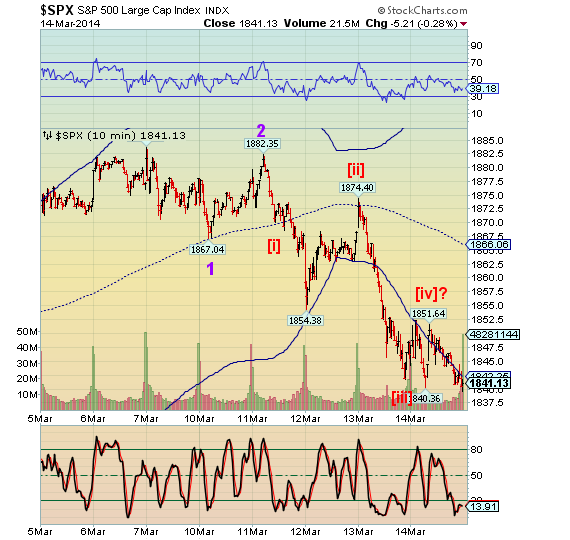
This leaves the SPX in an interesting position. There are clearly 3 waves down from the 1851.64 high on Friday, with a very modest bounce at the close. If SPX stays beneath 1845.00 this morning, it may continue its decline, completing a sub-minute impulse that may extend to the 50-day moving average at 1829.56 before the Minor Wave 4 bounce.

The point is, we must see the SPX break the lower trendline of the Orthodox Broadening Top (near 1820.00) before a larger-degree bounce this week. That implies an Intermediate Wave (1) decline to 1800.00 or even lower.


See the original article >>

No Lack of Opportunity in Ag Markets says M6 Capital

by Attain Capital

With planting season right around the corner, and spring just days away, it’s just about the time when investors looking for diversification turn their sights towards the Ag Markets. Lucky for us, M6 Capital recently published their opinion for what’s in store for the year to come, and the first tidbit is that speculators don’t appear to be waiting for spring to officially begin to make their decisions on where prices are headed…

“The Combined Speculative Position has increased…nearly 400,000 contracts [to net long] in the last 4 weeks, one of the largest 4 week speculative buying campaigns ever.”

Combined Spec Position(Disclaimer: Past performance is not necessarily indicative of future results)

While the early spike (in Corn and Wheat) has been mainly be attributed to tensions in Ukraine, M6 believes it isn’t Europe, but South America & U.S. conditions that might change the course of grain trends moving forward.

“M6 is of the opinion that Brazil and Argentina will return to selling and exporting large quantities of corn this summer. For Argentina, the largest single source of government revenue is grain export taxes. With a 24 million tonne crop and domestic use of only 8 million tonnes, there will be plenty to export. Their government is expected to issue export licenses shortly so exports can begin. At M6 Capital, we believe U.S. old crop (Sep 1) stocks will be a plentiful 1.5 billion bushels and new crop supplies (beginning stocks + new crop production) will be a record, large 15.9 billion bushels. Thus, we believe prices will eventually trade lower than current levels, and potentially much lower (Figure 2).”

CornChart Courtesy: M6 Capital
(Disclaimer: Past performance is not necessarily indicative of future results)

Much like corn, M6 predicts a plentiful crop of soybeans. Even though there’s an expected tight supply in the U.S., South America will pick up the slack, while China (the world’s largest soybean importer), might start taking in less. Even with a slimmer than usual supply coming from the U.S., it still represents a good portion of the estimated soybean supply when harvest time comes.

SoybeansChart Courtesy: M6 Capital
(Disclaimer: Past performance is not necessarily indicative of future results)

There is a caveat to this supply however. M6 believes that until investors and speculators gain confidence in the U.S. supply, pricing will remain strong.

How can we talk about Ag markets without mentioning Livestock, especially the Hog epidemic, sending Lean Hogs to all time highs. Under the assumption that farmers are unable to control the deadly virus that has thus far killed millions of young hogs, supply could hit its low from May-July.

PorkChart Courtesy: M6 Capital
(Disclaimer: Past performance is not necessarily indicative of future results)

Put all that together, and there’s no shortage of subplots in the Ag markets for the coming year – with viruses and geo-political tensions adding to the usual weather driven markets. After struggling for the first two months of the year, Ag Traders sure could use some good calls to get back on track for the year – but only time will tell how well the forecasts and analysis match up with price action moving forward.

See the original article >>

Equity Concepts

by Marketanthropology

For the equity markets, we continue to look towards the east at the Nikkei and yen, as their reversionary tendencies this year have roughened the one-way path traveled for many in the last. 
As expected, Japanese equity indexes made strong downside pivots last week, while the yen rallied sharply as risk appetites broadly waned.
We continue to look for the Nikkei to make its way lower through the balance of the month and into the start of Q2, after completing another brief retracement bounce this week. 
While it seems increasingly likely that the BOJ will eventually double-down on Abenomics, we see the Nikkei first coming back to ~ 13000 by early spring. 
Since the start of the year (see Here) we held an outlier opinion that the euro was going to breakout, while the rally in European equity markets would begin to roll-over. Over the past few weeks this dynamic has started taking shape - much to the chagrin of ECB watchers and pontificators. Similar to our thoughts in Japan, we expect the ECB will eventually intervene which could arrest the euro's ascent, but do not expect any measures in the near-term. 
Emerging markets - as well as Chinese equities, continue to languish in the doldrums of a transitioning market environment. With that said, emerging markets relative to the SPX has been following the precious metals and broader commodity sector with ~ a quarter lag. Our expectations are that similar to the cyclical low that was made in Q4 in the precious metals and commodity sectors, emerging markets relative to the SPX will find a longer-term low in Q1.

See the original article >>

A 2008 Redux? The Scary Warning from Dr. Copper

By Michael Snyder

Is the price of copper trying to tell us something?  Traditionally, "Dr. Copper" has been a very accurate indicator of where the global economy is heading next.  For example, back in 2008 the price of copper dropped from nearly $4.00 to under $1.50 in just a matter of months.  And now it appears that another big decline in the price of copper is starting to happen.  So far this year, the price of copper has dropped from a high of $3.40 back in January to a price of $2.95 as I write this article, and many analysts are warning that this is just the beginning.  By itself, this should be quite alarming to investors, but as you will see below there are a whole host of other signs that a stock market crash may be rapidly approaching.

But before we get to those other signs, let us discuss copper a bit more first.  I cannot remember a time since 2008 when there has been such an overwhelming negative consensus about where the price of copper is heading.  The following is from a CNBC article that was posted this week...

Cascading copper prices have multiple root causes that lead to one conclusion: The anticipated global economic recovery may not be all it's cracked up to be.
Consequently, analysts are in virtual unison that the extended-term trajectory is lower for the metal often used as a growth barometer. Copper futures are off more than 12 percent in 2014 and 7 percent over just the past three days, though they rose less than 1 percent in Wednesday trading.
A slowdown in the global economy, forced selling by Chinese banks and technical factors have converged in multiple calls for more weakness in a commodity known by traders and economists as "Dr. Copper" for its ability to accurately make economic prognoses.

Of course there are some out there that are trying to claim that "this time is different" and that the price of copper is no longer a useful indicator for the global economy as a whole.

We shall see.

Meanwhile, there are lots of other signs that the financial markets are repeating patterns that we have seen in the past.  For instance, the level of margin debt on Wall Street just soared to another brand new record high...

The amount of money investors borrowed from Wall Street brokers to buy stocks rose for a seventh straight month in January to a record $451.3 billion, a potential warning sign that in the past has coincided with irrational exuberance and stock market tops.

We saw margin debt spike dramatically like this just prior to the crash of the dotcom bubble in 2000 and just before the great financial crisis of 2008.  Just check out the chart in this article.

Shouldn't we be alarmed that it is happening again?

If you listen carefully, there are many prominent voices in the financial world that are trying to warn us about this.  Here is one example...

"One characteristic of getting closer to a market top is a major expansion in margin debt," says Gary Kaltbaum, president of Kaltbaum Capital Management. "Expanding market debt fuels the bull market and is an investors' best friend when stocks are rising. The problem is when the market turns (lower), it is the market's worst enemy."

And of course margin debt is far from the only sign that indicates that we are in a massive stock market bubble that is about to crash.  The following is a list of 10 signs that comes from a recent article by Lance Roberts of STA Wealth Management...

I was recently discussing the market, current sentiment and other investing related issues with a money manager friend of mine in California. (Normally, I would include a credit for the following work but since he works for a major firm he asked me not to identify him directly.)  However, in one of our many email exchanges he sent me the following note detailing the 10 typical warning signs of stock market exuberance.
(1) Expected strong OR acceleration of GDP and EPS  (40% of 2013's EPS increase occurred in the 4th quarter)
(2) Large number of IPOs of unprofitable AND speculative companies
(3) Parabolic move up in stock prices of hot industries (not just individual stocks)
(4) High valuations (many metrics are at near-record highs, a few at record highs)
(5) Fantastic high valuation of some large mergers (e.g., Facebook & WhatsApp)
(6) High NYSE margin debt
Margin debt/gdp (March 2000: 2.7%, July 2007: 2.6%, Jan 2014: 2.6%)
Margin debt/market cap (March 2000: 1.8%, July 2007: 2.3%, Jan 2014: 2.0%)
(7) Household direct holdings of equities as % of total financial assets at 24%, second-highest level (data back to 1953, highest was 1998-2000)
(8) Highly bullish sentiment (down slightly from year-end peaks; still high or near record high, depending on the source)
(9) Unusually high ratio of selling to buying by corporate senior managers (the buy/sell ratio of senior corporate officers is now at the record post-1990 lows seen in Summer 2007 and Spring 2011)
(10) Stock prices rise following speculative press releases (e.g., Tesla will dominate battery business after they get partner who knows how to build batteries and they build a big factory.  This also assumes that NO ONE else will enter into that business such as GM, Ford or GE.)
All are true today, and it is the third time in the last 15 years these factors have occurred simultaneously which is the most remarkable aspect of the situation.

And for even more technical indicators such as these, please see Charles Hugh Smith's excellent article entitled "Why 2014 Is Beginning to Look A Lot Like 2008".

So do all of these numbers and charts actually prove that something is about to happen?

Not necessarily.

But if we do not learn from the past then we are doomed to repeat it.

At this point, even representatives from the big Wall Street banks are warning about the "euphoria" on Wall Street...

The stock market entered "euphoria mode" late last year and has remained there, except for a week in February, as "speculative froth" bubbles around the market's hottest sectors, Citi's chief equity strategist told CNBC on Tuesday.

And even market cheerleader Jim Cramer is warning that the stock market is now exhibiting "top behavior"...

The parabolic moves of stocks such as Plug Power and FuelCell Energy have the stock market exhibiting "top behavior," CNBC's Jim Cramer said Wednesday.
Cramer said he has tracked the fuel cells stocks since his days as a hedge fund manager. Runups in Freddie Mac and Fannie Mae also had him worried.

None of what you just read above guarantees that the stock market will crash this week, this month or even this year.

And nobody knows the exact date when the next stock market crash will happen.

But one thing is for certain - this massive stock market bubble will burst at some point, and when it does our economy is far less equipped to handle it than it was the last time.

Based on my research, I am entirely convinced that the coming economic crisis is going to be substantially worse than the last one, and that is very bad news for the United States.

See the original article >>

BofA Warns: VIX Spells Trouble

by Tyler Durden

Markets are showing increased signs of investor anxiety, warns BofA's Macneil Curry. The Friday breakout in the VIX Index says that this anxiety will likely persist into next week. Indeed, Curry adds, the VIX has based from its highest levels in over a year suggesting that investors are more susceptible to bad news and defensive behavior than at any time in the past 12 months. Several markets look particularly susceptible to this change in sentiment.

From an equity perspective, the Nikkei stands out. Its breakdown from 5 week Flag support says its medium term downtrend has resumed, targeting last summer’s range lows between 12,400/13,400.

In FX, the Japanese ¥ is particularly well placed to benefit. The bearish weekly reversal in $/¥ and close through 101.40 says it is resuming its medium term downtrend for 99.06 and eventually the 92/94 area. Finally, regardless of the larger outlook for risk assets stay bearish CNH.

Via BofAML's Macneil Curry,

Chart of the week: VIX BASE POINTS TO SENTIMENT SHIFT

The VIX broke sharply higher on Friday, completing a month long base/Double Bottom. This formation targets the 20 area and says that investor anxiety will persist in the week ahead. More troubling is that this base developed from above the 14m range lows at 12/13. It warns that sentiment is undergoing a regime shift to higher levels of uncertainty and that the range highs at 21/22 are vulnerable. BEWARE.

The Nikkei seems set to suffer

In an environment of heightened investor anxiety, the Nikkei is particularly vulnerable. The breakdown through 5wk Bear Flag support (14,657) says its medium term bear trend has resumed. Target the Summer’13 lows of 13,388/12,415 before renewed basing.

$/¥ resumes its downtrend

The bearish weekly reversal and close below 101.40 says that $/¥ has resumed its medium term downtrend. The initial target is 99.06 (measured move), but eventually we target 93.79/92.57 (Jun & Apr’13 lows) before greater signs of basing emerge.

$/CNH is in a long term uptrend.

Regardless of the risk environment, evidence says that one most stay bullish $/CNH. The impulsive gains from the Jan-14 low and break of 20m trendline resistance says the long term trend has turned. While momentum warns of a near term pullback, CNH strength should not exceed the pivotal 200d (now 6.0945). Bigger picture, we target 6.2692/6.2510 and potentially beyond.

See the original article >>

Monster Silver Price Rally Brewing

By: Clive_Maund

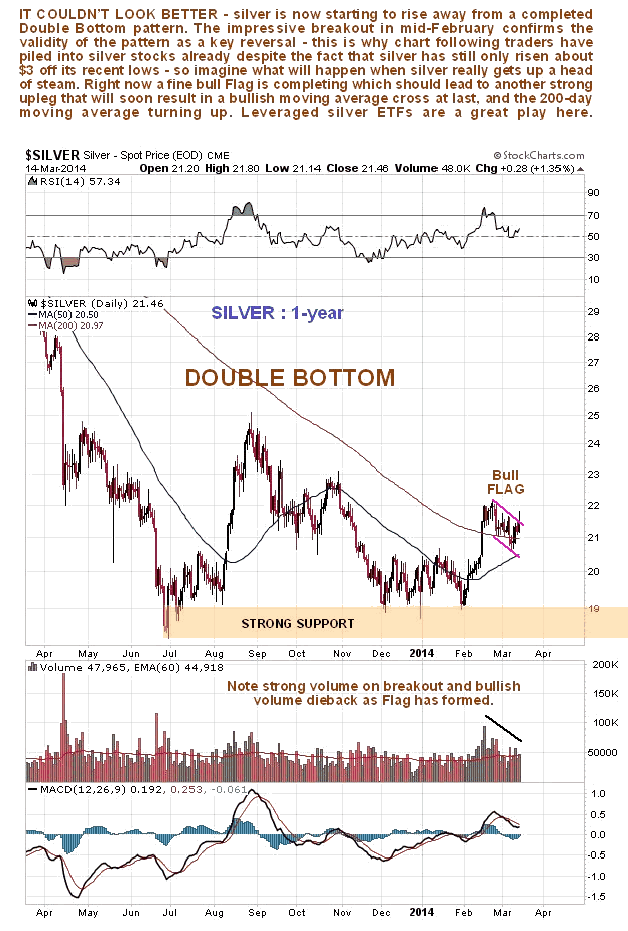
On silver's 1-year chart we can see that a fine large Double Bottom is completing. We already had the breakout on good volume from the 2nd trough of this Double Bottom in the middle of February, and it was this event that has (rightly) caused traders to pile into silver, although the price hasn't moved much - yet. The better silver stocks, on the other hand, are already on fire, because the "writing is on the wall". Right now the price is consolidating following the breakout in a fine tight Flag formation, from which upside breakout looks imminent.

Silver $21.46

Silver1-Year Chart

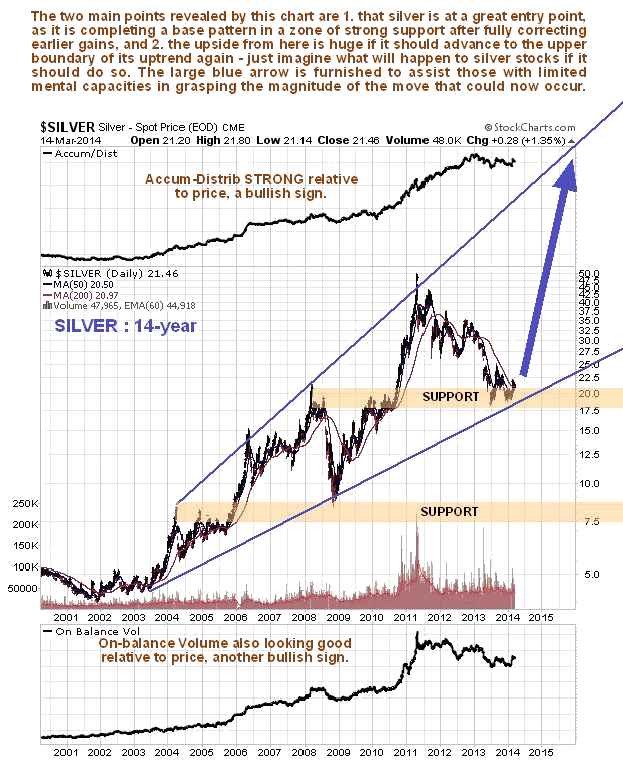
How far is next major uptrend in silver likely to carry? - to figure that out we turn now to the long-term 14-year chart, which shows silver's entire bullmarket to date. On this chart we see that, despite the severity of the reaction of the past 3 years, silver never broke down from its long-term uptrend, which now looks set to reassert itself with a vengeance after a fine base pattern has formed at a classic juncture, in a zone of strong support just above the support line of the long-term uptrend. Volume indicators are positive, relative to price, and everything is in place for a monster uptrend to begin, with the giant blue arrow drawn on the chart designed to assist those of you with limited powers of imagination in grasping its potential magnitude - little wonder then that silver ETFs and stocks are such compelling investments here - their performance soon could put many tech stocks in the shade.

Silver 14-Year Chart

Speculating about the possible reasons for such a big uptrend is a complete waste of time - maybe John Kerry will succeed in starting WW3, who knows?

See the original article >>

Volatile markets prove difficult to trade: Commodity roundup

By John L. Caiazzo

The failure of the West to address the current aggressive action by Russia pertaining to their incursion into the Ukraine remains of concern becuase the Eurozone relies heavily on the delivery of natural gas through the Ukraine pipelines. Any disruption by Russia in response to threats of sanctions could prove disastrous.

The current standoff could be a determining factor in the coming week’s market action. The markets have become a “trading affair.” There is not much question in my mind that technicians are getting whipsawed in their trading, probably continually adjusting their parameters and their buy or sell stops. An an ever-widening spread develops when markets undergo inordinate price swings, and it becomes financial suicide to adjust stop protection. My basic philosophy has always been to “plan the trade and trade the plan.”

I also discuss a strategy with my clients that includes a risk/reward ratio determined by the recent market performance. Another consideration is the possible proliferation of technicians’ buy or sell stops that could exacerbate a move in a particular direction. What also must be considered is the perception by investors who purchase trading programs that they are alone at the particular buy or sell stop points near support or resistance levels. That kind of false sense of protection provides contrarian traders with a trading bonus as markets will eventually find their true intrinsic price levels based on, yes you are correct, supply/demand fundamentals. That’s why I believe that training and trading with an amateur can only assure you of becoming one.

Now for some facts with my usual interpretation.

Interest Rates: June Treasury bonds closed Friday at 133 15/32nds up 5/32nds but down from its intraday high of 134. Concern over the Ukraine situation provided for the move to the “safe haven” of the U.S. Treasury market. For the week yields on the 10 year Treasury note declined by 14 basis points. The upcoming vote could see Crimea moved to Russian control as most of the people consider themselves Russian. We will have to wait and see and then try to determine what if anything the West will do regarding sanctions. For now we see bonds trading within the range we had earlier suggested with prices near the higher end of that range. We are also waiting for next weeks Federal Reserve meeting, the first for the new Chair, Janet Yellen.

Stock Indices: The Dow Jones Industrial average closed at 16,065.67, down 43.22 points and for the week has lost 2.4%. The S&P 500 closed at 1,841.13, down 5.21 points or 0.3% and for the week lost 2%. The tech heavy Nasdaq closed at 4,245.40, down 15.02 points or 0.4% and for the week lost 2.1%. The uncertainty over the ramifications of the Crimea situation remains a concern since it could produce a disruption in the Eurozone energy supply. We continue to feel the U.S. equity market is due for a major correction and once again strongly urge holders of large equity positions to implement risk hedging strategies.

Currencies: The U.S. dollar index closed at 79.55 on Friday, down 20.5 points and for the week lost 1.8%. The decline in yields on U.S. treasuries detracts from dollar investment On Friday U.S. data indicated a decline in March of consumer sentiment to its lowest level in four months. Wholesale prices in February declines as well for the first time in three months. We could see continued pressure on the U.S. dollar based on our expectation of a continued economic contraction. We had been bullish on the dollar and have now moved to neutral. In other currency action the June Euro gained 48 points to close at $1.3906, the Swiss Franc gained 37 ticks to close at $1.1470, the Japanese yen gained 33 points to 0.09876, the British Pound 21 points to $1.6625, and the Australian dollar 5 ticks to 89.69c. The Canadian Dollar lost 25 points to close at 89.92c. We prefer the sidelines.

Energies: April crude oil closed at $98.89 per barrel, up 69c but for the week lost 4% mostly tied to concern over the Crimean situation which could threaten crude supplies from Russia. While there has been some talk about the U.S. ability to make up any shortfall from Russia should they decide to cut off supplies in the face of threatened sanctions, we doubt the U.S. can fully make up that shortfall. We are on the sidelines for now until some determination is made on the Crimea and Russian actions.

Precious Metals: April gold closed at $1,379 per ounce on Friday, up $6.60 or 0.5% against the weak dollar in which it is denominated. For the week gold gained around 3%. Gold, as is the case with U.S. Treasuries, sometimes acts as a “safe haven” hedge when equities decline. We continue to prefer the sidelines in gold but once again, for those that must have a precious metal in their portfolio, we prefer silver. May silver closed at $21.41 per ounce, up 22c or 1% also against the weak dollar. The current Ukraine situation is dominating the market place globally and we prefer the sidelines until the “smoke clears”. April platinum closed at $1,469.60 per ounce, down $9.80 and for the week lost 0.9%. June palladium lost $5.70 or 0.7% to close at $773.25 per ounce and for the week lost 1.1%. We prefer the sidelines but once again our preference would be palladium over platinum.

Copper: May copper closed at $2.95 per pound, up 3c on shortcovering after the recent heavy long liquidation over concerns of a slowdown in China. Copper lost 4.2% for the week and for the year so far has declined by nearly 13%. We have favored the short side of copper for some time and would take profits here.

Grains and Oilseeds: May corn closed at $4.84 ¾ per bushel, down 1/4c on profittaking after recent strength tied to the Monday USDA bullish report on reduced carryout. We prefer the sidelines in corn after having been supportive. May wheat closed at $6.86 ¾ per bushel, up 12 3/4c on continued concerns over weather damage and acreage switches to soybeans. We prefer the sidelines after the recent strength took prices from the $5.50 level. May soybeans closed at $13.90 per bushel, down 6 1/4c on continued weakness over sowings gains. We still like the long
Coffee, Cocoa and Sugar: May coffee closed at $1.98 per pound, down 7.95c on profittaking after recent strength tied to the Brazilian drought. During the session coffee traded as high as $2.05.05. We are now on the sidelines in coffee. May cocoa closed at $2,987 per tonne, down $19 also on profittaking after recent strength. Stay out for now. May sugar closed at 17.28c per pound, down 54 points on continued profittaking after possible overbought condition from the 15c level. Brazilian weather continues to play a roll in softs and for that reason we remain on the sidelines.

See the original article >>

Perfect storm: Cycles, fundamentals converge during critical week

By Jeff Greenblatt

As the Ukraine/Crimea crisis escalates, we’ve heard the West is supposed to announce the “cost” to Russia for this incursion into the Crimea on Monday. Although I always anticipate an important news event to materialize on one of our time windows, it never dawned on me we’d get such an important geopolitical event. This one is big, and the takeaway to the whole thing might be a return of the Cold War.

I doubt very seriously the West is going to risk a major war here. It appears the Russians have factored in Western Retaliation. Last week, a huge withdrawal was made out of a central bank to the tune of $106.1 billion, and the speculation according to a CNBC report is that it is Russia. The Russians might be pulling funding off shore over concerns of retaliation for the referendum in the Crimea. It wouldn’t be the first time since the Russian based Narodny Bank pulled a huge amount of dollars out of the United States and into their London branch back in 1956 when the Soviets invaded Hungary.

I don’t think the market is going to like this. I’ve shown you this chart before but it’s worth looking at again.

This is characteristic of what happens to financial markets during major geopolitical events. This one was arguably the worst one in the entire 20th century, the invasion and surrender of France to the Nazis in 1940. Our takeaway is similar to what happened in 2011. Markets peaked at the start of the crisis, similar to the Arab Spring, and don’t usually bottom until the outcome becomes a foregone conclusion. Since the Russian Duma doesn’t actually vote on annexing the Crimea at least until the end of the week, there’s a chance this could be an old-fashioned major shake of the trees.

Markets have peaked in this window, but even as the VIX has turned up, the usual fear and trepidation is missing. Too many people still view the market as business as usual. Even Warren Buffet announced he was a buyer. Don’t be fooled by Mr. Buffet, none of us have that kind of staying power. Remember he bought halfway through the financial crisis in 2008 and lived to tell about it. This guy probably has more money than a major U.S. city. He’s probably the only one in the entire country who can afford to dollar cost average. For the rest of us, we need to wait until the fear level gets so thick, the headlines come bursting through the television.

Here’s the VIX coming into the new week, and it’s as high as it's been recently. Without fear, the potential is for it to get a lot higher. I’ve been banging the table for well over a year that we need to see a reading near 30 to get a real sustainable move. At least I’m in good company. This week it was none other than Marc Faber who said equities are vulnerable to a 30%-40% hit, simply because we haven’t had a real correction since 2011. He’s right, of course, but most people you listen to in the media won’t tell you that. It's human nature to project the next 12 months based on the prior 12.

Remember, it was a handful of weeks back when I brought the powerful looking green move in the SOX to your attention? I told you at the time I was going against my own methodology of believing strength would hold and believing for the potential that whoever it was that bought in February could end up being part of a huge bull trap? The SOX isn’t there yet, that kind of trap takes time to develop, but here is at least one semi stock that is headed in that direction.

Wisdom is knowing when to follow the rules and when to seriously consider the exception to the rule. This is one of those times, as we are not in a normal market. Don’t let anyone fool you; we’ve been working these market cycle points for the past 15 years, and if you forget everything else I tell you, remember that when cycles complete, they end hard.

You won’t find many bullish sequences like the one we just had. If I had my druthers, we’d have peaked in January and stayed down until now. It would have set up a tremendous buying opportunity. As it stands, for that tremendous buying opportunity to still materialize by the beginning of next week (the end of our time window season), this will have to be a monumental bear week. Fear will have to build as the market drops, if it indeed does drop. This is not a prediction, but for the market to give us the proper buying opportunity, it needs to make up for lost time in February. For the life of me, I can’t understand who was actually buying in the past month. Who buys with big money when the VIX is so low? I will tell you who. It’s those who didn’t buy when they should have and are now chasing performance. That’s why stocks like Altera are developing bull traps. While most semi stocks don’t look that bad yet, if you go around the horn of the entire market you’ll find plenty that are in an advanced state and others in trouble of severe technical damage. Have you seen the HGX lately?

Here’s a chart that has already reached the lower rising channel line and a rupture here could have serious implications. If I’m showing you a lot of charts today for this update, it’s because we have reached the most important stock market week of the entire year. We are coming to 618 days off the October 2011 low at the same time we are hitting the seasonal change point and the Gann Master Timing Date—all by the end of the week. I doubt we have enough time to sell enough to truly hit a bottom by Friday, so I’m starting to think of this market the way I did in 2011 with a first low possible by the seasonal change point.

However, we remember how 2011 turned out. There was a relief rally into May when the perfect storm hit and the oil market collapsed. Depending on how high the VIX can get this week, there’s a chance we could see the end of phase one of this selling by the end of the week. I don’t think 2014 is going to be anywhere close to the performance we had last year.

Part of the reason is the geopolitical situation. I know I’m one of the few stock market guys who is paying seriously close attention to all of the events in the Middle East. This is 2014, and if history is any guide, we are far enough along in the recovery from the financial crisis to be concerned about the geopolitical situation. For those of you who don’t know, the San Francisco earthquake of 1906 precipitated the panic of 1907, and by 1914 (a mere seven years), the world was engaged in WWI. From the crash of 1929, the Japanese were very active early in the 1930s, and Hitler was on the move. On March 7, 1936, has he occupied the Rhineland not even seven years after the crash. We are five years from the bottom but 6.5 years off the 2007 high, so tempers are ripe for this kind of showdown.

I always thought the problem would develop between Israel and Iran.

Do you believe in prophecy? Over the weekend, I had a dream about the passing of Mark Haines. It was a disturbing dream, but I’ve discussed his call for the bottom in 2009 in this space countless times through the years. I believe this dream has something to do with the era of his market call being over. What that could mean is the five-year bull market spawned by his call could be over. I have no technical proof of this other than this massive time cycle that just expired, and only time will tell. All I can tell you is since our big time window hit at the end of February, we’ve seen the Russians move on the Ukraine and a massive jetliner disappear out of the sky.

It seems that what lays in front us is going to be a lot different than where we just came from. Be very careful this week.

See the original article >>

Finally, a Plausible Scenario of What Happened to Flight 370

by Charles Hugh Smith

The scenario that best fits the facts is a spontaneously initiated "drastic political protest" by the captain that went awry.

At long last, a plausible scenario of what happened to Flight 370 has emerged. By plausible I mean that the scenario fits all the known facts.
The key piece of evidence has finally been released by Malaysian authorities: Pilot Spoke to Air Controllers After Shutoff of Data System (NYT.com).
This proves that one of the pilots turned off the ACARS communications link and then reported to air traffic control (ATC) as if all was normal. Twelve minutes later, one of the pilots switched off the aircraft's transponder, which transmits the aircraft's altitude and location.
This sequence of events more or less proves that one of the pilots was in charge of the aircraft. Given the lack of evidence of duress, this sequence strongly suggests one of the pilots was executing a plan of his own rather than following orders of hijackers.
Given the strong political views of the captain and his mastery of the Boeing 777, all evidence points to the captain as the pilot who turned off the communication links and was in command of the aircraft thereafter.

Post-disappearance moves suggest sophisticated handling, experts say (CBSnews.com)
Malaysia Airlines Flight 370 search grows as pilots face increased scrutiny (CNN.com)
Though early reports on the captain were limited to neutral comments by peers that he was a nice guy and a devout family man, the strength of his opposition to the current regime in Malaysia is now coming to light:
'Democracy is dead': 'Fanatical' missing airliner pilot pictured wearing political slogan T-shirt (Daily Mail)

Captain Zaharie Ahmad Shah, a father-of-three, was said to be a 'fanatical' supporter of the country's opposition leader Anwar Ibrahim - jailed for homosexuality just hours before the jet disappeared.
It has also been revealed that the pilot's wife and three children moved out of the family home the day before the plane went missing.
Anwar Ibrahim is a broadly popular democracy icon and former deputy prime minister whose prosecution on a charge of sodomy is seen by many Malaysians as political persecution.
‘Colleagues made it clear to us that he was someone who held strong political beliefs and was strident in his support for Anwar Ibrahim,’ another investigation source said. ‘We were told by one colleague he was obsessed with politics.’
What makes this significant is the Malaysian authorities' attempts to suppress this possible motive.
Malaysian officials initially appeared keen not to direct any suspicion towards Zaharie or his co-pilot, 27-year-old Fariq Abdul Hamid, who was last week revealed to have invited two women passengers into the cockpit and smoked on an earlier flight to Phuket.
But evidence of the way the plane’s transponder and communication systems were disabled and the way the plane was expertly flown over the Indian Ocean apparently using navigational waypoints meant only a skilled aviator could have been at the controls. Investigators were also baffled by why, if hijackers took over the plane, there was no Mayday call or signal from the two pilots to say the cockpit had been breached.
Thus we have motive and clear evidence that it was the captain, not the co-pilot, who was in command of Flight 370. Enraged by the Soviet-style show-trial and imprisonment of his political hero, the captain may have "sabotaged the flight as a form of drastic political protest." Flight 370: Was Hijacking The Pilot’s Political Revenge?
Now add in that neither the co-pilot nor the captain requested each other, and it seems increasing likely that the captain was making it up as he went along, applying his deep knowledge of the aircraft and navigation to sketch out a makeshift initial plan that was dynamically modified along the way.

I think we can easily trace a plausible series of steps the captain initially took, and then speculate knowledgeably about the challenges and decision trees that arose later in the flight.

The first challenge would be to render the co-pilot unable to contest his control of the aircraft. The easiest way would have been to dissolve a sedative in a beverage and coax the co-pilot into drinking the Mickey Finn.
The "mumbling co-pilot" heard by the airline pilot flying to Japan who radioed Flight 370 offers tantalizing (if scant) evidence of this. (Interestingly, that pilot was confident he spoke with the co-pilot, not the captain.)
Alternatively, the co-pilot fought for control of the aircraft, one explanation of the abrupt climb to 45,000, well above the aircraft's designed ceiling.
If there was a struggle, clearly the co-pilot lost that battle or had already been incapacitated by other means.
Another explanation for the climb to 45,000 feet and the subsequent drop to 23,000 feet is that the captain sought to deprive the passengers of oxygen for long enough to render them unconscious but not long enough to kill them.
Given the profile of the captain that is emerging, I see little evidence of a personality who would set out to kill everyone on board, including himself. I believe the evidence strongly suggests a political motive, to embarrass the Malaysian government and perhaps to do so by seeking asylum in another country.
Once again, the key here is to understand the incomplete nature of the captain's plan: after the initial phase was successful--turning off the ACARS and transponder, incapacitating the co-pilot, and moving beyond the range of Malaysia's military radar-- a number of destinations might have occurred to the captain. It's important to note that flying was not just the captain's vocation, it was also his hobby. I think it is safe to say his life revolved around aviation and flying.
Data showing the number of plausible runways where the plane could have touched down - which need to be at least 5,000ft - offer a baffling number of potential locations.
According to a map drawn up by U.S. radio station WNYC, there are 634 locations which could fit, from Australia to the Maldives to Pakistan.
However, the true number is likely to be even higher, as estimates of how far the plane could have travelled have been increased since the calculations were carried out.

Here is the best current map of the possible routes of Flight 370. I have added the decision tree the captain faced: either fly north and seek political asylum or a remote landing site or fly south and search for a remote landing site.


If the co-pilot had regained control of the aircraft, either alone or with the aid of crew and passengers, he would have first turned on the ACARS and transponder and sent a Mayday signal. Since this didn't happen, we can be confident that the captain was in command of Flight 370 for the duration of the flight--roughly 7.5 hours.
While we don't know if the aircraft landed at some point, we do know the last ping to the satellite was at 8:11 a.m., roughly 6 hours after the last military radar contact.
Here are some other points to consider:

The fact that the Malaysian authorities withheld the sequence of events in the cockpit strongly suggest that they quickly identified the potential for a political motivation for the flight deviation and sought to suppress speculation along this line of inquiry.
This also explains why they withheld the military radar data for three days, and their continuing reluctance to share information or come clean about what they know. They fear the truth, and with good reason.
The captain's home flight simulator suggests that he may well have practiced all sorts of landing scenarios, just out of curiosity or to sharpen his skills in outlier situations. Think about it: if you already have over 18,000 hours in the cockpits of advanced aircraft, you're not going to practice conventional landings you could do in your sleep. That would be beyond boring to someone of his experience.
Given the few hours the captain had to assemble his plan, it is likely that once the initial phase was successful, he might have changed his mind, perhaps more than once.
Given his long experience in aviation, I think it very likely that he knew that the primary and military radars in the region were usually turned off at night. Off-the-record confirmations of this have come from Thailand and Indian officials with knowledge of radar covering the Andaman and Nicobar islands.
Thus it is not surprising there were no primary radar sightings in the region: most or perhaps all of the radars were turned off.
It's also worth noting that most of the primary radars in the region have limited ranges--100 miles or less appears to be average. It is more than possible to thread a flight through the gaps in coverage, even if the radars were active.
Let's assume my speculation is accurate and the captain had no intention of crashing the 777 and killing all on board. As I noted in my first entry on Flight 370, if that was his intention (or simply suicide), why fly for hours? Despite his best intentions, he may have encountered some problem that he responded to incorrectly; it's even possible that he missed his intended destination or became confused about his location.
What Happened to Flight 370? An Analysis of What Is Known (March 13, 2014)
The scenario that best fits the facts is a spontaneously initiated "drastic political protest" by the captain that went awry, despite his intentions and experience.

One last thought: since the U.S. must monitor potential airborne threats and nuclear explosions virtually everywhere on the planet (with the exception of Antarctica), why wouldn't the U.S. have wide-aperture thermal imaging assets in space? And if the U.S. has space-based thermal imaging assets, would they be so low quality that the heat signature from two large jet engines would not show up? That seems unlikely.
Since it has long been known that the U.S. has "wired the oceans for sound," (SUBMARINES, SECRETS, AND SPIES - NOVA/PBS) it's also likely that the sound of a large aircraft hitting the water would also have been detected, regardless of the remoteness of the location.
All of which is to say that it seems probable that the global and space-based intelligence gathering assets of the U.S. recorded some sort of signals that could provide clues to the final resting spot of Flight 370.

See the original article >>
Three Breakouts in Gold and Silver Stocks

By: Rambus_Chartology

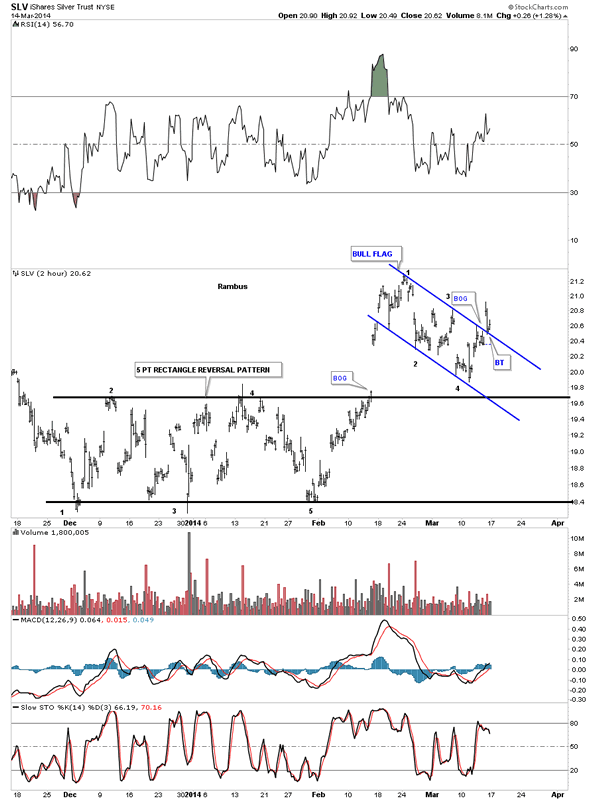
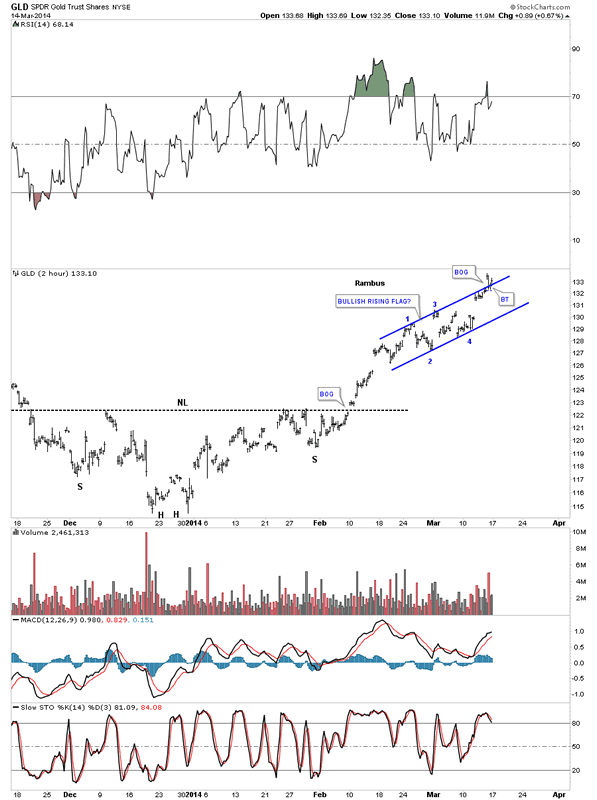
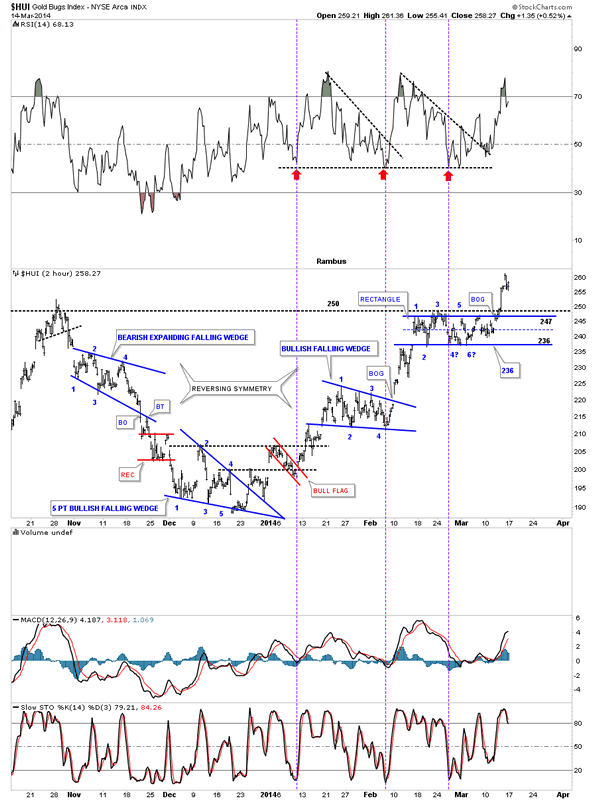
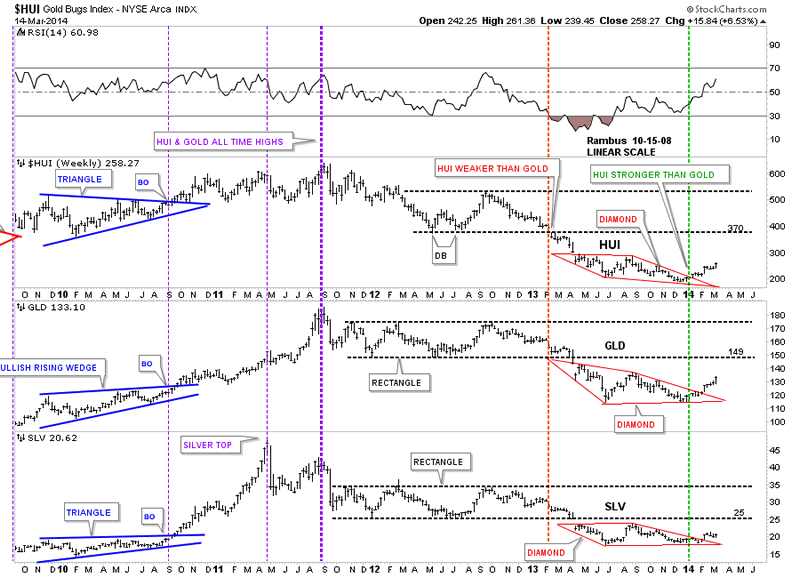
I’ve shown you several comparison charts with the HUI, GLD and SLV that shows they all tend to breakout at roughly the same time. One can sometimes be stronger than the others but they tend to breakout at the same time. This week was no exception. All three broke out of their consolidation patterns this week. Who would have thunk it.

First, lets look at SLV that shows the bull flag we’ve been following since SLV broke out from the 5 point rectangle reversal pattern. Yesterday the price action hit the top blue rail and fell back, just as you would expect on the inital hit. The question was how many bears were on the other side of that top blue rail? Today answered that question without a doubt. The big gap up this morning told us the bears were gone and they are now in retreat looking for new high ground they will try to defend. Below is a 2 hour 4 month chart for SLV that shows the breakout today and the backtest.

Below is a 2 hour 4 month chart for GLD that looks totally different than the SLV chart. They are different but similar if you look at the base or reversal patterns and the consolidation patterns. Here you can see GLD formed an inverse H&S bottom as its reversal pattern. As we all know gold has been stronger than silver so we should look for a strong consolidation pattern. The strongest consolidation pattern that I know of, and nobody recognizes them, is a consolidation pattern that points in the same direction as the trend. As you can see on the SLV chart above the bull flag slopes down against the uptrend. This is what a normal consolidation pattern looks like. When a stock is in a very strong trend it will slope with the trend instead of against it.

Today GLD gapped above the top rail of it bullish rising flag consolidation pattern and did its backtest just as SLV did.

Below is a 2 hour 5 month chart for the HUI. The last time I showed you this chart we were looking for the 6th reversal point as shown by the 6 with a question mark. As you can see the HUI rallied back up to the top blue rail and declined back down about half the length of the rectangle where it found support. That’s all the strength the bears had left so the bulls wasted little time in taking control of the situation. The bears are exhausted and need a new area to defend. The bulls gapped out of the rectangle and are now above horizontal resistance. Folks, from a Chartology perspective, it just doesn’t get any prettier. At some point we’re going to see a consolidation pattern form that will be much bigger than these little ones that have built out so far.

If you recall I mentioned how we were reversing symmetry backup vs how we came down. With more time on this chart now you can begin to see the reverse symmetry taking hold as this rally progresses. I’ve labeled all the reversal points so you can see the battle that goes on between the bulls and the bears. Each reversal point is a skirmish and when the consolidation pattern finally breaks, to the victor goes the spoils. You can see the bears were in control on the way down but since the blue 5 point bullish falling wedge reversal pattern broke to the upside the bulls are now in control.

Weekly comparison chart.

In my humble opinion you can spend every waking minute trying to figure out why is gold and and PM stocks going up. Is it because of inflation, deflation, copper, the stock markets, currencies , War or a hundred different reason’s? If you just follow the price action and devote the time spent trying to find a reason for why, you will be way ahead of the game. You don’t have to know the answer to the question everybody is trying to answer. It’s irrelevant. The answer is right there in front of you if you take the time to understand what the chart is telling you.

See the original article >>
Yuan Implied Volatility Spikes To 2-Year High As PBOC Widens Trading Bans

by Tyler Durden

While Goldman is quickly down-playing the decision by the PBOC to double the size of the daily trading bands for USDCNY to +/2.0% as a risk-off event (just as it was in 2012 - but blame that on Greece as cause rather than symptom), BofA is a little less sanguine about the move noting a more volatile CNY/USD without trend appreciation will deter hot money inflow and perhaps will result in some unwinding of previous inflow. With 1-month volatility spiking to over 4% (its highest in over 2 years), the move is sure to remove some carry traders as risk-rewards break down on their leveraged positions.

Implied volatility is dramatically higher (i.e. the market is pricing in expectations of more volatility going forward) which reduces the risk-reward characteristics of the carry trade and thus removes many players (or at best merely reduces their leverage)...

Via BofAML,

The PBoC widens CNY/USD daily trading band to +/-2.0%

The PBoC on 15 March announced to widen the yuan-dollar (CNY/USD) daily trading band to +/-2.0% from +/-1.0%, effective from 17 March. The previous band widened took effect on 16 April 2012 when the band was widened from +/-0.5% to +/-1.0%.

This should not be a big surprise to the markets as the PBoC has made it clear recently that it would widen the band this year. Perhaps the timing of this band widening is slightly ahead of what markets had expected.

What's the most important message? 

The band widening strengthens the PBoC's signal that the one-way bet on CNY gain is over, and we should expect more CNY/USD volatility going forward. In the PBOC's own words, two-way yuan fluctuation will become the norm. In the past month we have observed falling interbank rates and falling CNY/USD in China. We believe these moves were engineered and coordinated by the PBoC to solve the dilemma (rising rates, rising hot money inflow and rising CNY) it was facing in 2013. 

Where can the CNY/USD exchange rate go? 

Chinese policymakers and academia have reached the consensus that the current USD/CNY (spot rate was 6.15 as of 14 March) is very close to its equilibrium level, so perhaps we will see neither trend appreciation nor trend depreciation in the near term. In the medium to long term, the equilibrium value of CNY/USD will be determined by a number of factors including money supply and inflation in China and the US.

What's next step regarding China's FX regime reform? 

We believe the PBoC won't stop here, but further band widening is of little meaning. A much more important and meaningful reform is to change the mechanism on setting the daily fixing of CNY/USD. In our view, China will eventually shift to a market-based FX regime. As an intermediate step, China could peg yuan to a basket of currencies weighted by the importance of its trading partners. More specifically, the Singapore's BBC (Basket, Band and Crawl) regime seems to be favored. A reform towards a real managed float such as the "BBC" system requires a group of more confident and pragmatic political leaders who are true believers of markets. We think the time is ripe as the current leaders, who consolidated their power base at a much faster pace than expected in 2013, are market oriented.

What's the impact on capital flow and growth? What's the impact on money flow and the economy? 

In our view, a more volatile CNY/USD without trend appreciation will deter hot money inflow and perhaps will result in some unwinding of previous inflow. However, it should not be a big worry as China's has a massive US$4.0tn FX reserves, 20% reserve requirement ratio (RRR) and only 67% loan-to-deposit ratio. If capital outflow risks the stability of interbank liquidity and base money supply, the PBoC has a big room to inject liquidity by cutting RRR or purchasing government bonds. So the only thing we need here is a more flexible PBoC which closely monitors interbank liquidity and interbank rates. Chinese exporters will overall benefit from the band widening which sends strong signal of the end of one-way appreciation of CNY/USD. Note last year CNY appreciated around 6% against its basket, putting big pressure on Chinese exporters.

See the original article >>

Government Waste

by Pivotfarm

Waste is a many splendid thing that in all circumstances we attempt to reduce and get rid of, shunning it like a pariah. Well, perhaps almost all circumstances. There are times when waste is just the by-word for government these days. But, are we all equal in the quantity of waste that is generated in our countries’ governments?

China

Let’s take a look at China which seems to be the place that is cracking down on waste more than most (if we are to believe their figures). The Central Commission for Discipline Inspection (CCDI) stated that there was a fall of 53% of state money spent on meetings, money for official overseas trips was also cut by 39% and there was a 10% reduction in vehicle purchases between 2012 and 2013.

Xinhua, the official news agency of the People’s Republic of China stated that the anti-corruption chief Wang Qishan (March 15th) wishes to have a “Sword of Damocles” hanging over the heads of officials in the government to keep them from wasting public money. Perhaps allegorical and perhaps a moral anecdote, but the Sword is usually seen to be an illusion to imminent and impending, ever-present peril at the court of a tyrant.

Qishan stated that his fight against corruption was taking him to investigating the Ministry of Science and Technology, Fudan University, China National Cereals, Oils and Foodstuffs Corporation and Xinjiang Production and Construction Corps. He would also be looking closely at regional governments such as Beijing City.

The Central Commission for Discipline Inspection under the leadership of President Xi Jinping has been publically espousing the benefits of fighting tooth and nail to break with corruption, shoring up the governments mandate to rule. However, moving away from decades of suspicion, wasteful use of taxpayers’ money and outlandish extravagancies are hard things to inspect and even harder to discipline.

But, we could clearly do with a great deal more of that discipline and a great hefty blow of inspection (independent, of course) in the USA these days, however.

USA

Remember back when the Republicans and the Democrats were wasting our money flogging out the question as to whether or not they should vote the budget despite not having any money? Remember all those people that got told to stay at home and got laid off because Washington couldn’t find the greenbacks for them?

Well, the guys in Washington were certainly able to agree on continuing voting the budget for that Super Twiggy Squirrel advert that was running in Spain and trumpeting the healthy benefits of walnuts grown in California. The Department of Agriculture was spending $200 million a year on that promotion and $3 million went into the adverts. The Republicans and the Democrats voted 322 (only 98 against) for keeping that advert running while the Federal workers got sent home and told to eat humble pie (some of which incidentally were paid $4, 000 per month for doing nothing at all).

Here are some prime examples:

• The Department of Defense continued spending $432 million on the construction of aircraft that will never be put in the air. They have been financing the building of the C-27J Spartan since 2007. Despite having been told that the Air Force considered that this aircraft could not offer superior capabilities during airlift missions and that it could not match the already existent C-130. Since 2012, Congress has been informed that funding of production should stop. It hasn’t. Waste.
• The Department of Defense has thought up the wonderful idea of destroying $7 billion-worth of military equipment and vehicles that are in the Middle East as it pulls out and it feels that it’s too expensive to ship home. Waste.
• $60.4 million that was voted to be spent on Hurricane-Sandy victims should have gone to helping them rebuild things. Instead New York and New Jersey (state-level officials) spent that money on tourist ads. Waste. 
• Children are being taught about the effects of global warming by NASA ($390, 000) through a kids’ show (Green Ninja) via YouTube. Waste.
• Facebook gets a tax rebate (yes it doesn’t pay any tax and gets a refund from the state) worth $295 million. Waste. 
• NASA is searching for signs of intelligent life in space still ($3 million), while we can’t even find a trace of it in Washington itself. Waste.

Boondoggle Bungles by Washington that’s all they are. The examples of waste by Washington lead us to question every day what the government is actually doing with our money.

Governments don’t tend to ever cut back on wasteful spending. They reduce the level of services available to citizens and they attempt (perhaps outwardly) to continue providing that same service. That means that the federal workers just have to do more with less. But, it doesn’t ever limit the scope of the government. It rarely reduces the possibility of getting access to money that is embezzled, diverted or exploited by those that are in positions of authority.

The true question that comes to mind however is whether or not the government is a waste or just completely wasted when it thinks up he reasons why it should spend out hard earned tax-payers’ money on frivolous, questionable things. Baked, folded, call it what you will. But, governments when wasting must always be belligerent when it comes to justifying why they spent that money. Always remember that attack is the best form of defense; we all know that.

What a waste, government!

See the original article >>

Follow Us