Friday, June 17, 2011

Textbook Bounce Off the 200-day Moving Average

By Barry Ritholtz 

After gyrating much of the day, the S&P500 bounced off the the 200-day moving average (which also coincided with the December 2010 close) just like a page out of a technical analysis textbook. The bounce helped rescue Apple from some very ugly price action, which pierced its 200-day moving average for the first time since September 2008, x/ the flash crash, trading down to $318.33 before recouping most of its loss with a strong close.

If the “new economy” lead by Apple rolls over, the global markets are in for world of hurt. The tech sector is becoming impatient and in need of a new burst of innovation in order to get lathered up and spark a new rally. The upcoming earnings season will also be a key test to see if the strength of the corporate sector can chase away the flock swans currently weighing on the markets. The perception of “good micro/bad macro” is one of the reasons why markets aren’t down even more, in our opinion.

A test of a market in distress is the health of the first bounce. We’re going to give this one some room while keeping one hand firmly on the rip cord. The flock of high impact McSwans currently converging on risk markets is a scary proposition and those who should have sold or got short probably already have. Furthermore, the U.S. equity market does feel a bit, at least to us, sold out.

As the markets obsess over Greece, which has clearly priced a default, we’re more focused on the “blind side” as the Hang Seng and the Shanghai break support and continue in their death spiral. A fairly bumpy or hard landing in China is not priced, in our opinion, and if equity premiums continue to blow out in both of these markets, it would signal a higher probability that the negative case is going to be realized.

Markets price perception before reality and the trick is not only to determine the probability of the perception becoming reality, but also to assess if a potential state of reality is perceived and priced into the markets. 
Cheerleaders will always maintain the negatives are priced and have a stronger case for their argument if there is only one major issue weighing on the market.

But the current environment is much more difficult to navigate, where a flock of macro swans — including European Debt, China hard landing, the QE2 endgame, Japan supply chain issues, global economic slowdown, natural disasters, and commodity price inflation – are batting the market around like a piƱata. This, therefore, warrants more caution and greater risk mitigation.

Anyone who maintains with certainty where we’re headed should be willing to lend you their yacht for a nice Caribbean vacation/cruise. And don’t those doom and gloom talking heads sound like annoying fax machines? We have to shut them off even if they may have some valid points. Stay tuned and remember the 11th Commandment: those who remain flexible shall not be broke(n).

See the original article >>

Weekly Commodity Report

by Mike Roberts

DAIRY CLASS III futures on the Chicago Mercantile Exchange (CME) closed up with the exception of the November 2011 and the December 2011 contracts. The JUNE’11DA contract finished at $19.15/cwt; up $0.08/cwt and $0.14/cwt over last report. JULY’11DA futures finished at $19.77/cwt; up $0.16/cwt but $0.40/cwt lower than this time last week. US cheese prices are above Oceania benchmark prices for the first time since 2009. From January 2010 US prices have run $0.32 below Oceania. Oceania cheese output is lower on the seasonal end of the milk year. Interest is fair-to-good with fresh deals on-going. US cheese exports were up 68 per cent from this time last year for the first four months.

CWT accepted bids for export assistance on sales of 3.5 mi lbs for delivery through the end of the year. Cheese sales are a key economic component of the US dairy industry. More and more US milk production is being allocated to cheese making. Almost 188.9 bi lbs of milk were marketed in the US with 127 bi lbs used for dairy product manufacture with cheese production making about 65 per cent of that. Continued growth in cheese consumption is a key factor in determining a good market outlook for the US dairy industry. The chart by USDA below shows this. More information can be found at: http://www.ers.usda.gov/Publication/LDP/2010/07Jul/LDPM19301/LDPM19301.pdf 

LIVE CATTLE futures on the Chicago Mercantile Exchange (CME) closed up on Monday. The JUNE’11LC contract closed at $103.200/cwt, up $0.475/cwt and $0.80/cwt over last report. AUG’11LC futures closed at $104.025/cwt; up $0.550/cwt and $0.70/cwt higher than last Monday. Traders leaving short positions and reduced corn prices weighed on futures. At the opening bell fat cattle dropped in reaction to a strong dollar, lower crude oil, a weak stock market, and profit taking. However, the turnaround picked up steam in the pits and never let up. USDA on Friday put beef exports for April at 223.20 mi lbs, down from March’s 245.29 mi lbs but up from 177.175 mi lbs a year ago. An increase in boxed-beef prices added support amid worries about demand that are limiting upside potential.

USDA on Monday put choice beef prices at $172.54/cwt; up $0.99/cwt but $4.39/cwt lower than a week ago. A sluggish economy is not good for beef demand because it encourages consumers to buy cheaper cuts of meats, as well as turn to other sources of protein such as chicken and pork. USDA put the 5-area-average at $106.04/cwt; $1.32/cwt higher than last week at this time. According to HedgersEdge.com, the average packer margin was lowered $50.10/head from a week ago to a positive $49.00/head based on the average buy of $105.77/cwt vs. the average breakeven of $109.63/cwt. Prices are expected to soften in the coming weeks as more cattle at heavier weights come to market.

FEEDER CATTLE at the CME closed up on Monday in light volume. The AUG’11FC contract settled at $124.775/cwt, up $1.150/cwt and $0.675 higher than this time last week. The NOV’11FC contract settled at $128.775/cwt, up $1.175/cwt and $1.425/cwt over last report. Profit taking after Thursday’s gains held upward momentum in check. Gains despite the weakness were due in part to traders exiting short positions. Estimated receipts in Oklahoma City were put at 7,600 head vs. 6,115 last Monday and 7,265 a year ago. Compared to last week demand was moderate-to-good for feeders while calves were steady to $2/cwt higher. The latest CME feeder cattle index was placed at $124.33; up $0.19 and $0.20 over last report.

CORN futures on the Chicago Board of Trade (CBOT) closed down on Monday after recently reaching life-of-contract highs. The JULY’11 contract closed at $7.824/bu; off 4.5 ¢/bu and down 50.5 ¢/bu. The DEC’11 contract closed at $7.044/bu; down 8.0 ¢/bu and 37.5 ¢/bu lower than this time last week. Speculators, funds, and even farmers got in gear selling corn taking profits while improved crop weather, and lower crude oil pressured prices. Grain supplies are expected to remain very tight for two or three years given USDA’s recent projections released last week. Corn that got planted and not drowned out is expected to do well. Even though large funds cut net bull positions nearly 5 per cent, bull positions cover 9.8 bi bushels while there are 9.4 bi bu in short positions.

USDA’s World Agriculture Supply Demand Estimate (WASDE) projected US feed grain supplies for 2011/12 sharply lower. Planted acres were lowered 1.5 mi ac from March. Harvested acres were lowered 1.9 mi ac to 83.2 mi acres on reduced planting and flooding. Production is projected at 13.2 mi bu, down 305 mi bu from the May WASDE report but still a record 753 mi from 2010/11. Ending stocks were lowered 35 mi bu showing a stocks-to-use ratio of 5.2 per cent compared to 5.4 per cent last year. The season average farm price is now projected at $6-$7/bu. More harsh weather could drive corn prices beyond $8/bu. USDA put corn-inspected-for-export at 32.084 mi bu vs. estimates for 30-35 mi bu. Weather will drive prices the next few weeks. Fundamentally, corn prices should remain strong for some time to come. 

SOYBEAN futures on the Chicago Board of Trade (CBOT) closed mixed on Monday. The JULY’11 contract closed at $13.826/bu; down 4.5 ¢/bu and 6.0 ¢/bu lower than last report. NOV’11 soybean futures closed 5.0 ¢/bu lower at $13.766/bu but 40.0 ¢/bu higher than last report. Deferred contracts were gainers. Although adverse weather has slowed soybean planting progress production estimates remained unchanged. Lower export projections for 2010/11 contribute to higher beginning stocks. Exports for 2010/11 were reduced 10 mi bu to 1.54 bi bu. US soybean ending stocks for 2010/11 are now projected at 180 mi bu vs. the previous 170 mi bu. Export expectations for 2011/12 were down 20 mi bu to 1.52 bi bu on competition from South America’s big crop. With larger supplies and reduced exports, ending stocks for 2011/12 were up 30 mi bu to 190 mi bu. The US season average farm-gate price for 2011/12 is now projected at $13-$15/bu; up $1/bu on both ends of the range. USDA put soybeans-inspected-for- export at 6.78 mi bu vs. expectations for 7-10 mi bu. Fundamentally some signs of price weakness are showing.

WHEAT futures in Chicago (CBOT) closed down on Monday on support from the red-hot corn market. JULY’11 futures finished 16.25 ¢/bu lower at $7.430/bu and 10.0 ¢/bu lower than last report. The DEC’12 contract closed at $8.164/bu; off 9.25 ¢/bu and 26.75 ¢/bu lower than this time a week ago. Investors exited bear spreads, buying nearby wheat and selling deferreds. Volume was the largest since August 2010, with more than 250,000 lots changing hands. This is more than double the 30-day and 250-day averages.

The USDA WASDE report lowered supplies for 2011/12 wheat on reduced carry-in offsetting increased production expectations. Beginning stocks were lowered 30 mi bu on lower imports and higher exports expected for 2010/11.

All-wheat production for 2011/12 was raised 15 mi bu to 2.058 mi bu. Winter wheat production was raised 26 mi bu. US wheat usage for 2011/12 remained unchanged, above the 10- year average. The US season farm-gate price for the 2010/11 was raised 5 ¢/bu to $5.70/bu while the 2011/12 price was projected at a record $7-$8.40/bu; up 20.0 ¢/bu cents on both ends of the range. Exports were neutral with USDA putting wheat-inspected-for-export at 23.93 mi bu vs. expectations for 23-26 mi bu. Wheat prices should remain steady-to-firm.

LEAN HOGS on the CME closed mixed on Monday with most contracts up except for the August ’11 and April ‘12. The JUNE’11LH contract closed at $92.475/cwt; up $0.775/cwt and $2.775/cwt higher than a week ago. AUG’11LH futures closed at $92.375/cwt; off $0.450/cwt but $3.325/cwt over last report. Hogs posted solid gains on higher cash pork prices. Supplies look to be tightening. Consumers are expected to start buying more pork over beef as the economy limps along. US exports were good. There was fresh news that South Korea will double tariff-free pork imports to 260,000 metric tons. USDA put the pork cutout at $90.71/cwt; up $1.83/cwt and $0.94/cwt higher than this time last week. According to HedgersEdge.com, the average packer margin was lowered $4.95/head to a negative $8.35/head based on the average buy of $68.06/cwt vs. the average breakeven of $64.97/cwt. The latest CME lean hog index was placed at $90.58; up $0.07 but $0.96 lower than last report.

Uganda inches towards coffee production goal

by Agrimoney.com

Uganda, one of the world's most historic coffee producers, is this year to make only limited progress towards a goal of raising production record levels reached in the 1990s, despite some headway in tackling disease and agronomic setbacks.
The African country, which gave the world the robusta coffee variety, is to lift production by 200,000 bags to 3.2m bags in 2011-12, matching its highest of the last decade, US Department of Agriculture attaches said.
"Production is expected to increase slightly because farmers have renewed interest in coffee farming due to strong coffee prices and reinvigoration of the industry" stemming from a government "reinvigoration" campaign, the attaches said in a report.
"As a result of both, agronomic practices have improved and yields have increased."
Indeed, yield increases to 1.2 kilogrammes per tree, from 0.5 kilogrammes, have been achieved from measures such as planting robusta trees resistant to coffee wilt and government assistance to farmers with efforts such as pruning.
'Number of challenges'
Nonetheless, the Ugandan harvest remains way below the 4.5m bags the government is targeting by 2015, a harvest that would beat the record 4.3m bags set in 1997. Ugandan output topped 4m bags even in 1969, when it ranked significantly above Vietnam, now the world's second-ranked producer.
Attaches flagged "a number of challenges" to the campaign, including "unpredictable weather, pests and diseases and declining soil fertility".
"In addition, coffee tree replacement has not occurred at projected levels."
Exports were forecast rising by 200,000 bags, in line with production, in 2011-12 to 2.8m bags, an eight-year high but still well below levels above 4m bags reached in the 1990s
Weather setbacks
Uganda's drive to lift coffee output was dented in 2009-10 by persistently dry conditions in parts of the east and centre of the country, which account for more than half of production.
More recently, drought has hit parts of neighbouring Tanzania too, a factor in part behind a Tanzania Coffee Board forecast that production will fall nearly 20% to 750,000 bags (45,000 tonnes) in 2010-11.
The USDA attaches, who also pegged the Tanzanian crop at 750,000 bags, also cited a two-year cycle in Tanzania of higher and lower production seasons, as occurs in Brazil.
See the original article >>
Evening markets: wheat leads sell-off as funds run for cover

by Agrimoney.com

Is this the end of the world as we know it?
It certainly felt that way, looking at the wreckage left in the grains markets by another day of liquidation, this one, by some measures, the biggest yet of the current run.
Chicago wheat for July slumped 5.0% to close at a three-month low of $6.73 ¼ a bushel, taking its decline so far this month above 14%.
Another day like this, and we will be talking 11-month bottoms.
'Dramatic liquidation'
OK, Chicago corn for July avoided touching, for a third successive day, the maximum downside allowed by the exchange.
But its finish down 3.7% at $7.01 ½ a bushel was hardly pretty. The contract has lost 11% this week alone.
And in terms of the fund exit, it was the worst day yet, with an estimated 21,000 lots sold, up from 20,000 the day before and 16,000 on Tuesday. The week's tally of sales is pegged above 60,000 contracts.
"There continues to be dramatic liquidation in the July corn contract as a large amount of longs want out of the 'long July and short December' position," Darrell Holaday at Country Futures said.
Indeed, losses in the new crop December lot were - relatively – small, at 2.3%, leaving the contract at $6.53 a bushel.
For the record, the rally spread to many other grains too, with oats, for instance, losing 3.1% to $3.56 a bushel for July – down 11% in three days.
'Slipping on Greece'
The sell-off was blamed largely on macro-economic alarm bells, triggered by weak US economic data, China's ongoing battle against inflation, and the Greek debt turmoil.
"Traders are placing big bets on the timing of the eurozone break-up," Darren Dohme at Powerline Group said, noting that Greek bonds were now paying 18% interest – rich returns for the fearless.
"Everything seems to be slipping on Greece," Jurgens Bauer at PitGuru said.
But to differing amounts. Sure other risk assets were out of favour, and the dollar made a little bit more ground, making dollar-denominated assets such as many commodities less competitive.
Yet other raw materials coped with the sell-off far better. Crude oil was showing small gains in late deals, while copper fell less than 1%. As did the overall CRB commodities index, which lost 0.6%.
Second time (un)lucky
Farm commodities would appear to be first in the firing line. And some selling certainly appeared justified, when some fundamental signs are weakening, and chart patterns are flashing sell.
"The weather premium has been pulled out of these markets," Mr Holaday said.
US Commodities said: "The US Corn Belt has non-threatening weather all the way to the 15-day forecast. The dry Mississippi Delta is expected to receive rain in the pollinating corn and double crop soybean areas."
Benson Quinn Commodities said: "Growing conditions in many key corn growing areas are close to ideal."
Furthermore, the US Senate voted again on removing tax perks for ethanol, which has been a cloud over corn, the biggest feedstock for bioethanol plants. And this time the vote went through, by 72 votes to 37.
'False sense of security'
Still, there was some idea that selling might have been overdone.
"Farmers have a long time to go and a lot of problems to deal with before we can assume the recent move is fundamentally warranted," Matthew Pierce at PitGuru said.
"Chinese demand will surface on this break so let's not kid ourselves into a false sense of security concerning the US crop.
Indeed, there has been talk of further corn purchases by China in recent days, way above the 65,000 tonnes which appeared in weekly US export sales data.
'Ethanol will run full speed'
In fact, the overall export sales data were viewed as OK, coming in at 894,000 tonnes, old crop and new, for corn, 456,000 tonnes for wheat and 177,000 tonnes for soybeans, all within the range of market expectations.
And bulls have an extra crumb of comfort in oil's resilient performance, compared with corn, restoring profitability to ethanol plants.
"Ethanol profits are very good, and ethanol will run full speed through early July with these margins locked in," Mr Holaday said.
Furthermore, Informa Economics came up with some bullish data, lowering its forecast on US corn plantings by nearly 1.3m acres to 90.6m acres, and its estimate on seedings of wheat (other than durum) by nearly 800,000 acres to 13.3m acres, thanks to the wet-delayed sowing season.
The data even temporarily revived markets when they were released.
Limit down, again
Soybeans once again proved relatively firm, shedding a modest 1.3% to $13.50 ½ a bushel for July, in part down to the unwinding of "long corn, short soybean" spreads, but also lacking the major fund exodus.
Funds were estimated sellers of 6,000 soybean contracts.
Cotton, however, was not so lucky, as a, rare, non-food-related farm commodity, more linked to discretionary spending, and so especially sensitive to economic concerns.
New York's July cotton lot ended down the exchange limit of 6.0 cents at 145.96 cents a pound for July delivery, with the December contract falling 5.62 cents, or 4.5%, to 120.18 cents a pound.
And this when US weekly export sales showed their first positive reading for old cotton since early March, if only a modest one of 10,100 running bales.
Winners' corner
To gain on Thursday required some special help.
Paris wheat had it, from a euro which sank to a record low against the Swiss franc and a three-week bottom against the dollar, making eurozone exports more competitive. It also helped that the Paris exchange closed before Chicago wheat touched its day lows.
The November contract finished up 0.3% at E216.00 a tonne.
London wheat was also relatively firm, dipping 0.9% to £173.50 a tonne for November delivery, although growing amounts of rain in the UK are reviving crop prospects.
Sugar had a Brazilian cane crop downgrade from Datagro to support its price, besides continued talk about port delays in the South American country and second-ranked exporter Thailand too.
New York raw sugar for July closed up 3.4% at 25.92 cents a pound.

Cattle futures surge as packers pay up

by Agrimoney.com

Cattle futures rose the exchange maximum in Chicago – in sharp contrast to the slump in crop prices – after data showed buyers paying up for animals, even in the face of a stream of supplies from drought hit Mexico.
Futures in both live cattle, animals fattened for slaughter. and feeder cattle, those ready to be put into feedlots closed up the limit of 3.0 cents a pound, at their highest in nearly a month, even as grains and many soft commodities posted another session of heavy losses.
The jump followed reports of meat packers paying up to $109 per hundredweight for fattened cattle on cash markets, up some $3 on the day.
US beef export sales came in at 15,800 tonnes, according to weekly government data, keeping the country on track to complete its recovery, in trade volume terms, from losses sustained following a BSE outbreak in 2003.
'New trend higher'
The data were seen as fuelling a round of covering by speculators of short positions –that is, bets on falling prices.
"It's been a while since we have had cattle and feeder cattle up the limit," Mike Mawdsley at Market 1 said.
"Of course, funds have been short."
And the revival raised hopes of an end to a correction which, at its early-June nadir, took feeder cattle prices down 14% from their record high in early-April, and live cattle down 18%.
"Fundamentally, it feels too early for this upside breakout, but the market is saying it's time to go," Jerry Stowell at Country Futures said.
"The market now looks poised to start a new trend higher."
'Could endanger animals'
The rise in cattle prices comes at a time when many ranchers in the southern US and Mexico have been running down herds in the face of drought which has left little pasture.
Indeed, the "principal forage-producing states of Mexico are facing extreme drought conditions that could endanger animals, particularly if critical rainfall is not received in June and July", the rainy season for these areas, US Department of Agriculture analyst Rachel Johnson said.
Some 40% of Mexico is suffering a drought billed by President Felipe Calderon as the worst in seven decades – while 2010 was the rainiest year on record.
US cattle imports from Mexico, often this year for placement directly on feedlots given the shortage of pasture, have remained firm after jumping 28% in the first four months of 2011, compared with year-before levels
"These higher imports have been maintained in recent weeks, as weekly [official] data reports through the first week of June also show cattle imports from Mexico 27% higher year-over-year," Ms Johnson said.
Staying north
Conversely, exports of live sheep from the US to Mexico tumbled below 5,000 animals in the first quarter to their lowest in at least six years, and down by two-thirds on the same period of 2010.
US sheep exports to Mexico hit 22,000 animals in the April-to-June quarter last year.
The US Department of Agriculture will on Friday release monthly data expected to show placements of cattle on feedlots falling 7.8% in May from a year before, as supplies of feeder cattle wane.

See the original article >>
Dollar pause at resistance, Nyse on support

by Kimble Charting Solutions


Basic breakdown for basic materials?

by Kimble Charting Solutions


See the original article >>
WHY WE BELIEVE WE ARE IN A SECULAR BEAR MARKET

By Comstock Partners

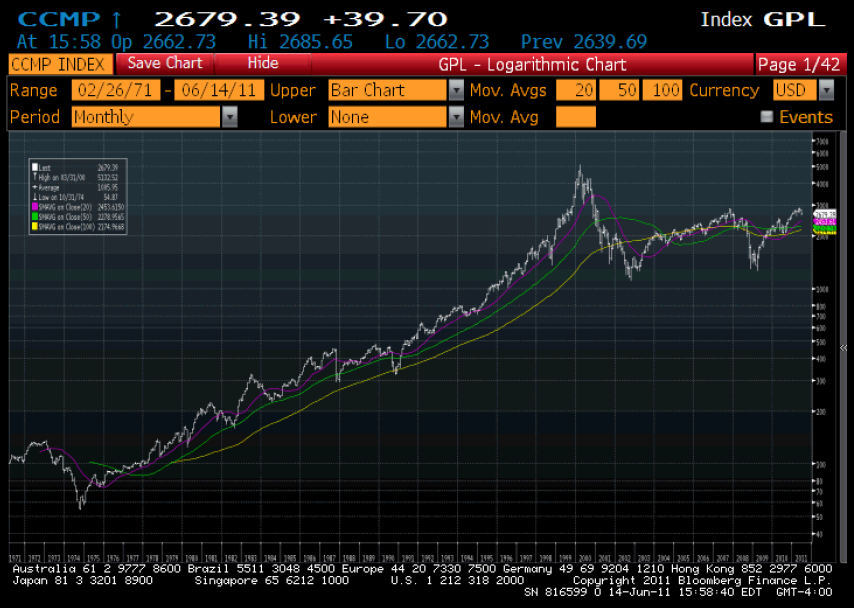
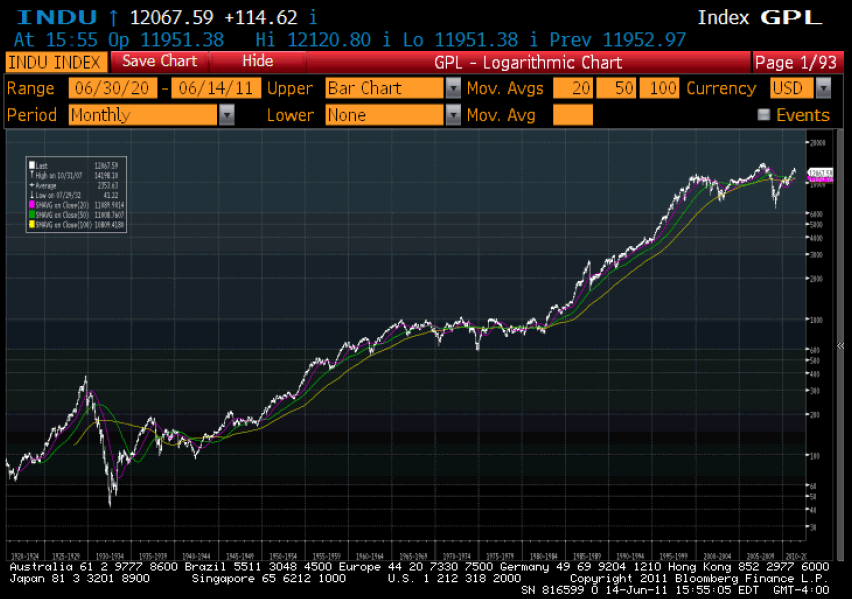
Looking back at the long history of the U.S. stock market it is clear that there are long periods when the trend is distinctly up or down. We call these long trend “secular” markets as opposed to the commonly-known cyclical market trends that last about four years on average. In our view we are currently in a secular bear market that began when the market peaked over 11 years ago in early 2000.

The most powerful secular bull market took place in the 18-year period from 1982 to 2000. In this period the market rose from 777 on the DJIA to almost 12,000 (16% compounded/year); the S&P 500 from about 100 to 1550 (16% compounded/year); and the NASDAQ from about 160 to 5050 (22% compounded/year). Although there were two other powerful secular bull markets such as the periods from 1921 to 1929 and 1949 to 1966, the bull market of 1982 to 2000 was the most significant by far.
S&P 500
Nasdaq Composite

Dow Industrials
The last half-decade of the 1982-2000 advance was accompanied by arguably the most spectacular financial mania of all time. Stocks, most often in the technology sector, typically went public and tripled on the first day of trading. The so-called dot.com stocks often had no earnings while others were merely concepts that didn’t even have revenues. To justify the ridiculous prices of these stocks, analysts came up with new and untried metrics such as the number of eye balls that were viewing or would be viewing their websites rather than fundamentals such as earnings or cash flow.

Starting in the late 1990s Comstock constantly warned clients how sick the mania had become. We did this through lengthy bi-monthly reports in print and later through brief comments on our website. Although we were too early, our judgment was finally vindicated for all of the right reasons once the stock market finally peaked in early 2000. At that time we were convinced that the market was entering a secular bear market that would last for many years. The combination of the extremely powerful 1982-2000 bull market accompanied by a senseless financial mania was the recipe for the start of the secular bear market we envisioned.

You would have to think this secular bear market would be extremely severe with the combination of a major bull market followed by a financial mania. The market did decline by about 50% but the powers that be did whatever possible to delay or reverse the secular bear. Fed Chairman Greenspan tried to stop the severe stock market decline by lowering the Fed Funds rate to 1% in mid 2003 and keeping it at that level for a year. This move stopped the bear market in its tracks. The low rate enabled home prices to accelerate to the upside, and congress jumped in to help the Fed with the rescue by passing every law they could to make it easy for virtually anyone to buy a home.

This started the housing market on a tear (or bubble) since anyone who wanted to buy a home was able to do so by putting up little, or no money. Many of these loans were called “no doc” loans which meant that there was no documentation (like annual salary) required in order to get the mortgages approved. This caused a housing mania that was exacerbated when investment banks packaged the loans and sold them to their clients. They wound up selling packages of very poor quality mortgages (sub-prime) called “collateralized debt obligations” (CDOs) and convinced the rating agencies (who were paid by Wall Street) to rate these “securitized mortgages” AAA. To make things worse, most of the brokerage firms that understood the toxicity of these CDOs protected themselves by buying “credit default swaps”, which were paid off when the loans defaulted.

Now, if the most significant bull market in U.S. history, that drove the stock market to “nose bleed” levels, followed by a dot com financial mania wasn’t enough to start the secular bear market, what would? Well the market did drop by about 50% in 2000-2003 and was on its way to completing the secular bear. But, when the Fed induced a housing market mania accompanied by a cyclical bull market in stocks (within a secular bear) you would think that when the secular bear resumed it would be more severe and deeper. So far, it did produce another 50% decline in the stock market in 2008 and early 2009 as a credit crisis in 2007 caused the worst recession since the Great Depression.

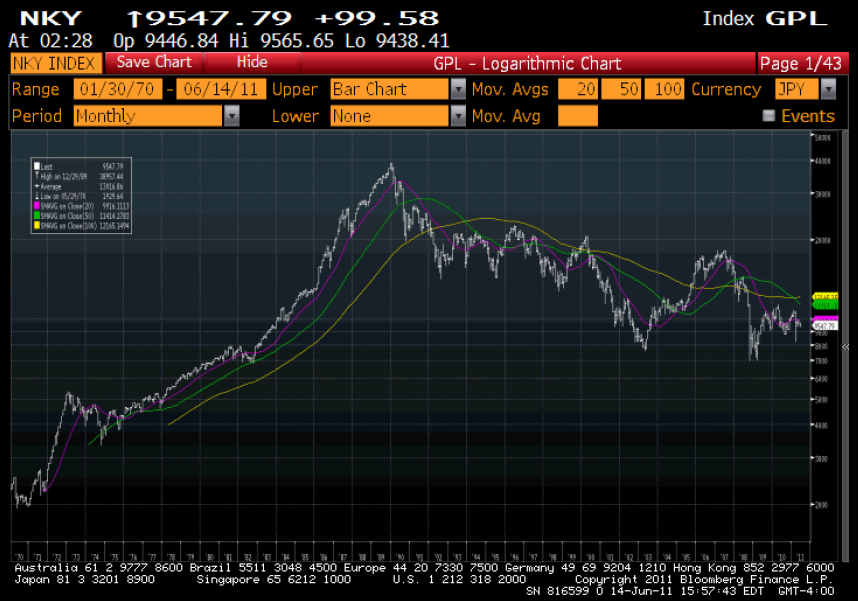
The major 50% decline in the market also fit the same path as Japan as one of our “special reports” discussed in 12/2/2010 “Is America Following the Same Path as Japan?” Japan “hit the wall” after experiencing a similar stock market move from 1972 when the Nikkei 225 was trading about 2000 until the end of 1989 when it reached over 39,000 (18% compounded/year). If you recall it was in the late 1980s when everyone believed that Japan would take over all the manufacturing in the world. At one time the U.S. had a robust TV industry until Japan essentially took over the industry and made virtually every U.S. TV in the late 1980s. This move up in Japan was driven by excesses in the non-financial corporate debt side. That was when Japan corporations bought Pebble Beach and Rockefeller Center and anything else that was for sale. Japan paid the price for the excess debt- driven bull market that drove the Nikkei to almost 40,000 and now is under 10,000 over two decades later.
Nikkei 225
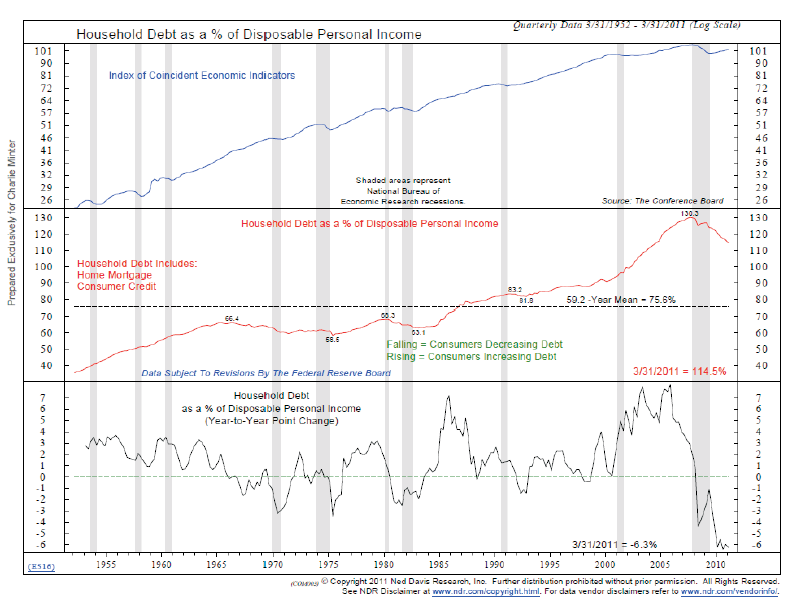
The key 18 year bull market we experienced here in the U.S. ending in 2000 was driven by excesses in household debt. Although wage growth had flattened out, consumers wanted a larger home, a nicer car, and nicer clothes whether they could afford it or not. If they ran out of money with their credit cards and bank loans they would take out a second mortgage on their homes that they felt could never decline in value. Household savings rates, which usually averaged about 9%, fell to near zero. Household debt as a percentage of GDP generally averaged about 50% of GDP and 65% of personal disposable income (PDI). However, starting in the early 1980s (as the stock market started this amazing bull market run discussed earlier) household debt rose to 100% of GDP and 130% of PDI by 2008.
Once the secular bear market started in 2000 we were convinced that the U.S. public had learned their lesson and would start to pay down their debt and begin saving again. We were wrong. After Greenspan lowered rates and started another financial mania driven by home values and the stock market, we were again convinced that the public couldn’t be fooled again. However, after enormous bailouts of the largest financial institutions in the country, as well as the auto industry, and even more monetary ease than in 2003 (accompanied by TARP, the stimulus plan, QE, and QE2); we started another cyclical bull market within the secular bear market. The stock market went from severely oversold in March of 2009 to gaining 100% from those levels. We are convinced that, after the latest 100% rally since March of 2009, that this was the last time the public could be fooled again. And this time we are able to determine that consumers are saving more and consuming less; we believe this change in attitude will continue for a long period of time, creating severe headwinds against strong economic growth.

The most important question to ask yourself is, “can we have another major bull market in U.S. stocks anytime in the near future?” We believe the answer is a resounding “NO”! Just look at what took place in Japan after their stock market and economy “hit the wall” at the end of 1989. The private sector corporate debt that was primarily responsible for the most significant bull market in Japan’s history continued deleveraging for decades. Government debt rose in order to replace the shrinking of the non-financial corporate debt (the debt that drove their bull market) that was either defaulted on or paid off. If the non financial corporate debt drove the market up during their great bull market, it only makes sense that their stock market (Nikkei 225) would decline as the deleveraging process was taking place. And that is exactly what has been taking place for the past 21 years (since 1989) as the Nikkei declined from almost 40,000 to under 10,000 where it is presently. We also note that during the past two decades Japan’s GDP grew at an average annual rate of only 1%.

Why would we expect any different outcome in the United States as the household debt sector (the main sector that rose and drove the U.S. bull market of the 80s and 90s and also continued adding to the debt as the housing market took off from 2003 to 2007) is still in the process of deleveraging since 2007? That is just a little over 4 years, and we can expect a continuation of deleveraging for many years to come-we have a long way to go in order to get back to the levels of household debt relative to GDP or Personal Disposable Income (PDI). (See attached below)
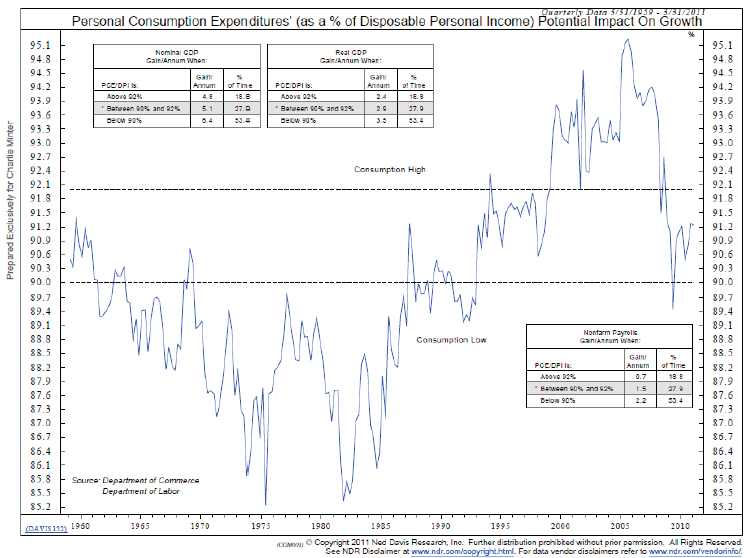
The U.S. stock market will not be able to rise in a sustained manner if we are correct in believing that U.S. households will continue deleveraging for the next few years to as many as 10 more years. The key is that household debt will have to decline to the levels of the 1950s, 1960s, and 1970s of 50% of GDP and 65% of PDI. That would mean the weak consumption will continue and that should lead to disappointing economic growth. The average growth in consumption over many years grew at about 3% and over the past 13 quarter’s consumption only grew by about ½% per year-that is the lowest growth rate since the Great Depression.
So the next question is, “How will the deleveraging affect the economy? And how will a weak economy affect corporate earnings? “ If the deleveraging affects the U.S. economy the way Japan’s deleveraging affected their economy over the past 21 years, it will clearly be highly negative for U.S economic growth. Since GDP growth and profits are positively correlated over time that should negatively affect corporate earnings that have driven the stock market up for the past couple of years.

Now that operating earnings estimates for the S&P 500 have risen to the record levels of $100 again, we suspect that the deleveraging and weak economy will affect this estimate in a similar vein as in 2008, when S&P 500 earnings estimates were over $108 as into May of that year. Actual earnings came in at less than $50 for operating earnings and less than $15 for “reported” earnings.

The bottom line is that we expect U.S. stocks market to stay in the secular bear market that started in 2000 for many years to come. We believe that main factor that drove the most significant bull market in U.S. stock market history (household debt that enabled unrestricted consumption of everything from goods and services to homes) will reverse and continue the deleveraging process that will more than likely continue for a very long time. This deleveraging will act to affect the stock market in the exact opposite manner as the leveraging did in the bull market. To quantify this, if we were to look at historical household debt relative to GDP and DPI we would expect the debt to be in the area of about $7 to $7.5 trillion. Instead this debt rose to about $14.5 trillion at the peak in 2008. We expect this debt to fall below $10 trillion. That could take many years and be very painful for our economy and stock market.

Goldman, JP Morgan Have Now Become A Commodity Cartel As They Slowly Recreate De Beers' Diamond Monopoly


About a month ago we reported on an inquiry launched into JPM's "anti-competitive" and "monopolistic" practices on the LME which have resulted in artificially high prices for a series of commodities which had been hoarded by the Too Big To Fail bank. Today, the WSJ continues this investigation into a practice that is not insular to JPM but also includes Goldman Sachs and "other owners of large metals warehouses" which can simplistically be characterized as a De Beers-like attempt to artificially keep prices high for commodities such as aluminum, courtesy of warehousing massive excess supply, artificially low market distribution of the final product, while collecting exorbitant rents in the process. Specifically, "Goldman, through its Metro International Trade Services unit, owns the biggest warehouse complex in the LME system, a series of 19 buildings in Detroit that house about a quarter of the aluminum stored in LME facilities. Coca-Cola and other consumers say that Metro in particular is allowing the minimum amount of aluminum allowed by the LME—1,500 metric tons a day—to leave its facilities, and that Metro could remove much more, erasing supply bottlenecks and lowering premiums for physical delivery in the process. Coca-Cola, which has complained to the LME, says it can take months to get the metal the company needs, even though warehouses are allowing aluminum to come in much more quickly. Warehouses, meantime, collect rent and other fees." It is not only Goldman's Metro operations, but includes JP Morgan's Henry Bath division, and naturally commodities behemoth Glencore, all of which are taking advantage of the LME's guidelines and rules which make the imposition of a pseudo-monopoly an easy task. The primary driver of this anti-competitive behavior is the fact that GS, JPM and Glencore now control virtually the entire inventory bottlenecking pathways: "In recent years, major investment banks like Goldman and J.P. Morgan and commodities houses like Glencore have been snapping up warehouses around the world, turning the industry from a disperse grouping of independent operators into another arm of Wall Street. The LME has licensed about 600 warehouses around the world. The transformation has raised questions about whether the investment banks, which also have big commodity-trading arms, are able to use their position as owners of warehouses to manipulate prices to their advantage."And since the outcome of this anti-competitive delayed tolling collusion ends up having quite an inflationary impact on end prices, the respective administrations are more than happy to turn a blind eye to this market dominant behavior which buffers the impact of deflation on input costs. We may have seen the end of the OPEC cartel. Alas, it has been replaced with a far more vicious one - this one having Goldman Sachs and JP Morgan as its two key members.
The warehousing issue alarmed one trader enough to seek government intervention. Anthony Lipmann, managing director of metals trader Lipmann Walton & Co. Ltd., gave evidence to the U.K. House of Commons Select Committee in May 2011, raising concern about large banks and trading houses owning facilities that store other people's metal.

The U.K.'s Office of Fair Trading dismissed concerns that ownership of warehouses gives certain market players an unfair advantage, saying on Tuesday that there were no "obvious competition issues that would merit further investigation at this stage."

Goldman's Detroit warehouse holds about 1.15 million tons out of a total 4.62 million tons in LME-approved warehouses.

Since Goldman bought Metro early last year, the wait time for aluminum delivery in Detroit has increased to about seven months.

Metro charges its customers 42 cents a day for storing one metric ton of aluminum in Detroit, which is about the industry average. At 900,000 tons in the warehouses, Goldman is earning $378,000 a day on rental costs, or about $79 million in seven months.

"Warehouses are making a lot more money," said Jorge Vazquez, managing director of aluminum at Harbor Commodity Research. Goldman is "really the winner clearly, because if you want to take metal away from the location, you have to wait up to 10 months to get your metal out, and in the meantime you're paying rent."
While the obvious purpose of "warehousing" is nothing short of artificially bottlenecking primary supply, these same warehouses have no problem with acquiring all the product created by primary producers in real time, and not releasing it into general circulation: once again, a tactic used by De Beers for decades to keep the price of diamonds artificially high. But unlike De Beers, Goldman also gets to charge rental fees once demand delivery instructions are sent out. The rent ends up being substantial due to the firm's unwillingness to release handily available product to the market in due course:
Metro, meantime, is taking in metal. Metro also offers cash incentives to producers like Rio Tinto Alcan to store their metal in Metro's sheds for contracted periods, sometimes as much as $150 a ton, according to traders.

Once the metal is in the warehouse, the producers sell ownership to this metal on the open market. The new owner can't collect his metal for seven months because of the bottleneck. For that period, the new owner is stuck paying rent to Metro.

"The system is set up like a funnel, so you can dump large amounts of metal in the front end and only get a little out at the back end," said David Wilson, director of metals research at SociƩtƩ GƩnƩrale SA. "It enables a situation where the rules of the warehousing system are taken advantage of."
Another beneficiary of this monopoly behavior of course are the actual metal producers, which benefit from this illegal and conflicted "middleman" intervention:
Aside from warehouses, producers of the metal are benefiting, because they are able to charge more for their metal. Klaus Kleinfeld, chief executive of Alcoa Inc., said in an interview that supply-and-demand factors are leading prices higher.
Yet it is not even Goldman or JPM's fault: after all they are merely following the guidelines set up by the LME:
"You can't blame the warehouses," Mr. Kleinfeld said.

U.S. aluminum sheet maker Novelis sent a letter to the LME in May "expressing concerns" about the warehousing situation, a company spokesman said.

The complaints led the LME to commission an independent study into the issue last July. That study recommended a sliding scale be adopted, rather than the fixed minimum of 1,500 tons a day. That would result in larger warehouse complexes being required to release more metal.

It effectively doubles the minimum amount required to be relinquished by Metro each day. The ruling would go into effect in April. The LME board on Thursday, however, failed to reach a consensus on the recommendations.
While warehousing used to be a last resort market at inception, it has now become, courtesy of the economies of scale of the middlemen, the "go-to" market, which makes any normal market clearing impossible.
Because should true market clearing be allowed, the prices for everything from aluminum to copper would plunge immediately:
The situation is made more aggravating for metal consumers because supply has far outweighed demand for most of the last decade, and there is more than 4.5 million metric tons of surplus metal stored in LME's warehouse system.
Alas as pointed out previously, with the exchanges ultimately merely conforming to the bidding of their host ponzi scheme governments, which will happily allow even further consolidation of warehousing facilities by the trio in order to artificially boost inflation ever higher, the final product is a vicious loop in which everyone benefits...Everyone but the end consumer of course, who is faced with an anti-competitive system controlled by a handful of Fed-funded players. 

And with China unlikely to open up sales of its own warehouses (especially since Chinese vendors are now well-known to use physical copper in storage to write letters of credit against for speculative purposes) to the market, the system will persevere until such time as global inflationary powers are finally destroyed and there is a scramble to dump inventories. Like what happened in the fall of 2008. At that point just as the status quo drives prices higher, so the unwind will result in a massive undershoot of prices from fair values. Which in turn will allow those insatiable importers of commoditized product such as China to feel like your typical mortgage-free living American at a K-mart blue light special. But of course we don't have to worry about that, because the central planners will never allow the system to implode like it did in 2008. After all that would defeat the whole purpose of central planning... 

In the meantime, good luck to anyone who wishes to break the cartel's monopoly in the aluminum, copper or any other commodity.

See the original article >>
China Makes The Case for Silver (Guest Post)


I am on record calling the silver market a Hunt Brothers type of market a few days before the market crashed. Well, it has happened. After soaring to a peak of $49.79 per ounce on 26 April, the silver price crashed to a low of $33.01 on 18 May.

With silver trading at a notch below $35, the question is....where to now?

In my analysis of the platinum market I compared the platinum price after the Tohoku quake in March this year to the platinum price after the Kobe quake in 1995. I did the same with the silver price, and wow, see what emerged!


Sources: I-Net Bridge: Plexus Asset Management.

The silver price reverted to the levels prior to the Tohoku disaster and has since tracked the price movements of the Kobe disaster. It is most interesting to note that the silver price took off a few days after Japan’s twin disaster. Why? I ask myself.


Sources: I-Net Bridge: Plexus Asset Management.

The only argument I can come up with is that sudden demand caught the market seriously short. This sudden demand could have emanated from the crisis in the MENA region as the affluent people in those countries took refuge in silver as a store of value that they could move across borders.

In addition to that, investors probably took fright at the jump in energy prices as a result of the MENA situation and rushed into the silver market. I think the earthquake in Japan perhaps led to fears that silver scrap recovery could also be severely hampered as the annual scrap recovery is equivalent to 29% of annual mining production.

Sources: CPM; Silver Institute; Plexus Asset Management.

It seems to me that, as in the case of industrial metals, the outlook for silver is heavily dependent on China. China’s fabrication demand for silver amounted to 21% of world fabrication demand ex coins last year. The country’s fabrication demand over the past five years has grown in line with the GDP at a rate of 11% per year.

At a growth rate of 9% per year it means that China’s fabrication demand will swell by 88 million ounces from the current 163 million to 251 million ounces by 2015. Mining production over the past five years has grown by 4% per year. If I assume that the growth rate will be maintained, it means the country’s mining production will rise by 22 million ounces from 98 million ounces in 2010 to 120 million ounces by 2015. A net shortfall of 66 million ounces! Yes, that excludes scrap recovery and investment demand.

Sources: CPM; Silver Institute; Plexus Asset Management.


Sources: CPM; CFLP; Li & Fung: Plexus Asset Management.

China used to be a net exporter of silver in the past mainly due to sales from government stockpiles. The situation was reversed in 2007, though, and the country’s imports are currently around 11% of total world supply.

From my research a very interesting fact came to the fore. The CPM Group’s seasonality index for silver has a very close relationship with the seasonality of China’s CFLP manufacturing PMI! That explains the importance of China in the world silver market.

U.S. Manufacturing: V-shaped Recovery Before A New Growth Cycle? (Guest Post)


Although job openings in the U.S. manufacturing sector slipped slightly in April to 230,000 from 235,000 in March, they have remained above 200,000 for four straight months for the first time since the summer of 2008 (see chart, data here.)

From the recessionary lows of 100,000 through mid-2009, manufacturing job openings have more than doubled to levels not seen since the summer of 2009, two years ago. We can expect ongoing improvements in America's manufacturing sector, both in terms of output and employment, as it continues to remain at the forefront of the economy recovery

In another sign of a strong economic recovery in the manufacturing sector, the after-tax profits of U.S. manufacturing corporations reached a record-high $144.5 billion in the first quarter of 2011, according to data released today by the Census Bureau.

Adjusted for inflation, first quarter profits this year were 6.6% ahead of the previous quarter, and 28.7% ahead of a year earlier. Compared to the pre-recession level of $124.1 billion in the fourth quarter of 2007, manufacturing profits have increased by 16.2% and $20.4 billion.
Another chart (below) shows annual real manufacturing output per worker from 1947-2010 using data from the BEA for manufacturing output by industry and data from the BLS on manufacturing employment.

In 1950, the average U.S. manufacturing employee produced $19,600 (in 2010 dollars) of output, and by 1976 the amount of output per worker had doubled to $38,500. During that period manufacturing productivity was growing annually at 2.63%.
Output per worker doubled again to $75,000 by 1997 (21 years later), as productivity per worker increased to 3.23%. Manufacturing output per worker approximately doubled again to $149,000 by 2010, but it only took 13 years because worker productivity accelerated to 5.42% during this period.

This is an amazing story of huge increases in U.S. worker productivity in the manufacturing sector. In fact, the growth in manufacturing worker productivity more than doubled from 2.63% per year in the period between 1950 and mid-1970s to 5.42% annually between 1997 and 2010. Whereas it took 26 years for output per worker to double during the first period (1950-1976), it only took 13 years during the more recent period (1997-2010).

Manufacturing workers in America keep getting more and more productive, which then allows us to produce more and more output over time, with fewer and fewer workers. That's a great story about an American industry that is healthy, successful and thriving, and not an industry in decline.

By continually increasing worker productivity and productive efficiency, the American manufacturing sector has been hugely successful at achieving one of the most important economic outcomes of being able to "produce more with less." In the process, those efficiency and productivity gains have helped conserve scarce resources, including human resources, more effectively than almost any other industry, except maybe farming.

It's hard to overstate how much the efficiency gains achieved by U.S. manufacturing have contributed to the improvements in our standard of living by making manufactured goods more affordable over time. We should spend less time complaining about fewer workers in manufacturing, and more time celebrating the phenomenal gains in manufacturing worker productivity.

In 2009, the U.S. produced $2.33 trillion of manufacturing output including mining and utilities, according to data from the United Nations. The U.S. ranked #1 in the world for manufacturing, and produced 14% more output than second-ranked China ($2.04 trillion) and twice as much output as third-ranked Japan ($1.15 trillion).
What's most impressive is that the U.S. produced almost as much manufacturing output as the manufacturing sectors of Germany (#4), Italy (#5), France (#6), Russia (#7), U.K. (#8), Brazil (#9) and Canada (#10) combined ($2.44 trillion).

We are constantly hammered with bad news about the decline in the number of manufacturing jobs in the U.S., but we never hear the good news about why that is happening:

I think we can now safely say that the profitability of the U.S. manufacturing sector has made a complete and total V-shaped recovery from the effects of the U.S. recession and global slowdown, and is now well-prepared and situated for a new cycle of growth and expansion in output, sales, jobs, R&D, and capital investment.

The Second Dot Com Bubble Has Now Burst


It is hard to believe that the first dot com bubble, so vivid to most semi-veteran traders, occurred over a decade ago. What is even harder to believe is that courtesy of the record liquidity bubble created by the Central Planning mafia, 2011 has already seen not only the second dot com bubble, but as the table below demonstrates, its bursting. Of all the dot com 2.0 IPO to hit the market in the past 3 months, the average return is now down 20%, but that has not prevented an underwriting syndicate comprised of the TBTFs to make billions in underwriting fees. Luckily, the fervor that previously had gripped some of the more volatile precious metals, and since spilled over into new public issues, has popped. Incremental cash will now be nearly impossible to get. To all companies that managed to take advantage of momo traders who have a memory of 15 minutes or less, congratulations. To everyone else: get in line for QE3. Wink, wink Groupon.


See the original article >>
Treasury Yield Snapshot: After the Head Fake

by dshort.com

Quick take: Yesterday's pop in yields looks like it was a head fake. Today stocks plummeted and Treasuries rallied. The ten-year yield, which jumped 11 basis points yesterday, fell 13 today to close again below 3% at 2.98.

The behavior of Treasuries is an area of special interest in light of the Fed's second round of quantitative easing, which was formally announced on November 3rd. The first chart shows the percent change for a basket of eight Treasuries since November 4th.

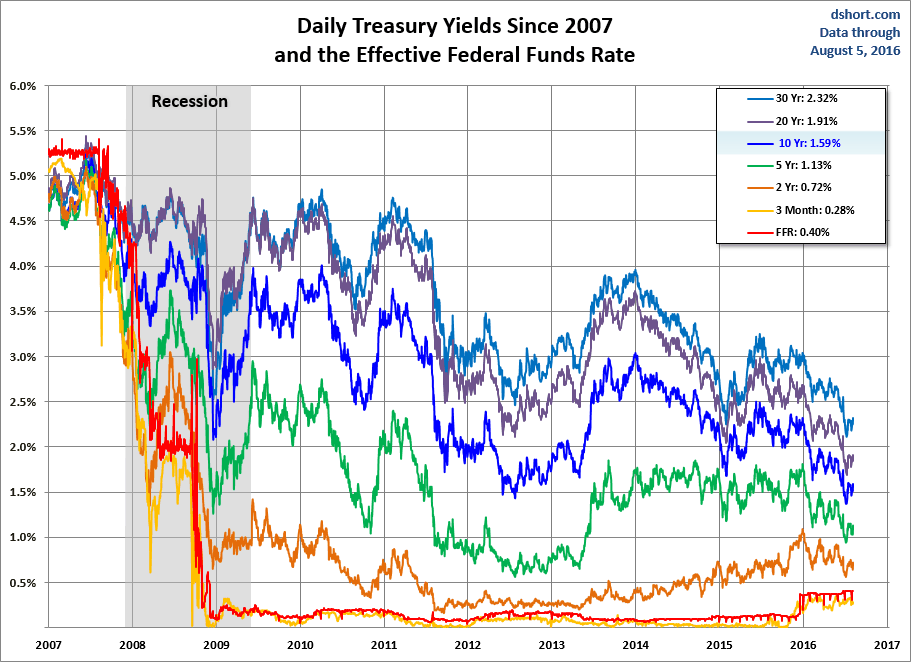
The next chart shows the daily performance of several Treasuries and the Fed Funds Rate (FFR) since 2007.

The source for the yields is the Daily Treasury Yield Curve Rates from the US Department of the Treasury and the New York Fed's website for the FFR.


Here's a closer look at the past year with the 30-year fixed mortgage added to the mix (excluding points).

Here's a comparison of the yield curve at three points in time: 1) the Fed's QE2 announcement, 2) the February interim high for the 7, 10, 20 and 30-year yields 3) and the latest curve.

The next chart shows the 2- and 10-year yields with the 2-10 spread highlighted in the background.

The final chart is an overlay of the CBOE Interest Rate 10-Year Treasury Note (TNX) and the S&P 500.


See the original article >>
Follow Us