"Who Wants To Live Forever"
There's no time for us,
There's no place for us, What is this thing that builds our dreams, yet slips away from us. Who wants to live forever, Who wants to live forever.....? There's no chance for us, It's all decided for us, This world has only one sweet moment set aside for us. Who wants to live forever, Who dares to love forever, When love must die. But touch my tears with your lips, Touch my world with your fingertips, And we can have forever, And we can love forever, Forever is our today, Who wants to live forever, Who wants to live forever, Forever is our today, Who waits forever anyway? |
Thursday, September 4, 2014
Queen - Who Wants To Live Forever

End-to-end game
by The economist
Commodity-trading houses are growing—and running more risks
| BANKS, harried by regulators and short of capital, are fleeing the commodities business. Deutsche Bank, Morgan Stanley and UBS either shuttered or shrank their commodities operations last year; this year Barclays, Credit Suisse and JPMorgan Chase have scaled back. But even as they retreat, commodity-trading houses, most of which began life as simple middlemen, are getting ever more deeply involved in the extraction, shipping and refining of raw materials. The buyer of JPMorgan Chase’s physical commodities unit, for instance, was Mercuria, a ten-year-old firm based in Switzerland that started out trading oil but now owns (or has joint ventures with) oil-exploration companies, oil-terminal and pipeline operators, coal and iron-ore mines and biofuel refineries. Vertical integration of this sort gives trading operations more flexibility and brings valuable commercial intelligence, but it also pushes the firms into capital-intensive businesses and compounds their exposure to the commodities cycle. America has some big commodity firms, including Archer Daniels Midland, Cargill and Koch Industries. But the real behemoths are based in Switzerland. Vitol, which started out in 1966 trading oil products along the Rhine, had $307 billion in sales in 2013. In addition to its trading business, it also owns or charters ships to transport crude oil, petrol, gas, coal, chemicals and sugar (200 are at sea at any time); refines 350,000 barrels of oil a day and owns a power plant in Britain. Glencore had $233 billion in sales last year. It both mines and markets coal; its oil businesses span exploration and distribution and its agricultural assets include farms, processing plants, storage and distribution. Trafigura, another commodities giant based in Switzerland, had sales of $133 billion in 2013. It too takes a cradle-to-grave approach: the firm’s oil business, for instance, includes everything from exploration to petrol stations. |  |
Such integration may improve trading margins, but only by getting the commodities firms into lots of low-margin, capital-intensive businesses like shipping and mining. It may work well when commodity prices are stable or rising, but it leaves them woefully exposed to the next recession. In spite of their size, the trading houses have only limited pricing power in markets that are highly cyclical and far more prone to unanticipated events (such as war, nationalisation, financial crises and other black swans) than, say, the market for detergent. As traders, they could ride out and often profit from such crises. But the assets they are snapping up will become far less valuable if the global economy sours. Big oil firms are pursuing the opposite strategy: selling infrastructure in an effort to improve returns. Carlyle International Energy Partners, an investment firm, estimates that they have $300 billion of assets on the block.
The commodities firms’ growing integration is also attracting the attention of regulators, particularly in America and the European Union. They fear that the traders’ ownership of infrastructure allows them to manipulate local prices, even if they do not have the heft to rig global markets (an American regulator accused the unit JPMorgan Chase sold to Mercuria of such behaviour last year, and extracted a $410m penalty). Earlier this year Mukhisa Kituyi, secretary-general of the United Nations Conference on Trade and Development, accused the industry of “corruption and illicit financial flows” and “large-scale trade mispricing” in developing countries. The Swiss government, for its part, says the industry must be more transparent, while the Swiss parliament is examining its record on human rights and the environment. It is not just the commodities cycle that can turn.
The big freeze
by The Economist
Throughout the rich world, wages are stuck

CENTRAL bankers once used to inveigh against wage inflation. Guarding against a return to the ruinous price-wage spirals of the 1970s was a constant preoccupation. Since the financial crisis, however, they have started to fret about the opposite concern: stagnant wages and the growing risk of deflation.
| There has been a squeeze on pay in the rich world for several years now. Between 2010 and 2013 real (inflation-adjusted) wages were flat across the OECD, according to its annual “Employment Outlook”, published on September 3rd. Real wages have barely grown at all in America over that period and have fallen in the euro area and Japan (see chart). Declines have been particularly sharp in the troubled peripheral economies of the euro zone, such as Portugal and Spain, but real wages have also tumbled in Britain. In most advanced countries—though not in Britain or Italy—labour productivity is picking up again. Moreover, the downward pressure on wages from high unemployment is easing in some countries, including America and Britain (in the euro area, alas, the jobless rate is still 11.5%). Yet even though unemployment in America has dropped from a peak of 10% in late 2009 to 6.2%, growth in even nominal wages (ie, not adjusted for inflation) is tame. In the private sector, they had been rising by around 3.5% a year before the crisis, but are currently increasing by less than 2% a year. In Britain, where unemployment has fallen from a peak of 8.4% to 6.4%, nominal pay is growing by 0.6% a year, far below the pre-crisis average of 4%. | 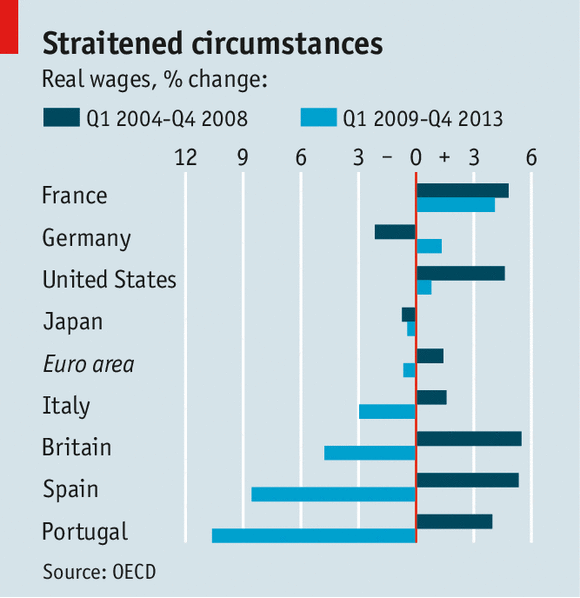 |
Divergent trends in the supply of labour help to explain why the pay squeeze has been more intense in Britain than in America. The British labour participation rate—the proportion of adults who are either in work or looking for jobs—has returned to its previous peak of almost 64% and looks set to rise further. By contrast, America’s participation rate has declined by three percentage points since the financial crisis and is now bumping along at around 63%.
Working out to what extent the low participation rate is structural, meaning that it will persist, rather than cyclical, caused by a weaker-than-usual recovery, will be crucial in determining when the Federal Reserve raises interest rates. The Fed has seen quiescent nominal wages as evidence the labour market has more slack than falling unemployment suggests. But Janet Yellen, its chairman, recently said that the weakness in wages might be deceptive. New research by the San Francisco Fed suggests that many employers froze pay during the recession because workers resist cuts in nominal pay more fiercely than the erosion of their purchasing power by inflation. Employers, unable to reduce wages when times were bad, have not been raising them now that times are better. But once this “pent-up wage deflation” has run its course, pay growth might take off.
Such a rebound may occur outside America, too, since there has been a widespread—although by no means universal—reluctance to cut nominal wages across the OECD, according to this week’s report. Between 2007 and 2010 there was a big jump in the share of workers whose wages remained flat in nominal terms. In Spain, for instance, the proportion of full-time workers having to accept pay freezes rose from 3% in 2008 to 22% in 2012.
Weak Japanese wages are worrying Haruhiko Kuroda, who as governor of the Bank of Japan is in charge of his country’s latest attempt to vanquish deflation. A new programme of quantitative easing—creating money to buy bonds—has been more successful than previous, half-hearted attempts to get prices rising again, but wages have remained sluggish. Although cash earnings jumped by 2.6% in the year to July this largely reflected bigger bonuses; regular pay rose by only 0.7%, well below the newly revived level of inflation. Mr Kuroda recently said that a “visible hand” was needed to co-ordinate higher wages.
Such a solution smacks of desperation but it might work in Japan, which retains its currency. It would not make sense for the euro area, the other big economy where deflation remains a risk. Prices rose by just 0.3% in the year to August, but in a currency club it is vital to allow wages to rise and fall freely to provide the internal equivalent of fluctuating exchange rates.
If wages in Germany rise, the downward adjustment in less competitive economies in the euro zone need not be so severe. That is why Jens Weidmann, the head of Germany’s central bank, has been calling for higher pay—a daring step in a country of inflation hawks. The European Central Bank, which cut interest rates this week, could also act more boldly to raise inflation towards its target of almost 2%. That would allow the euro zone’s invalids to regain competitiveness through wage freezes rather than outright cuts.
Wages, of course, are not just important to central bankers. Weak pay saps revenue from income tax and social-security contributions, making it harder for governments to mend public finances. The lack of growth in real wages hurts household finances, too, keeping consumers tight-fisted. A healthy and sustained recovery in the rich world will remain elusive until the pay squeeze ends.
3 Things Worth Thinking About
by Lance Roberts
["3 Things Worth Thinking About" is a weekly publication of ideas, usually contrarian to the consensus, to provoke thoughtful discussions and decision-making processes. As a portfolio manager and strategist, I am sharing things that I am considering with respect to current investment models and portfolio allocations. Please feel free to email or tweet me with your comments and ideas.]
Surge In Sentiment Surveys
There is an interesting divergence going on between sentiment based surveys, specifically the ISM Manufacturing and Non-Manufacturing surveys, and actual underlying economic data. This week saw both surveys rise sharply to cyclically high levels despite weakness in actual new orders and consumer consumption.
It is also somewhat intriguing that two groups measuring the same data are getting vastly different results. While the Institute of Supply Management survey saw sharp increases in optimism, Markit's surveys of the same manufacturing and services related data saw declines. This is one of those cases where only one can be right.
The chart below shows the composite index of the ISM surveys (simple average of manufacturing and services data).

There is a running pattern in the surveys which the initial decline mid-economic cycle reverses back up to cycle peaks. The next decline in sentiment is during the latter stage of the economic cycle prior to the onset of the ultimate recession. The recent surge in survey activity, ex-underlying strength in the actual data, suggests that sentiment is anticipating a recovery that may or may not occur.
The chart below shows just the ISM Manufacturing survey compared to core-durable goods orders. Core-durable goods are ex-defense and aircraft orders which is a better metric of what the average consumer is doing. The data, however, is very volatile, so I have smoothed with the monthly changes with a simple 12-month average.

Because I have smoothed the data with a 12-month average there is a slight lag to the data. However, what is clear is that there is a very high correlation between core-durable goods and manufacturing sentiment. Currently, sentiment is well ahead of actual activity which suggests that either the economy is about to come roaring back to life, which is what has been priced into the financial markets currently, or there will be disappointment.
There are a couple of important considerations with respect to your outlook with how this will ultimately be resolved. As I will discuss in just a moment, despite the ECB's attempt to stimulate the Euro-economy the deflationary pressures are picking up steam and the majority of economies are slowing. With 40% of domestic corporate profits coming from the global community, the Eurozone is the largest consumer, it is very likely the economic drag will be felt in the U.S. soon. Secondly, the U.S. is about to enter back into a period of the year where unseasonably cold weather will resurface once again. It is currently estimated that this winter will be as cold, or colder, than last which resulted in a 2% decline in economic activity in the first quarter of this year.
ECB Buys Bonds - Expects A Different Result
The European Central Bank announced this morning, much to the delight of stock market investors, that they are lowering interest rates from 0.15% to just 0.05%, which results in a negative real interest rate for depositors, and will begin buying asset backed bonds from its members. Via CNBC:
"Draghi announced the ECB would purchase asset-backed securities (ABS) and covered bonds to boost the economy and boost inflation."
If the goal of boosting inflation and the economy through buying bonds sounds oddly familiar, it is because it is exactly what the Federal Reserve and Bank of Japan set out to do. In both cases, it was a significant miss. The U.S. economy has muddled along with economic growth and inflation running below 2% with Japan just printing a near 7% drop in GDP despite a program three-times the size of the U.S. on a relative basis.
The issue of the inability to translate monetary policy into actual economic prosperity is something I discussed at length yesterday wherein I quoted Brad Delong:
"Instead, despite the absence of a significant increase in employment or a substantial increase in inflation, the Fed already is cutting its asset purchases and considering when, not whether, to raise interest rates."
In other words, what the Federal Reserve has figured out is that they are creating another asset bubble that must be unwound to some degree before it bursts. With interest rates at the zero-bound, an important tool of the Federal Reserve to support economic growth in the future has been exhausted. This leaves them few options for the future.
The interesting aspect to this is that despite expressed concerns by the Federal Reserve of inflated areas of the asset markets, the momentum chase has continued pushing asset prices to all-time highs. Likewise, the influx of liquidity by the ECB will likely push assets even further creating the anticipated "melt-up" in asset prices in the months ahead.
However, what is becoming abundantly clear, is that these monetary programs and interventions have little effect on the middle class which is where the most help is really needed.
What is that old saying about repeating an action and expecting a different result?
Interest Rates And Sentiment
While the ECB's actions certainly aren't likely to cure the real problems that plague the Eurozone, primarily financially insolvency, what is clear is that investors love the idea of "more" liquidity. David Tepper of Appaloosa Management tweeted out this morning following the ECB's decision to buy bonds that this is "the beginning of the end" for bonds.
"Empirically, Tepper may be right: in the past every time a central bank has launched a massive easing program (think QE1, QE2, Twist, QE3, etc.) it resulted in aggressive stock buying offset by bond selling. The issue is when said programs came to an end, and led to major selloffs in equities, pushing bonds to newer and lower record low yields. So perhaps for the time being, we may have seen the lows in the 10Year and in the periphery.
More importantly, it also explains why central banks now have to work in a constant, staggered basis when easing, as the global capital markets simply can not exist in a world in which every single central bank stops cold turkey with...liquidity injections."

I seriously doubt this is the end of the "bond bull" due to many reasons I will discuss next week. However, with respect to the ECB's decision the size and scope of the purchases fall well short of the broad, large-scale asset purchases advocated by many economists (similar to the measures used by the Federal Reserve). While the announcement was "bullish" for investors wanting liquidity, it will likely have little effect on the broad deflationary pressures that are keeping rates under pressure.
However, as I stated, bullish sentiment was bolstered by the news. The chart below shows the composite index of both individual and professional investor "bullish vs. bearish" sentiment. Currently, the index is at levels reached only once before in the history of the data. At 3.02, the index signals extreme bullish sentiment in the short term and is at levels that exceed all previous minor and major market peaks.

While there is currently no "technical" reason to become overly cautious on the markets (bullish trends are still firmly in place), there are many reasons to be "aware" of the rising risks.
Market reversions, when the occur, are extremely rapid and tend to leave a rather brutal "scar" on investment portfolios. There is clear evidence that economic growth is being impacted by deflationary pressures on a global scale. This suggests that the sustainability of current and projected growth rates of profits is questionable given the magnitude to which leverage has been used to boost margins through share repurchases. Manufacturing profits through artificial means, ie. cost cutting and share repurchases, are finite in nature, and most of the benefit of such activities have already been fully harvested. If the current rise in sentiment surveys is not met with actual activity in the near future this could pose a problem for over zealous investors.
Bce verso il quantitative easing?
Il taglio dei tassi non è la misura più significativa presa dalla Banca centrale europea. Più importante è l’acquisto di asset backed securities e di covered bonds, che aumenterà la dimensione del bilancio Bce. Speriamo che questo sia un passo decisivo verso il quantitative easing.
TAGLIO DEI TASSI E SVALUTAZIONE DELL’EURO
La riunione del 4 settembre 2014 della Bce ha sorpreso i mercati per l’ulteriore limatura ai tassi d’interesse, già su livelli prossimi allo zero. In realtà, quelli sui depositi delle banche presso la Bce stessa erano addirittura negativi, e da oggi lo saranno ancora di più: le banche dovranno pagare 20 punti base per tenere riserve presso la Banca centrale (in eccesso rispetto alla riserva obbligatoria). Sulla scarsa efficacia di tassi negativi ci siamo già espressi: difficilmente questa misura può convincere la banche a riattivare l’offerta di prestiti alle imprese. Va però riconosciuto che, portando il tasso d’interesse sul mercato interbancario a livelli molto bassi o addirittura negativi, potrebbe indurre le banche a spostare liquidità su altre valute, indebolendo così il cambio dell’euro: questo sì sarebbe un effetto espansivo, di cui abbiamo bisogno.
ACQUISTO DI ABS E DI COVERED BONDS: VERSO IL QE?
Tuttavia, la misura più significativa è il passaggio alla fase operativa dell’acquisto di Abs (asset backed securities). Si tratta di obbligazioni derivanti da operazioni di cartolarizzazione di prestiti alle imprese. Per evitare gli errori del passato, si dovrebbe trattare di titoli semplici e trasparenti, evitando le operazioni complesse che diedero luogo ai toxic assets di triste memoria. Rivitalizzare questo mercato consentirebbe di convogliare verso le imprese un po’ del risparmio delle famiglie raccolto dalle assicurazioni e dai fondi pensione, che potrebbero diversificare il loro portafoglio investendone un quota (anche piccola) in Abs, anziché concentrarla solo sui titoli di Stato. Inoltre, queste operazioni consentirebbero alle banche di risparmiare patrimonio, dando quindi una mano a sostenere l’offerta di prestiti. In aggiunta a questa misura, che era prevista, la Bce ha annunciato a sorpresa l’acquisto di covered bonds: titoli emessi dalle banche a fronte di specifici asset(quali i mutui).
Al di là dei dettagli tecnici (che verranno precisati in ottobre), quello che interessa di più è che Mario Draghi sta gradualmente, ma fermamente, spingendo la Bce verso il quantitative easing. Gli acquisti di Abs vengono denominati dagli addetti ai lavori “credit easing”: interventi su uno specifico mercato per ridare liquidità agli strumenti lì scambiati. Furono attuati anche dalla Fed a partire dal 2008. È interessante notare come Draghi abbia sottolineato che queste operazioni porteranno a un incremento della dimensione del bilancio della Bce. Con un pizzico di ottimismo, possiamo ritenere che rappresentino l’anticamera verso il vero e proprio quantitative easing: l’intervento sul mercato dei titoli di Stato.
Naturalmente, nel completare questo percorso, Draghi troverà resistenze da parte della componente tedesca del Consiglio Bce. Tuttavia, è stato molto chiaro nel discorso di Jackson Hole: il fondamentale svantaggio dei governi europei rispetto a quelli di altri paesi (Usa, Gran Bretagna, Giappone) è che essi non dispongono di un finanziamento di riserva (“backstop for government funding”) da parte della banca centrale. In altre parole, bisogna che la Bce assuma esplicitamente il ruolo di prestatore di ultima istanza dei governi, per metterli al riparo dalla speculazione dei mercati. Il programma Omt è stato molto efficace nella fase di annuncio, portando a una drastica riduzione degli spread sovrani nella zona euro, ma potrebbe rivelarsi insufficiente se messo alla prova, a causa della condizionalità a cui è sottoposto. Convincere i tedeschi ad andare oltre quel programma sarà difficile, ma è vitale per la zona euro. Solo così la politica fiscale potrà contribuire a sostenere la domanda aggregata, condizione essenziale per uscire dalla fase recessiva che stiamo vivendo.
Renzi’s Choice, Europe’s Loss
ROME – The appointment of Federica Mogherini, Italy’s foreign minister, as the European Union’s High Representative for Foreign Affairs and Security Policy has exposed two fictions. One is that EU member states care about a common foreign policy; the other is that Italy has a strong and credible government.
To be sure, the selection of the 41-year-old Mogherini scores well for gender, age, and political affiliation. But it also sends a strong message that foreign policy remains a low priority for the EU’s new leadership. Despite the difficult geopolitical situation now confronting Europe, the post of High Representative still carries little influence. Indeed, until early this year, Mogherini had little exposure to foreign policymaking.
Henry Kissinger famously (if apocryphally) asked, “Who do I call if I want to speak to Europe?” Today, he would know to call Mogherini, but then he would ask, “Mogherini who?” Four decades later, Europe has still not found an effective and plausible way to speak with one voice on foreign policy.
No one doubts that Mogherini will try her best to learn the nitty-gritty of her new job, but it will be like learning to fly by piloting a jumbo jet. Most of the time, an inexperienced pilot can avoid serious problems by relying on her more experienced crew and various technologies. But in the event of severe turbulence, only a pilot with sufficient skill and practice will be able to maintain control of the aircraft and keep the passengers calm.
So it is disturbing, to say the least, that with Ukraine at war with Russia, and the Middle East in a spiraling crisis of fanaticism, Europe’s leaders did not seek a candidate with a proven ability to forge an effective foreign policy from different – and often opposite – positions. EU foreign policy is now being piloted by an apprentice.
Mogherini’s appointment bodes ill for progress toward a more assertive, or at least unified and coherent, European foreign-policy stance. But it is also a bad outcome for gender equality and for Italy. Women should be picked because their skills, qualifications, and experience are relevant to the job. Appointing women should not be an exercise in ticking boxes. A lack of qualified women in Europe is no excuse for not making a meaningful appointment.
The perversity of Mogherini’s appointment is that Italy does have highly qualified women candidates. Emma Bonino, a former foreign minister, trade minister, and EU Commissioner, is outstandingly qualified. So is Marta Dassù, a former deputy foreign minister and foreign-policy intellectual. Both women would have been more convincing appointments, particularly to those, like Vladimir Putin, who do not wish the EU well.
By insisting on Mogherini, Italian Prime Minister Matteo Renzi has squandered much of the political capital that he gained from the outcome of the European Parliament election in May, when his government performed better than any other in the EU. By refusing to budge, despite strong opposition to Mogherini from the EU’s Eastern European members, he has painted himself (and Italy) into a corner, revealing the limits of his leadership.
Renzi himself is not well versed in foreign affairs. Indeed, he had no experience in government or parliament whatsoever until he became, at 39, the youngest person to become Prime Minister of Italy. His only significant public service was a stint as Mayor of Florence, a city of less than a half-million people.
Many Italians applauded Renzi’s meteoric rise. But many more have remained indifferent to his promise to shake up the status quo. His charisma has not lifted confidence; on the contrary, the latest consumer and business surveys indicate weakening sentiment. His brusque and sometimes arrogant manner and his preference for loyalty over skill have led many to question his ability to lead, much less transform the country.
With Italy on the brink of a Japanese-style recession – GDP is expected to contract by 0.2% this year, and inflation entered negative territory in August – one would have expected Renzi to focus on the economy, and on Italy’s role in Europe’s single market and monetary union. And yet, bizarrely, he shifted the European debate from German-led budgetary austerity to Mogherini.
Is the Italian government really so eager to take the lead on EU foreign policy? If so, where is the plan?
Renzi needs to shift gears and make friends, at home and abroad. Reforming Italy, and changing the narrative in Europe, is a huge task that requires the careful formulation of an agenda containing detailed, feasible objectives, as well as the patience to engage other EU governments in a constructive policy dialogue, not horse-trading.
Above all, Renzi needs to reflect on the fact that Italy remains the eurozone’s weakest link, because it is the only member that can bring down the currency union. Italy’s economic health is thus a “public good” for all of Europe. Dismissing this responsibility and declaring to Europe that no one can teach lessons to Italy, as he did during the fight to appoint Mogherini, is both shortsighted and potentially dangerous.
Is it time for Germany to step up?
By Clive Crook
The gap between the European Union's pretensions and capacities has never looked so wide. Its stagnant economy and the crisis in Ukraine point to gross failures of leadership. In both cases, Europe's de facto leader -- Germany -- is especially to blame.
Is that unfair? You could argue that these blows to Europe's prosperity and security have come from outside -- that the global recession started in the U.S. and the conflict in Ukraine is all Vladimir Putin's fault. You'd be letting Europe's leaders off too lightly.
The EU's current economic policy is indefensible: The EU has chosen to extend the recession by rejecting available remedies. As far as its foreign and security policy goes, this can barely be said to exist. Europe didn't make Putin the ruthless outlaw he is, but it provoked him while knowing it was unwilling or unable to deal with the consequences.
Germany's input to these mistakes has been disproportionate. It isn't just that the size and strength of Germany's economy have made Berlin the de facto capital of Europe. It's also that the errors are characteristically German -- postwar German, that is. Germany's morbid dread of inflation and what can follow has paralyzed Europe's economic policy; and its overweening desire for commerce with Russia and reluctance to confront threats with force has defanged the EU's security policy.
Don't misunderstand me. Germany's desire to heed the lessons of its modern history is noble. Better this, no doubt, than financial recklessness combined with resurgent militarism. But 70 years after the war it's ashamed of, Germany is still -- how to put this? -- overcompensating.
Fiscal austerity and monetary stringency are imposing huge economic costs and threatening Europe with outright deflation. Germany's pathologically orthodox policymakers have set their faces against fiscal relaxation and resisted the European Central Bank's timid moves to loosen monetary conditions. Quantitative easing of the sort used by the U.S. Federal Reserve is needed to support demand. Europe's suffocating fiscal rules, set down in the Stability and Growth Pact, could be adjusted too, given the will. These initiatives wouldn't be entirely without risk, but fears of a 1920s-style hyperinflation are absurd in current circumstances. They need to be expunged from the discussion.
The desire for peace and commerce isn't absurd and doesn't need expunging -- but Europe must be capable of showing Russia sufficient resolve to make Putin think twice. Led by Germany, the EU has dragged its feet over sanctions against Russia since the crisis in Ukraine began. Aside from reducing the immediate costs to Russia of its actions in Ukraine, this timidity calls into question Europe's willingness to defend itself and its NATO partners. Russia is seizing foreign territory by force -- and Europe flinches at the idea of tough economic sanctions. What does that say about the credibility of promises to fight for Poland and the Baltic states if the need arises?
Earlier I mentioned that Europe provoked Putin over Ukraine. How so? Under Germany's leadership, Europe has greatly enlarged its union to the east. It brought in Poland and the Baltic states at a time when Russia was cowed and preoccupied with its own internal problems. Binding those countries to the West was a bold move and, since the timing was right, also wise. But when the EU in effect asked Ukraine to choose between Europe and Russia -- as it did in 2011 -- it acted imprudently.
By this time Russia under Putin was looking to reassert its place in the world. A Ukraine with aspirations to join both the EU and NATO threatened to bring the Western military alliance to the Russian border and defeat Putin's ambition to rebuild Russia's sphere of influence. Moreover, Ukraine has a large Russian-speaking minority and a special historical significance to Russia. It's hard to say which would be more stupid -- to deliberately provoke Putin with a scheme to marry Ukraine to the West, or to offer the betrothal without planning for the possibility that Putin might object.
In any event, when he did object, what were Europe's options? Despite repeated warnings and pledges dating back to the building of the first pipeline in the 1980s, it has allowed itself to become dependent on Russian gas. It prizes the export opportunities of trade with Russia. And it has spent recent years diminishing its commitment to its own defense. Again, in all three respects, Germany has taken the lead. NATO members have informally promised to spend 2 percent of gross domestic product on defense. Last year, the U.S. spent more than twice that -- about the same share of GDP that Russia spends. Europe's NATO members spent, on average, 1.6 percent. Germany spent 1.3 percent.
Considering the 20th century alternative, it's good that a commerce-seeking, peace-loving Germany leads Europe. But the Age of Aquarius hasn't quite dawned. Apparently, there are some bad people out there and one or two countries still haven't adopted Germany's modern Weltanschauung. If Germany expects to lead, it had better understand this, and accept the obligations that go with the job.
Claims/ADP numbers show steady growth
Labor market mixed according to ADP
The broad tone is bullish following the surprise move out of the ECB, with global equity markets continuing to rise. European bonds are in rally mode, while the yield on U.S. notes is static at 2.41%. Amid the noise of the ECB’s official announcement of lower rates and the delivery of an ABS purchase program over in Frankfurt, U.S. investors watched a couple of key labor market data points.
Initial jobless claims rose by 4,000 to 302,000 sticking close now to its pre-recession levels. Of course the upside from these lower readings is a series of strong nonfarm payroll readings. Only the January data point has thus far been below 200,000 – a level that shows the clear improvement in corporate confidence in the economy. That makes the latest ADP report released on Thursday all the more interesting. The 204,000 additional private sector jobs added in August was 16,000 lower than predicted by economists, while 6,000 fewer jobs were recorded in July after data was revised.
Chart – Manufacturing employment jumped, professional jobs weakened

Earlier in the week the ISM put out a strong report indicating a surge in new orders and production. The labor index eased a tad, yet remained firmly camped in expansion territory. Remember that this sector accounts for just one-eighth of the economy. However, we always look at this sector as being the engine of the economy. It creates a ripple effect across the landscape, and when manufacturing is humming, so too does the economy. The ADP report showed manufacturers added 22,900 jobs in August and the most since December 2012. That largely explains what the ISM report showed and is a positive sign.
However, the relative weakness in the report – we can’t overlook the fact that the report showed another reading above 200,000 – is to be found in trade and transport (+28.2k) and professional sectors (+50.7k). Each created the fewest amount of jobs since January. Investors will not have to wait too long to find out the official nonfarm payroll reading due in less than 24-hours. Despite the tighter labor market, wages are not careening out of control and appear to pose little if any threat to the Fed’s steady policy stance.
The BIS Bashers
by Mojmír Hampl
PRAGUE – It might seem an unlikely proposition, but central banking has become exciting. This is not necessarily a welcome development. Decisions taken by the leading monetary authorities since the 2008-2009 global financial crisis have been unorthodox, creative, and at times risky. Their high-stakes choices today will affect the global economy for decades to come.
Moreover, central bankers have become more vocal in expressing strongly held positions in the mass media, as if seeking to win over popular opinion. It is a potent and dangerous mix. In this environment, sober, informed voices, like that of the Bank for International Settlements, the central bank of central banks, should also be given a fair hearing. Unfortunately, many central bankers have sought to marginalize the BIS rather than engage with it.
One of the most contentious debates has been over when to end the “unconventional” monetary-policy measures that were introduced in the aftermath of the financial crisis to ensure that banks continued to lend, thereby stimulating growth and averting deflation. Some central bankers now worry that ending these measures prematurely will tip the economy back into recession. Yet others fear that the current strategy, though originally intended to prevent an economic collapse, is now sowing the seeds of future instability, including the emergence of another asset-price bubble.
In their efforts to resolve such dilemmas, policymakers are also wrestling over whether to focus on traditional monetary tools such as interest rates, or make greater use of so-called “macro-prudential measures,” such as capital add-ons and buffers or adjustments to banks’ loan-to-value ratios.
At the heart of the debate – currently being conducted within leading economies’ treasuries and central banks, as well as in supranational bodies such as the International Monetary Fund and the BIS – is the relationship between monetary policy and financial stability. The BIS, for example, has suggested that financial stability is closely connected with monetary policy, and has advised policymakers to start weaning their economies off of easy money sooner rather than later. Central bankers, however, seem to want to try macro-prudential tools first (and sometimes exclusively).
It is unusual to witness a clash of views among monetary policymakers that is so radical and clear-cut that it has grabbed wider political and media attention. And, under the public spotlight, some central bankers have sought to downplay the BIS’s assessment, arguing that it is all too easy to issue far-reaching policy recommendations when one suffers none of the consequences should one’s prescription turn out to be wrong.
To be sure, a country’s domestic economic circumstances, and the tools available to policymakers, should guide policy. And, though monetary tightening may well be advisable in some economies, it might be inappropriate in others.
But the harsh reactions to the BIS’s analysis seem misplaced and unfair. It is always difficult to find the right monetary-policy stance for any given economy at a given moment. Central banks employ an army of experts to try to get it right, and other institutions are seldom so well resourced to present equally sophisticated counter-arguments. The BIS, however, is one of the few organizations that not only has the necessary research and analytical capabilities, but also a track record of making good calls. One should not forget – as many central bankers appear to have done – that the BIS was one of the first to warn of the dangers of financial excesses, several years before the 2008 crisis.
The BIS has a right to be heard. It exists not just to represent central banks, but also to offer ideas and intellectual feedback. Indeed, it serves policymakers well by challenging, debating, and perhaps swaying opinion. Rather than bash the BIS, monetary authorities should be grateful for the informed perspectives that it provides.
Semiconductors often lead the broad market…Current message is?
by Chris Kimble

CLICK ON CHART TO ENLARGE
Semiconductors bottomed and turned up before the broad markets in 2002 and 2008. They did the opposite in 2000 and 2007, as they started reflecting weakness before the broad market turned down.
Are Semiconductors the holy grain of investing? Don't think so! They have been a decent leading indicator at fairly important Tops & Bottoms over the past 14-years though.
The Sox index has done well over the past five years. Even though it has rallied strongly, it is just now reaching its 38% Fibonacci retracement level, based upon the 2000 highs and the 2009 lows.
So far the Semiconductor index is NOT diverging against the S&P 500 like it did in 2000 and 2007. I do believe it is worth keeping a close eye on this leading sector to see how it handles this key Fib level and resistance channel at (3) going forward.
Positioning For A Stronger Dollar
by Bret Jensen
Summary
- Interest rates have started to tick up recently and the dollar has strengthened noticeably against both the euro and the yen as well.
- These trends could remain in place or accelerate for myriad reasons in coming months and will have several impacts to the markets.
- A few actions investors should take with their portfolios to counteract these movements are outlined below.
As we head into the final third of the trading year, it is appropriate to look at the global economy and what it means for our market going forward. The world is a very bifurcated place right now. Europe is on the verge of stalling yet again as Italy is in outright deflation, 10 year yields for Spanish debt are under 3% and German monthly retail sales just came at their weakest level in over 2.5 years.
The recovery in Japan under "Abenomics" is still uncertain. The Japanese Central Bank engaged in their own version of quantitative easing on steroids which help boost the Nikkei more than 55% in 2013. Government spending has also been boosted. Unfortunately, now comes the hard part; labor and market reforms needed to boost competitiveness and consumer spending. It is still uncertain whether the government has the will to do what is necessary in this area and the Japanese economy shrunk in the last completed quarter due to a sales tax rise to 8% from 5% currently which is needed to address the country's huge deficit.
The economic picture is much brighter here in the United States. Domestic auto sales look poised to cross over the 17mm annual mark, something that has not happened since July 2006. Manufacturing and construction readings also came in stronger than expected on Tuesday. Finally, we are seeing real job growth after being mired for five years in the weakest post-war recovery on record.
The difference in the economies of the major developed markets is starting to show up in currency markets and also in the recent rise of our 10 year treasury yield. The dollar has gained nicely against both the Euro and Yen and the ten year has moved from ~2.3% to ~2.45% in quick order. The Euro has moved from over $1.36 to $1.31 recently and the Yen is at a seven month low against the dollar.
With the Federal Reserve about to end its quantitative easing stance after more than five years in October, domestic economic growth projected to be around 3% in the back half of 2014, and with the European Central Bank quite likely to engage in its own QE program by the end of the year; these recent trends should continue if not accelerate.
So what should investors do to position their portfolios for what looks like the trend to a higher dollar? Here are a couple of steps I think investors should take to bolster/protect their portfolios.
- Underweight American multi-nationals that get a good portion of their sales from Europe as their earnings will be impacted due to the lower Euro. McDonald's (NYSE:MCD) is a good example of a domestic company that gets a good portion (~30%) of its revenue from the eurozone that I would be avoiding here; both due to a falling Euro and other internal problems the company seems to be having lately.
- Reduce exposure to high yield sectors like Utilities and Real Estate Investment Trusts (REITs). These areas traditionally get impacted negatively anytime interest rates run up like they did in the back half of 2013 which caused these sectors to deeply underperform the overall market in the last six months of last year. As I detailed yesterday, I have cut my exposure to REITs substantially over the past couple of months with some exceptions.
- The stronger dollar will undermine the case for owning commodities and commodity based sectors. In trading yesterday, investors were provided a glimpse of this when oil fell almost $3 a barrel in trading Tuesday. Natural gas, gold and silver were also very weak. It is time to lighten one's exposure to the mining sector. I am also moving from overweight to equal weight on the energy sector which is still benefiting from huge domestic production growth and should be able to withstand some decline in energy prices; provided it is not too severe. However, lower energy prices will still be a headwind to the sector.
- Finally, it might be time to boost exposure to Europe in front of a likely move by the ECB to flood their market with additional liquidity. Both U.S. and Japanese equities soared when their central banks engaged in "easing," European bourses should see some of the same positive impacts. An investor can increase exposure by buying a currency hedged mutual fund or ETF based on Europe or by buying individual names. I like Netherlands based AEGON N.V. (NYSE:AEG) as I recently highlighted as a play that will benefit from quantitative easing by the ECB and by a falling Euro.
This an initial list of what I see as the likely impacts to a rising dollar and slightly higher interest rates on our markets. These are topics we will revisit often for the rest of 2014 as these trends bear watching for investors.
Is Another September Swoon Looming?
Summary
- September Swoon is a historically verifiable phenomena.
- Since the Great Depression stock markets have traditionally underperformed.
- Could be due to economic cycles, or could be due to "mental" factors.
- Not a bad idea to sell off before a drop, but if you don't it'd be best to hold on to assets.
It's that time of the year and some investors are wondering if the infamous September Swoon will once again reappear. For those who are unfamiliar with the swoon, it's a purported dip in markets that occurs in September more often than not. Obviously, if markets will indeed take a dip this month, investors would be smart to protect themselves by selling off ahead of the dip.
As odd as it sounds, evidence does suggest that stocks do tend to dip in September. So if the swoon is indeed true, the next big question to ask is why?
Does it have something to do with the global cycle of the economy, or could it have become a sort of mental road bump in the road? We think it's true, and so it becomes true.
As an investor, September is an important month to approach. If there is a September dip, it'd make sense for you to liquidate your portfolio and buy up stocks after they trend downwards. Not only would you protect yourself from losses, but you could also buy stocks on the cheap.
After all, the whole point of investing is to buy low and sell high.
September Swoon: Myth or Fact?
Data suggests that the September Swoon is indeed a fact of the market. Consider this, since 1926, large companies have reported an average gain of 1 percent in every month, except one. Can you guess what month that is?
September, of course. In fact, large companies have suffered a .8 percent decline during September since 1926. So during every other month of the year, stocks tend to trend upwards, but then they suddenly take a stumble come September.
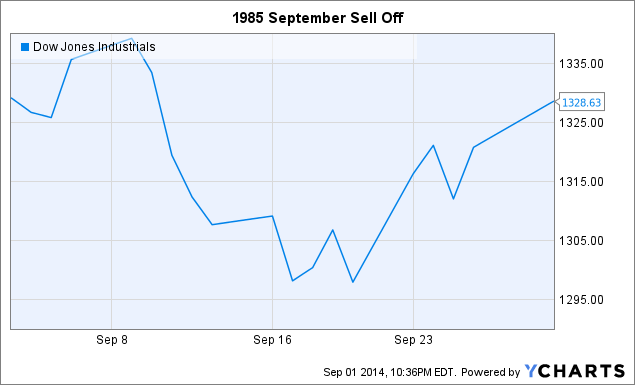
The S&P 500 has also averaged a negative .5 percent through September. And a quick examination of Septembers throughout the years does reveal dips. Let's look at one:
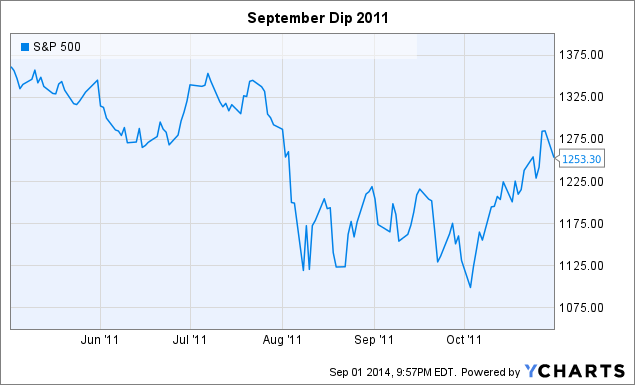
^SPX data by YCharts
Meanwhile, for each month of the year besides September, stocks have risen about 62 percent of the time. For September, gains and losses are split 50-50.
It's interesting to note that for the last several years, trading volumes have also spiked during September. Given the price swings, this shouldn't be all too surprising. As prices drop, people should begin to sell off, especially as fears of a dip start to build.
Interestingly, during the last few Septembers, which have generally seen stocks trend upwards, volumes still rose.
Even when September seems to be doing reasonably well, or at least holding grounds or stemming losses, it may only be delaying the inevitable, and causing markets to dip in October instead.
For example, the two largest collapses for the DJIA in terms of percentage points both came in October. It forces one to wonder if in September investors simply kicked the can down the road, so to speak.
Either way, it does appear that stock markets tend to trend downwards more often than not come September.
Possible Causes Of September Swoon
So what makes September such a tough month for investors? One possibility could be that people are heading back to school and families are preparing for the long winter months ahead, and these factors could cause people to shift their finances away from stocks.
While summer might be a time to invest, autumn and winter might be a time to spend. Perhaps people liquidate their investments to pay for a child's college tuition, or make needed purchases before the winter comes.
September has also been a month of major events. The collapse of the Lehman Brothers, which kicked the 2008 Financial Crisis into full gear, came on September 15th, 2008. Then there was the 9/11 attacks back in 2001.
The Great Depression also started with a 10 percent decline in the DJIA in September of 1929. Then stocks plummeted by 30 percent in September of 1931. Many more major events have occurred in September.
(click to enlarge)
Source: "The September Swoon," Mark Haugh & Mark Hirschey
Maybe earnings reports during the summer cause markets to overheat and come September investors sober up. On some years, perhaps the opposite happens, bad reports come in, investors get nervous and start selling off. The losses compile and make investors more and more nervous, leading to a self-feeding cycle of sell-offs.
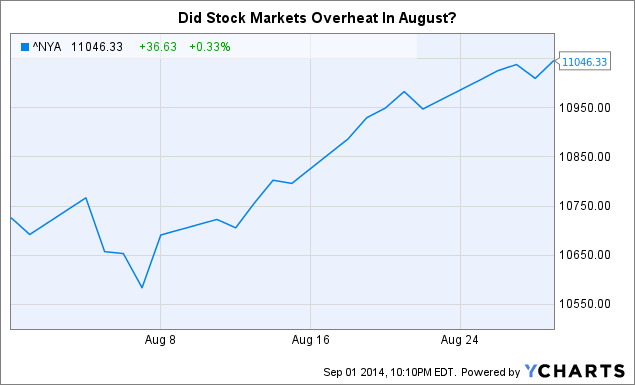
^NYA data by YCharts
Sounds highly speculative, doesn't it? That's because it is. While the phenomena has been studied in academic journals and the focus of attention from investors for years, nobody is really sure why it occurs.
Could The Dip Be "Mental"?
Of course, by now the September dip may have become a self-fulfilling prophecy. To illustrate, some investors might get jittery at the beginning of the month, knowing what September historically brings. They start to sell off their stocks and prices begin to dip.
Normally, other investors might see dipping prices as a sign to buy, after all that's how markets are supposed to work. Knowing that it's September, however, they instead see it as a sign that the dip is indeed coming.
Those investors who were slightly more confident than the first wave of sellers suddenly get cold feet too, and begin to sell off their stocks. Prices dip further, more people get nervous, and so onwards the cycle goes.
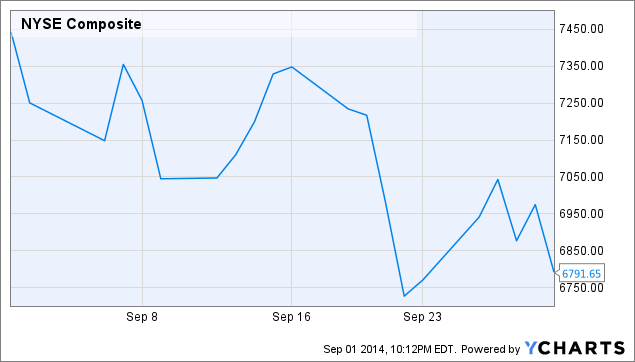
^NYA data by YCharts
Indeed, it could even be articles like this very one that contribute to and make the September dip happen. Smaller investors read these articles, get nervous, and start to sell. This makes the professionals and institutional investors get nervous and they start to sell too.
It should be noted, however, that the swoon has existed for decades, predating the age of the Internet and the influx of smaller investors into an industry that had once been dominated by experts. Professional and institutional investors should be less likely to be influenced by superstitions.
^DJI data by YCharts
Regardless, just because swoons have happened in the past, that doesn't mean one is going to happen this year. Let's look at some current conditions to see if we can learn more about what this September could bring.
Some Investors Are Indeed Getting Cold Feet
It's easy to see why investors, who normally try to be cool, calculating, and objective, suddenly dread that turn of the page on the calendar when August gives way to September.
And indeed, it seems that jittery investors may already be contributing to a self-fulfilling prophecy this year as some professional investors are already selling off.
The Wall Street Journal reported that James Paulsen, the chief investment strategist at Wells Capital Management, already expects a 15 percent drop in stocks this fall. In order to protect his portfolios and the portfolios of his clients, Mr. Paulsen is advising clients to invest overseas.
Given the tensions in Europe, the on-going effects on the wind down of quantitative easing, and the lingering doubts in China, it's hard to justify overseas markets over U.S. markets. Indeed, if anything markets overseas will likely have a tougher month than U.S. markets, should a swoon appear.
WSJ also reports that Russ Koesterich, the chief investment strategist at BlackRock who oversees $4.32 trillion in assets, is reducing his positions ahead of September. Mr. Koesterich expects the S&P 500 to drop by 8 to 10 percent this fall as markets correct themselves
Given the massive amount of assets managed by Mr. Koesterich, if he starts selling off stocks too quickly, his actions alone could weigh down on markets, again leading to a self-fulfilling prophecy.
Will There Be A September Swoon?
It's tempting to say no. After all, economic indicators are pointing up across the world. In the U.S. inflation remains low, and employment is rising. Meanwhile, economic growth has been accelerating, quarterly earnings have been great, and consumer confidence is rising.
Across the world Asian markets are shaking off a few turbulent weeks, and the European Central Bank (ECB) is meeting to discuss more stimulus measures. If this package comes through, European markets should rise, and that should send American markets higher.
No way the September Swoon could make another appearance, right?
Yet at the same time August was indeed a great month for quarterly earnings reports but perhaps markets have gotten a bit overheated. Might be time for a natural cool off.
Add in tensions in Ukraine and the Middle East, and worrisome economic data from the E.U. and China, and combined it all suggests that yet another swoon could make its appearance this year.
Any investors getting cold feet couldn't be blamed for selling off their stocks. Stocks may rise over the next few days owing to the ECB meeting and other factors, but given how fragile markets are it won't take much to derail gains.
If stocks do go through a swoon the bear markets could create some great opportunities to pick up stocks on the cheap. If early September ends up being the right time to sell, then mid-to-late September could be the right time to buy.
If a September swoon does hit and stocks start to dip, and you haven't liquidated your portfolio, it'll likely be best to hold onto your stocks. The dip has proven to generally be temporary.
Of course, as news hits the headlines you will have to reevaluate your position. For example, if a rash of layoffs is announced or a credit bubble in China pops, you'll have to adjust your strategy as that news comes to light.
Either way, if you decide to ride out September make sure you don't get cold feet and stick to your strategy. Don't sell off as soon as markets dip five percent, instead wait and let markets regain.
Another swoon may reappear, but that doesn't mean your portfolio has to suffer over the long run.
The Fallacy Of Central Bank Stimulus
by Kevin Flynn
Summary
- Growth rates during the era of quantitative easing.
- The fixation of investor sentiment with central bank stimulus.
- Equity markets correct on the ends of business cycles, not on a few rate hikes.
"There are no new eras - excesses are never permanent." - Bob Farrell
Many readers will recognize the above observation as rule #3 from Bob Farrell's Ten Rules of Investing. Farrell is a bona fide Wall Street Legend who actually studied under Graham and Dodd at Columbia, yet was famed for decades as Merrill Lynch's technical analyst.
I bring up the rule because of my conclusion that the market is in the grip of another New Era, in this case the Era of Invincible Stimulus.
Each era of excess eventually coalesces around a guiding principle that is thought to reduce investing to a simple process of buying the dips. The late Sixties and early Seventies had the Nifty Fifty; in more recent times, the late 1990s had the original New Thing, the Era of the Invincible Internet. It was followed in short order by the Era of the Invincible Housing Machine.
Here are some recent headlines from the Era of Invincible Stimulus:
Japan GDP Slump Stirs Stimulus Talk (Wall Street Journal (WSJ), 8/13/14)
European Data Stoke Stimulus Hopes (WSJ: 9/2/2014)
Hong Kong Shares Rally on Stimulus Hopes (WSJ: 8/13/2014)
Copper Rises on Hopes for China Stimulus (WSJ: 8/22/2014)
The United States stock market is, for once, not the current poster child for this belief. That honor goes to the China and Hong Kong markets, where weak data these days means more stimulus, and good data means the stimulus is working. Ergo, all news is good news (a state we are familiar enough with over here).
I haven't the space to deconstruct each stimulus program around the globe. What I can do is cite some U.S. data that should be revealing: from the end of 2002 through the end of 2007, the compound annual growth rate of nominal GDP in the US was 5.75%. From the middle of 2009 through the middle of 2014, the era of QE (a.k.a. The Era of Invincible Stimulus), that nominal rate was 3.84%. The annualized rates since the beginning of QE-2 and QE-3 are 3.89% and 3.63%, respectively. That period includes the Big Bad Winter Quarter of 2014, so I'll throw the data a bone and accept that by the end of the current quarter, the rate might move up past 3.7% and back to 3.8%.
It's very difficult to conclude that QE has made any difference at all in the growth rate in the last two years, at least not without resorting to counterfactual speculation. About half of the difference in the growth rates between the two five-year periods of 2002-2007 and 2009-2014 can be attributed to inflation, which (using the Fed's preferred PCE indicator) ran about 100 basis points a year higher in the earlier period. The reason I'm using nominal GDP data because QE is a monetary phenomenon: One would expect QE effects to show up more strongly in nominal, monetary-only GDP data rather than inflation-adjusted ("real") numbers.
Aye, but here's the rub, as summed up in a MarketWatch column from London on why one should invest in Europe (the short answer being stimulus): "We will probably never have any clear-cut evidence whether QE helped the U.K. or U.S. economies, but both have recovered far faster than Europe has done...Sooner or later, the ECB will act. The one thing we know for sure about QE is that it boosts asset prices, and the stock market in particular. Even if the economy still flat-lines, equities should do well." (emphasis added).
Indeed, over that 2003-2007 five-year period, the S&P 500 advanced a total of 66.9%, for a compound growth rate of 11%. Over the five years from mid-2009 to mid-2014, the S&P advanced nearly double the previous amount, 113.2%, for a growth rate of 16.4%, nearly 50% higher. In short, the monetary inflation we expected from QE made its way into the financial economy instead of the real one.
I will return to that point, but this is a good place to stop and consider that the stated intentions of the central banks is to stimulate the real economy with quantitative easing, rather than the financial one. I don't want to pretend that the central bankers are naive or seem so myself - a rising stock market is certainly one of the hoped-for transmission methods for goals such as restoring animal spirits and loosening the credit reins. The problem under consideration is two-fold: the effects of additional central bank stimulus on both the real economies they are responsible for, and on the financial markets they inhabit.
I also want to make it plain that I am not proposing a blanket repudiation of quantitative easing or monetary easing. What I am proposing as fallacy is one, the notion of quantitative easing as anodyne against all ills and in every wind; two, the financial market belief that asset prices cannot fall so long as there is stimulus. The latter is acting as if the central banks have solved the business cycle: simply print more money, and there will never be any contraction.
Indeed the latter point underlines one of the great weaknesses underlying prevailing market beliefs. The explicit sentiment, as represented in the MarketWatch comment above, is that QE must lead to higher asset prices. However, implicit in this notion are two very serious flaws, the first being that asset markets are insensitive to the business cycle. The second, more fundamental (and more serious) flaw is the one implicit in such phenomena as Farrell's rule cited above, the New Economy (i.e., dot-com) and the granddaddy of them all, Tulip Mania: the business cycle has been repealed.
The overwhelming sentiment I see in market commentary from professional and amateur (skilled or not) investor is that the market cannot seriously correct until the Fed seriously raises interest rates. However, that cannot be true unless the two flaws above are eliminated, leading to the unavoidable inference that so long as the Fed does not rates (or only raises them a little), the business cycle cannot end. Stimulus has overturned it. Either that, or for the first time in history, asset prices are now insensitive to the cycle and its declining cash flows. It's a new era.
It's become fashionable these days to talk about recessions as being pure children of the Fed. In other words, they only happen when the Fed crushes the economy with the sledgehammer of much higher rates (I am quoting almost verbatim). Once again, this sentiment presumes that the business cycle can somehow be overturned. It also flies in the face of the evidence of the last two recessions.
The tech bubble did not burst because of rising interest rates. It burst when the country was so ridiculously awash in new telecom gear and South Sea Bubble-style dot-com enterprises that hardly anyone could make money from them anymore. The housing bubble didn't burst either because of higher rates. It's true that at the margin, higher short-term rates made some of the more exotic financial products unprofitable, and higher mortgage rates raised monthly payment levels, but this is akin to complaining that the newest batch of cadavers aren't pretty enough to be vampires. They're still dead.
The financial system began to collapse in 2007 when it ran out of warm bodies to give a mortgage to and early-default rates soared. Like Tulip Mania, both the dot-com bubble and the housing bubble became pyramid-like schemes that crucially depended on the ability to flip purchases to a higher bidder, Such schemes always end the same way - eventually everyone is a seller and no one is a buyer - regardless of the level of interest rates.
One of the biggest problems in political economy is the overwhelming human desire for simplistic, one-size-fits-all policy formulations that can be relied upon in every situation. Cut taxes. Increase spending. Balance the budget. Don't balance the budget. Wear the black sweater today. The truth is that most policy prescriptions only work at certain times and places. The Fed can cause a recession - it certainly did in 1980-1982, and most deliberately so, with short rates approaching 20% (not a typo) - but in most cases, the Fed is simply taking away the last cocktail from an economy that has had more than one too many, and is about to get sick and pass out anyway.
We don't blame ourselves for paying insane prices for money-losing tech stocks, or taking out million-dollar mortgages with $50,000 incomes, or buying and selling derivative products that are indecipherable to mathematicians. No, we blame the Fed for raising rates.
For a good summary of why China cannot stimulate its way out of the business cycle, see this note from Michael Pettis (brought to my attention by John Mauldin). For evidence on why the Fed cannot do it either, read this column again - and see the problem presented by Bill Gross in his monthly commentary.
I had hoped to present a case on the ECB, but have run out of time and space. Of course the ECB might do something to make stock prices go up first - think about tulips, think about dot-coms. Then ask yourself how a crippled economy can only be a win-win of either more stimulus or more GDP, in light of how well it worked in Japan over the last thirty years. Ask yourself why inflation will have to rise in Europe, when the era of QE in the U.S. has experienced an inflation rate 100 basis points lower than the cycle that preceded it. What the EU needs most of all is a much weaker euro - like about 25% lower for a start - and it won't get it without undergoing collapse first. Think about it. You're betting that someone else will buy your tulip.
Central bank stimulus is not an invisible force field against adversity. It may have crept into the popular imagination that way of late, the way investment mantras do, but there is no historical evidence to support it. In the meantime, consider that U.S. domestic valuations are very dangerously high, that the margin for error is dangerously thin, and that investor bearishness is at multi-decade lows. If nothing at all goes wrong, then stocks will continue to rise. But something always does, as Farrell's rule #3 observes. That would bring rule #1 into play: Markets tend to return to the mean.
Keep an Eye on Oil for a Turn Higher
by Greg Harmon
Crude Oil has had a rough summer as the price has pulled back since the Summer solstice. But the price action shows that it might be ready for a rebound. The chart below gives two reasons to watch for it now.
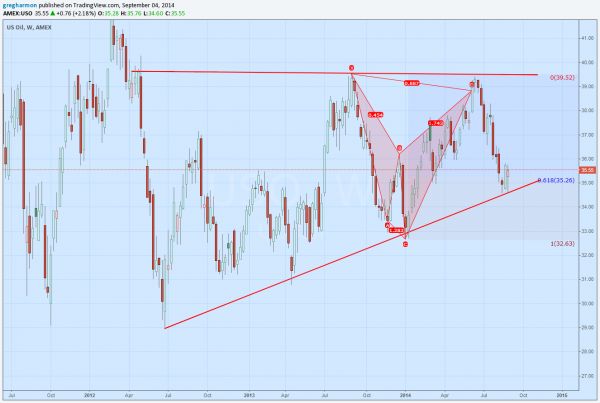
The first is that it hit rising trend support 2 weeks ago and followed that with a bullish engulfing candle higher last week. A continuation this week with a close Friday above 35.83 on the Oil ETF, $USO, would seal the deal for a reversal. The second is a play out of a harmonic pattern. The price action since this time last year has drawn out what is known as a bearish Shark harmonic pattern. Upon reaching point ‘D’ the pattern calls for a reversal, and price did fall. In fact the current bottom of the fall is at the 61.8% retracement of the pattern that the harmonic targets, a perfect palce for it to reverse back higher.
How high will it go? You will just have to watch and see but the 39.50 area has been resistance , creating an ascending triangle pattern. Often after these ascending triangles have 5 extreme touch points they look to break out of the pattern. This one has 6 extreme touches, so at 39.50 it may be ready for more. You just have to keep watching.
Playing Defense With ETFs
Summary
- Many defensive assets are highly correlated to the broader stock market, offering at best the possibility of smaller losses.
- The best defensive move is to increase cash.
- Leveraged and short ETFs are high risk if timing is even slightly off.
- ETFs such as UUP offer upside potential during corrections, but less downside risk than short or leveraged ETFs.
There's isn't a single definition of defensive stocks, but most investors agree that defensive stocks are those in non-cyclical industries such as consumer staples, healthcare and utilities. Defensive stocks also include those stocks with relatively high dividends, which makes them attractive to income-oriented investors who are likely to hold through a bear market. Defensive stocks are supposed to outperform during market corrections
Defensive stocks are predicted to perform better during the late stages of a bull market when investors rotate out of cyclical sectors and into non-cyclical sectors. The argument is that investors sell one sector with volatile earnings tied to the business cycle, such as energy, and buy another with more stable earnings, such as healthcare. There is another argument that says defensive shares perform better not due to investor buying, but a lack of selling. Investors dump their cyclical shares ahead of and during a correction, but hang on to blue chip dividend paying shares.
While sector rotation occurs, the fatal flaw with defensive stocks is that bear markets are in large part psychological. Looking back at IBM (NYSE:IBM) earnings, one would be unable to pinpoint the 2008 financial crisis since earnings went up in 2008 and 2009, but IBM shares still fell more than 40 percent. Even if a company continues to grow earnings through a recession, the bear market hits valuations as investors demand a greater margin of safety.
Here's one example of a defensive ETF, Guggenheim Defensive Equity (NYSEARCA:DEF). In green in the chart below is the price of the SPDR S&P 500 Index (NYSEARCA:SPY). Even though DEF has performed well relative to the S&P 500, it hasn't behaved as might be expected by investors looking for a fund that holds up in a down market.
(click to enlarge)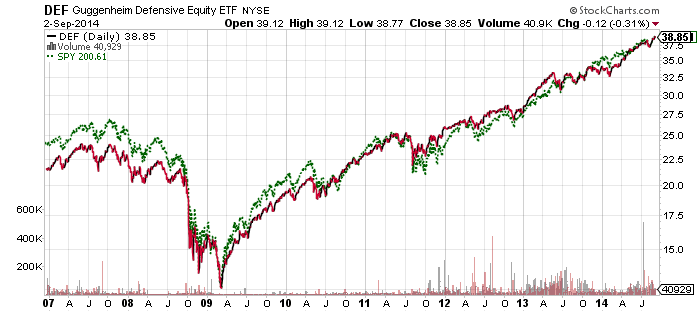
In 2008, DEF declined 30 percent, better than the S&P 500's 37 percent decline. Supposedly, defensive sector funds didn't fare much better. SPDR Healthcare (NYSEARCA:XLV) delivered a relatively impressive 23 percent loss in 2008, well ahead of the S&P 500 Index, but still a major loss.
If the goal is relative performance, DEF and XLV did outperform the S&P 500. However, it makes more sense to include funds such as these as part of a long-term passive portfolio strategy because significant losses will still occur in a bear market. For an investor who is actively rotating into defensive sectors to avoid expected losses, why not pick something that won't lose money?
The Defensive ETFs
In order to qualify as defensive, an ETF or stock should be preferably low risk and lower volatility (which rules out short and leveraged ETFs), and be negatively correlated with the stock market.
U.S. Dollar
Although neither an ETF nor a stock, cash qualifies as a defensive position. Many investors turn to cash during a bear market, selling their riskiest assets in order to cut their losses. In essence, every purchase of an asset is also the selling of cash, or U.S. dollars for U.S. investors, and during a bear market demand for U.S. dollars, or cash, tends to increase dramatically.
Taking the move to cash one step further, investors can use PowerShares U.S. Dollar Index Bullish Fund (NYSEARCA:UUP) as a defensive position. UUP owns U.S. dollar index futures contracts. The index is about 58 percent in the euro, 14 percent in the Japanese yen and 12 percent in the British pound. For most investors, risk-on leads to buying assets such as bonds, stocks and real estate. Risk-off involves reversing those positions, and that means buying back U.S. dollars. Since the world remains heavily indebted, reducing risk also involves repaying debt, much of which is U.S. dollar denominated, and that leads to a scramble for U.S. dollars during market panics.
Returns haven't been stellar for UUP over the long-term: the fund was up 4.80 percent in 2008, but it has lost ground in every year since then. It is up 2.3 percent so far this year. However, while UUP has consistently lost ground and underperformed the U.S. Dollar Index, in part due to the expenses and the costs associated with rolling futures contracts, its largest annual loss was 6.52 percent in 2009. Furthermore, as the chart below shows, UUP has seen high volatility in its favor when the stock market endures a meaningful sell-off.
(click to enlarge)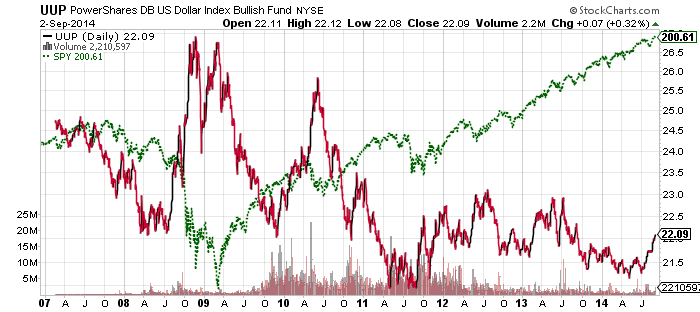
What makes UUP attractive as a defensive fund is that investors do not have to be overly concerned with timing. Even if the market doesn't correct and the U.S. dollar weakens, losses are likely to remain limited (assuming it's not the U.S. dollar that is correcting). UUP has a negative 0.72 correlation to the SPY since 2008, but that rises during corrections. Investors won't make a lot of money holding UUP, but a gain of about 10 percent is likely during the correction if there is a major global sell-off in stocks or if a correction is due to problems in Europe, since the euro is such a large component of the dollar index. In a smaller correction or one focused on the U.S. market, UUP may not provide much upside.
Treasury Bonds
Investors who want to take on more risk, for a chance at more reward, can look to U.S. treasury bonds. Since interest rates typically fall during a market correction and investors move towards the safest of assets, U.S. treasuries tend to catch a strong bid during corrections. The most volatile of these is PIMCO 25+ Year Zero Coupon Treasuries (NYSEARCA:ZROZ), and behind it, iShares Barclays 20+ Year Treasury (NYSEARCA:TLT). In contrast to the low volatility UUP, ZROZ saw a gain of more than 60 percent in 2011 and a loss of more than 20 percent in 2013. ZROZ wasn't around in 2008, but TLT scored a nearly 34 percent return that year, and gained 34 again in 2011. TLT lost nearly 22 percent in 2009 and lost 13 percent last year.
(click to enlarge)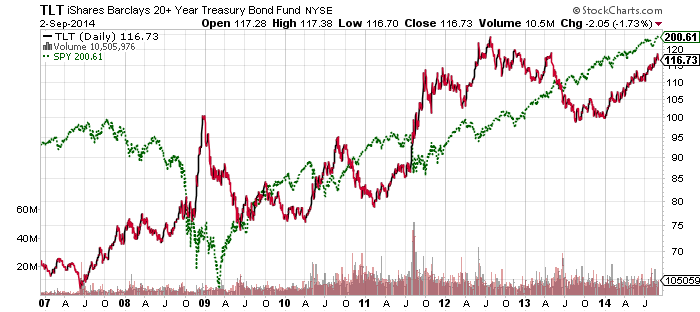
Investors who want less risk can move from long-term treasuries to intermediate-term treasuries. iShares 7-10 Year Treasury (NYSEARCA:IEF) gained more than 15 percent in 2011 and lost about 6 percent in 2013.
Gold
One issue some investors may raise with UUP and funds such as TLT is that the U.S. dollar and treasuries might be the cause of a major bear market. Although TLT has a very high negative correlation to the S&P 500 during market corrections, TLT actually has a positive 0.63 correlation since the start of 2008 due to the Federal Reserve's low interest rate policy benefiting both bonds and stocks. In the event that rising interest rates and a weaker dollar sparks a stock market sell-off, or if a correction is centered on deflationary concerns such as in 2008 or 2011, or sovereign debt concerns as was seen in 2010 and 2011, investors may flock to gold as a safe haven. Gold is not as attractive as a general defensive asset, but investors concerned about these specific risks should consider gold as a defensive holding.
iShares Comex Gold (NYSEARCA:IAU) or SPDR Gold (NYSEARCA:GLD) are two of several options.
Conclusion
Ultimately, turning defensive is mostly about timing, and if you can time the market, you're 90 percent done. The last 10 percent is crucial though: picking the right fund. Many investors who correctly anticipated a crisis in 2008 did poorly because they expected the U.S. dollar to collapse instead of nearly all currencies collapsing against the U.S. dollar.
For the vast majority of investors who are terrible market timers, the best way to turn defensive is to rotate out of riskier, more volatile assets and raise cash. In 2008, cash produced relative outperformance of nearly 40 percent versus the S&P 500 Index. Often times less is more.
It also pays to be prudent. Going completely to cash, for example, is risky if the market goes on to gain 30 percent in the next year. The temptation to get back in at higher prices may cause an investor to miss out on gains and then take losses when the bear market eventually arrives.
Instead of making large moves, take small steps. Move 5 to 10 percent of the portfolio into a more defensive position and then wait to see if you are correct. If the market keeps going up, but you're able to sleep better with 10 percent in a defensive position, there's no need to increase it. The same goes for buying back in. Don't try to time a bottom, but rather slowly move back into a fully invested position as the market drops.
Use stops or actively manage defensive positions. The purpose of a defensive position is to protect capital against losses, not to take losses. Market corrections last weeks, bear markets months. If the asset in question is not behaving as expected and falling along with the market, exit the trade.
For those who are terrible market timers, but insist on trying to time the market, stick with the ETFs that won't blow up your portfolio. Short and leveraged ETFs must be very well timed or they will cause losses that are very difficult or impossible, to overcome.
Remember to sell. A defensive trade is not a long-term investment. Selling a little early or a little late is better than waiting until a gain turns into a loss. The big gains are made during bull markets, not bear markets (unless you're a professional short seller).
Protect Your Portfolio And Profit When Equity Markets Are Declining With The New CDS ETF
Summary
- The first 2 CDS ETFs have just hit the U.S. market, making it easier for individual investors to gain direct exposure to credit risk.
- With credit spreads near historic lows, it is inexpensive to bet on declining credit quality using WYDE, an ETF that is short high yield credit default swaps.
- Credit default swaps have the potential to deliver strong positive returns when other asset classes are plummeting.
- WYDE has significant negative correlation with equities, so owning a position in the ETF helps reduce portfolio volatility.
Proshares just introduced 2 new ETFs tied to credit default swaps (CDS), for the first time giving the average investor the ability to directly take a position in credit risk. These 2 ETFs give investors exposure to the credit of U.S. based, high yield issuers, with the CDS North American HY Credit ETF (BATS:TYTE) taking a long position (betting on improving credit quality), and the CDS Short North American HY Credit ETF (BATS:WYDE) taking a short position (betting against credit quality). I believe this represents an extremely attractive time to invest in WYDE, due to strong return potential and significant portfolio diversification benefits.
Credit Default Swaps in a Nutshell
When an investor buys a bond, they are indirectly investing in a number of components making up the bond, including its risk free return, its associated credit risk, its sensitivity to interest rate movements, and prepayment (for callable bonds), extension and other risks.
Credit default swaps allow an investor to isolate the credit risk in a bond or group of bonds. An investor who is short a CDS can remove credit risk from their bond investment, allowing them to focus on the other risks inherent in fixed income investing. An investor could also go long a CDS instead of buying a bond to isolate the return from credit risk without worrying about the other risks involved in owning a bond.
Each CDS is a contract between 2 parties which transfers credit risk from one party to the other. The person that is short the CDS is essentially buying insurance; they pay the party that is long the CDS a fixed payment, and in exchange the long will cover any losses on their investment. High yield CDS have a standard payment of 5% a year, with the price of a CDS adjusting to effectively increase or decrease this spread to an appropriate market rate. At the time WYDE started trading its weighted average CDS spread was 3.42%, with this spread tightening slightly since it was issued leading to a moderate price decline.
WYDE and TYTE cover the credit of the North American high yield market through the use of the Markit CDX NA High Yield index. The CDX NA High Yield index is made up of the 100 most liquid individual company credit default swaps within North America which have below investment grade credit ratings, with each of these companies equal weighted at 1% of the index. The index is rebalanced twice a year, taking out companies which no longer qualify to be in the index and removing companies that have defaulted.
For each defaulted company a determination is made as to its recovery rate (which is the amount bondholders will receive from the defaulted company); based on this recovery rate, the CDS buyer receives money to compensate them for the amount of money they lost, making their investment in the bond whole. Below is an example given by Markit:
Assuming a recovery of 70 cents on the dollar, all protection buyers are compensated 30 cents in the dollar on the defaulted name. For LCDX contract holders, where each entity has a 1% weighting in the index, they are compensated 1% * 0.3 multiplied by the notional of the LCDX trade. For a $10m trade, this is $30,000.
Investing in either TYTE or WYDE lets an investor take direct exposure in the loss rate of a portfolio of high yield bonds. Whether used for hedging, speculating on credit changes or for portfolio management purposes, these new ETFs open up a new range of opportunities to individual investors which were previously only available to high net worth individuals and institutional investors.
The Opportunity
Right now, credit spreads are hovering near all-time lows (shown below), meaning now may be the best time to enter into a short CDS position. With credit spreads this low, buying into a short CDS position can be done at a rock-bottom low cost with a far greater opportunity for price appreciation.
(click to enlarge)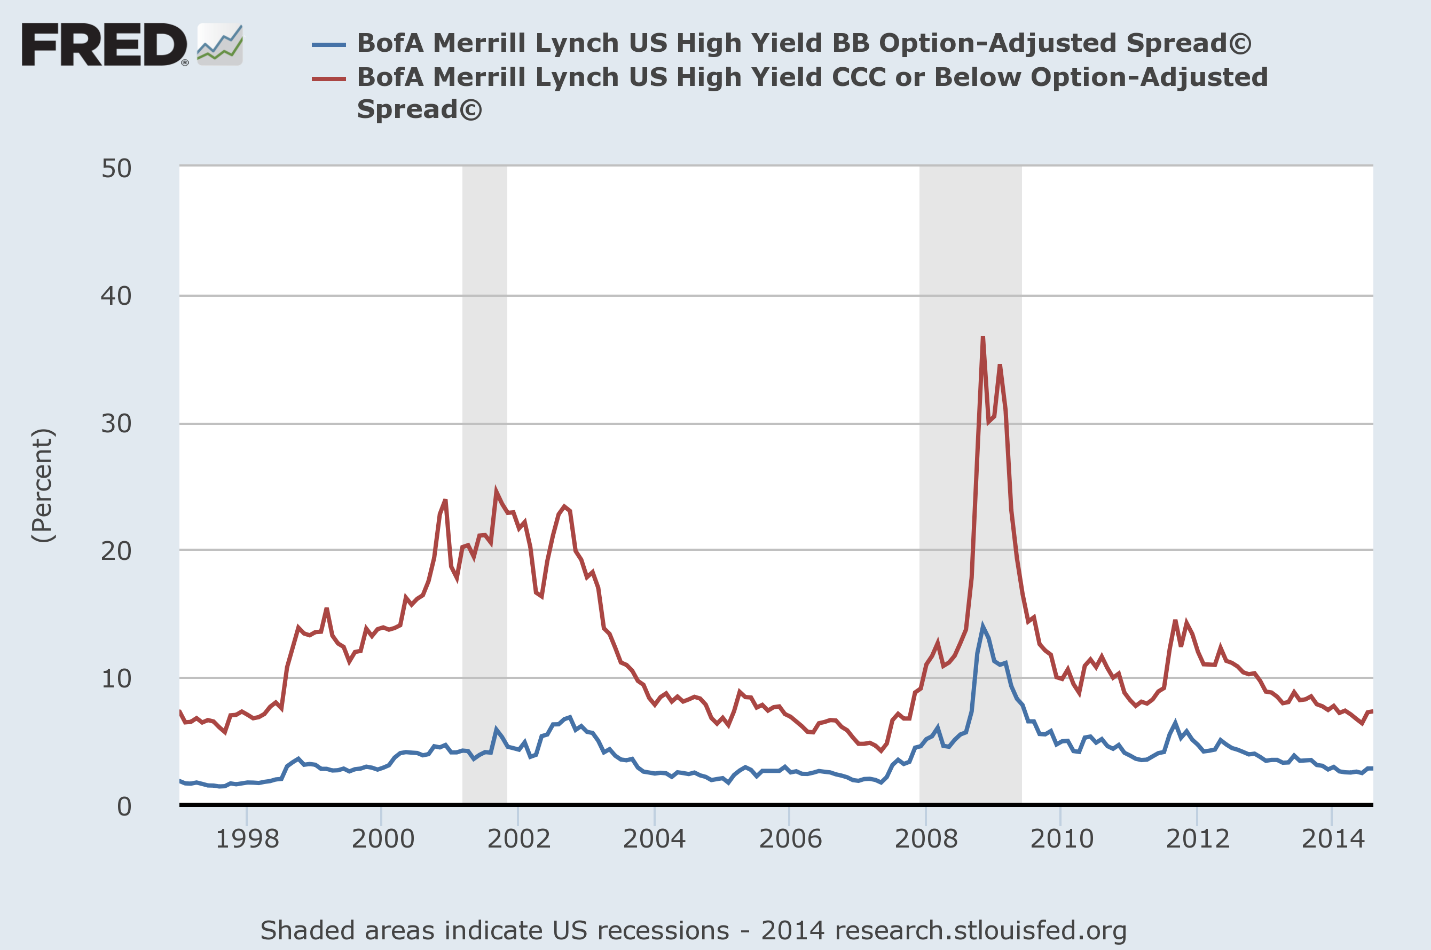
(Image borrowed from an article by Robert Singarella Jr.; I'd encourage readers to view his article for a contrary perspective.)
With the NA CDX High Yield index tracking a portfolio consisting of companies rated BB and below, its spread will fall somewhere between the 2 lines in the chart above, as it holds swaps covering the credit of companies with ratings between those lines. When the credit spread increases it causes an increase in the price of WYDE, the short CDS party, and a decrease in TYTE, the party long the CDS. Correspondingly, a decrease in this spread would lead to a decrease in price for WYDE and an increase in price for TYTE.
CDS pricing has a high correlation with credit spreads as an investor can buy an equal weighting of each of the 100 bonds in the index, enter into a CDS to protect against their losses and earn a risk free rate of return. If the CDS were trading at a lower spread than the same portfolio of bonds, an investor could buy the portfolio of bonds with a high spread (say 5%), enter a short CDS at a lower spread (say 4%) and earn a risk free profit (of 1%).
Because of the large amount of liquidity in the CDS market, overall pricing should reflect this credit spread in order to prevent investors from engaging in this arbitrage opportunity, with the high liquidity of individual company CDS's also helping to enforce this relationship. Although the correlation between credit spreads and CDS pricing will not be perfect (due to the 5 year contract length, the 100 company sample, and the price of the contract corresponding to future credit losses, not the spread), this does help decipher the underlying fundamentals behind CDS pricing. This also helps show how the current historic low in CDS pricing represents a longer-term opportunity, as defaults and credit spreads have almost nowhere to go but up.
A large part of the return to an investor in WYDE or TYTE will be from changes in the price of the CDS, especially over shorter time frames. Over the lifetime of a CDS contract however, profits are determined by the CDS' cash flows, with the loss rates on the underlying constituents paid by the long party less the fixed coupon paid by the short party determining the overall return to each investor. Looking at historic loss rates (shown below) helps to estimate the cash flows and fundamental value underlying the CDS. Overall, loss rates have a high correlation with credit spreads, but with smaller absolute changes, as credit spreads are forward looking estimates of default rates (and therefore prone to significant judgment), which are often made with limited information during high stress, high risk environments.
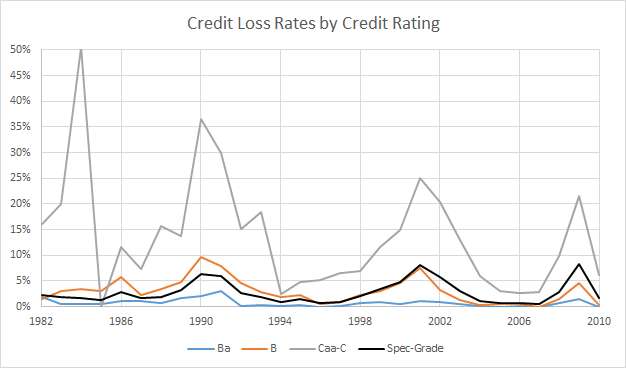
(Source: Moody's)
According to Moody's, between 1982 and 2010 the average speculative grade credit loss rate was 2.78%, meaning that over the long run investors that have been long credit default swaps (those taking on the credit risk) have earned a profit. This makes sense as they are essentially selling insurance and expect to profit over the long term from taking on added risk. At current credit spreads of less than 3.5%, the premium for taking on credit risk is minimal, with this "insurance" costing only 50 basis points above the average loss rate experienced over the last 3 decades.
The reason for this low spread is that defaults have been low in recent years, with current defaults near historic lows of 1.8%, helping to fuel this incredible decline in credit spreads, and creating this opportunity in WYDE. Although defaults are not likely to spike in the near term, the current spread provides an impressive entry point for investors looking for an eventual spike in defaults.
Credit Quality Trends in the U.S. Market
Another factor which makes investing in WYDE an attractive proposition is the overall decline of corporate credit quality over the last few decades. The graph below shows aggregate profits and aggregate debt levels of U.S. based non-financial corporations on the left axis, with their total profits expressed as a percentage of debt on the right axis.
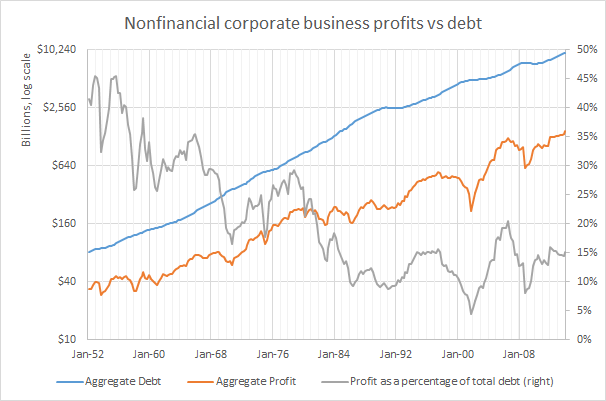
(Source: Federal Reserve data, Z1)
Overall debt has risen at a much faster rate than profits, with this trend starting in the late 60's and early 70's but accelerating during the debt-fueled leveraged buyout craze of the 80's. This trend has continued recently as well, with profits rising only 16.7% since the last market peak of Q3 2006 with debt increasing by 57.4% over this timeframe. As of now, it would take 6.6 years of non-financial corporate profits to repay cumulative debt, with this figure seeing levels as low as 3 years as recent as the 60's. Since this is an aggregate figure, many corporations are in far worse shape than this average, especially companies in the high yield bracket.
A higher level of debt relative to profits means that when the average company's debt comes due they are less likely to be able to fund the repayment of principal through internally generated funds. This can have the effect of creating situations where a company is forced to enter the capital markets during inopportune times, either at a time when the company is experiencing a slowdown in sales or during recessionary periods where it is more difficult to draw in funds. At higher levels of debt a company has less room for error, and is more prone to default if business or financial market conditions worsen.
The effect of swings in profits on debt coverage also helps to highlight why equity markets and credit markets (especially high yield) are so closely correlated.
Despite the large amount of negative things that have been said about credit rating agencies, they have factored in this massive increase in corporate debt in their ratings, with the proportion of companies with below investment grade credit ratings increasing dramatically over the last 3 decades (as shown below).
(click to enlarge)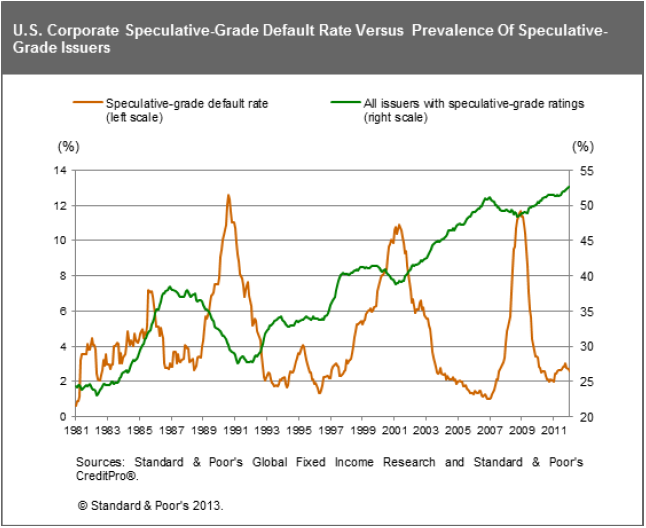
(Source: S&P)
Despite the current low levels of defaults, this continued decline in credit quality should eventually lead to another spike of defaults over time.
Catalysts
Investors in WYDE also benefit from a number of medium-term catalysts.
First amongst these catalysts is the upcoming maturity of a large amount of high yield debt (shown below, with these figures from 12/31/2013). The maturity of debt creates a reevaluation of business prospects, resetting both the interest rate and risk spread to the new market levels. If business or competitive conditions have worsened for a company, it creates a situation where the market may demand a significantly higher coupon in order to refinance its debt, adding to the struggling company's burdens. During periods where a greater number of companies are forced to refinance their debt, defaults are inclined to reach higher levels, especially if it coincides with a period of general market weakness.
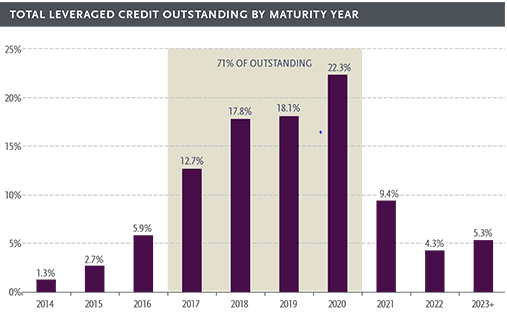
(Source: Guggenheim)
Adding to this refinancing issue will be the eventual rise in interest rates over the next few years. High yield companies have benefitted from historically low financing costs due to both record low risk-free interest rates and record low credit spreads. With both of these values poised to rise over the next few years this will put added pressure on high yield companies, further increasing default pressure.
Conclusion
This combination of above average default potential, historically low cost and significant room for price appreciation gives WYDE a good chance to deliver positive returns going forward. Coupled with significant negative correlation with equities, it is a good candidate for inclusion in a conservatively minded portfolio looking to hedge away credit risk or diminish equity related risk.
Subscribe to:
Comments (Atom)