by Tony Caldaro
REVIEW
The week started off at SPX 2110. Then after dipping to SPX 2103 Monday morning the market rallied to new highs at 2120 by Wednesday. After that it spent the next two days within that range. For the week the SPX/DOW were -0.1%, the NDX/NAZ were mixed, and the DJ World index was +0.3%. On the economic front negative reports continued to outpace positive ones. On the uptick: Case-Shiller, durable goods, the FHFA, consumer sentiment, and pending homes sales. On the downtick: existing home sales, consumer confidence, the CPI, the Chicago PMI, Q2 GDP, the WLEI and weekly jobless claims rose. Next week’s reports are highlighted by monthly Payrolls, the FED’s beige book and the PCE.
LONG TERM: bull market
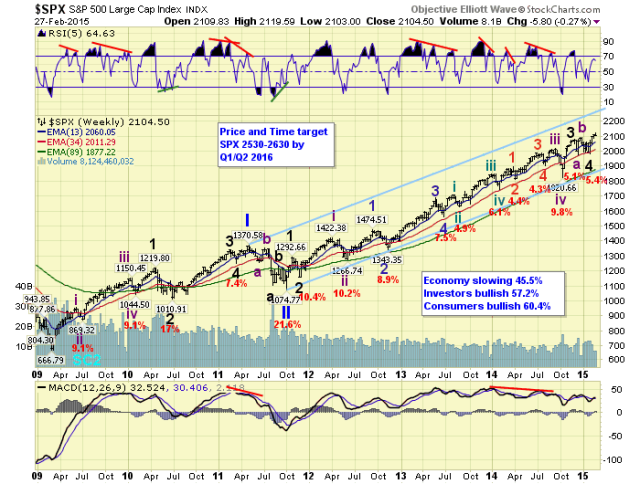
The five primary wave Cycle [1] bull market from March 2009 continues. Primary waves I and II completed in 2011, and Primary wave III has been underway since then. During the entire 130 year recorded history of the US stock market there has only been five bull markets that have lasted five calendar years or more: 1921-1929, 1932-1937, 1987-2000, 2002-2007 and 2009-2015 so far. Of these five, three have been the last three bull markets and the current one is the third longest in history. During each of these five bull markets each of the three rising waves unfolded in 1, 2, 3, 5 or 8 years. These are all Fibonacci numbers. The longest one for example had rising waves of 3, 8 and 2 years. As a result of this analysis, and the new highs posted this year, we are expecting Primary III to top around Q1/Q2 of 2016. When applying several mathematical relations we arrived, as posted last week, with a target of SPX 2530-2630 for Primary III. Then after a steep Primary IV correction we are expecting the bull market to top in 2017, completing an eight year long term uptrend. Fundamentally, the ECBs EQE, scheduled to start in March, supports this scenario.
We have labeled Primary III with Major waves 1 and 2 in late 2011, then Major waves 3 and 4 in late-2014 and early-2015. The current uptrend, which started in early -February, should be the beginning of Major wave 5. Since we are not expecting Major wave 5 to complete until next year, we are labeling this uptrend as Intermediate wave i. After it concludes we still should have at least four more trends, Intermediate waves ii thru v, before Major wave 5 completes. Since this uptrend is only one month old, and has not reached an overbought condition on the weekly RSI, we are expecting it continue higher.
MEDIUM TERM: uptrend
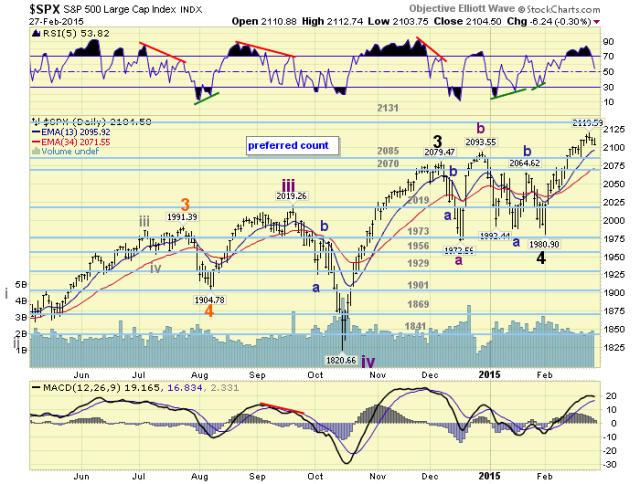
After a somewhat complex Major wave 4, Major wave 5 began on the first trading day of February. From the downtrend low of SPX 1981 the market has risen about 7% during this month. Currently we see five waves up from that low, with each rising wave shorter than the previous wave: 2072-2042-2102-2085-2120. This is a bit unusual for a potential completed wave pattern, since the third wave is usually the longest. However, it is acceptable since the fifth wave is the shortest wave.
The easiest way to count this pattern is either: 1. a completed uptrend, or 2. a completed wave 1 of the uptrend. In both of these cases the SPX would have to drop below 2085 to consider either of these two counts valid. Since we are expecting the uptrend to continue higher, #2 would then be the best option. Another way to count this pattern would be a series of subdividing waves. More on this below. Medium term support is at the 2085 and 2070 pivots, with resistance at the 2131 and 2198 pivots.
SHORT TERM
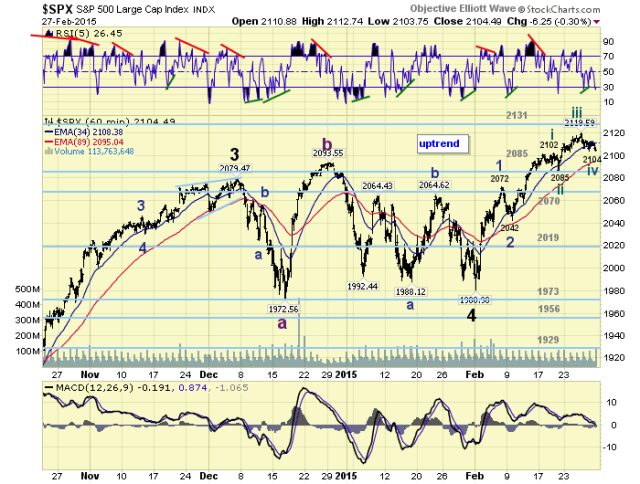
If we were to consider this uptrend currently in a series of subdividing waves, then the easiest count would be a 1-2, i-ii, 1-2. But this seems a bit stretched since this uptrend has already risen about 140 points from its low. The count we do prefer is the one posted on the chart below. This suggests Minor waves 1 and 2 completed at SPX 2072 and 2042. Then Minor wave 3 has subdivided into four Minute waves thus far: 2102-2085-2120-2104. With this count, and the somewhat lethargic market action lately, we would expect Minor 3 to top around the OEW 2131 pivot. This count also offers several interesting wave/price relationships.
With Minute i 60 points, (2042-2102), and Minute iii only 35 points, (2085-2120), the maximum Minute v could reach is also 35 points, (2104-2139). Wave five can not be longer than wave three, when wave three is shorter than wave one. Should it exceed SPX 2139 then the triple subdivision noted above would be in play. Should it end around the 2131 pivot then another wave/price relationship comes into play. Minor wave 1 rose 91 points (1981-2072). In order for Minor 3 to equal, or better, Minor 1 it has to reach at least SPX 2133, (2042-2033 or 91 points). Should it reach SPX 2133 or better, then Minor 5 can be any length. If not, Minor 5 will be limited to the length of Minor 3 or less. Should it be less this uptrend will not make it to the OEW 2198 pivot. If more, then the 2198 pivot an even higher is obtainable before any sizeable correction.
While this all may seem quite complicated we will try to summarize with some defined levels. If the SPX drops below 2085 we will have five waves up from the 1981 low, suggesting either the uptrend completed, or more likely, only the first wave up of the uptrend completed. If/when the SPX rises above 2120 then Minor wave 3 continues. The rest we will deal with on a day to day basis as this market unfolds. Short term support is at SPX 2104 and the 2085 pivot, with resistance at SPX 2120 and the 2131 pivot. Short term momentum ended the week oversold.


