Wednesday, September 4, 2013

Oil prices weigh supply glut with geopolitical risks

By Phil Flynn

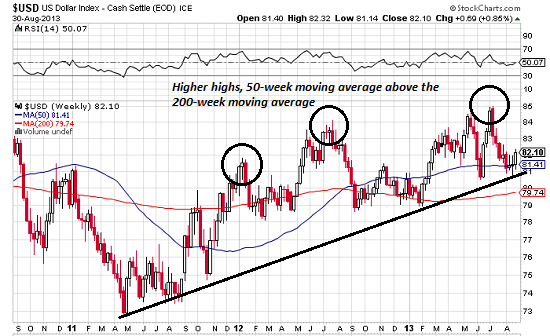
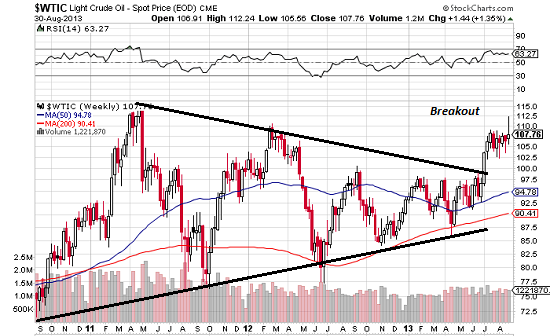
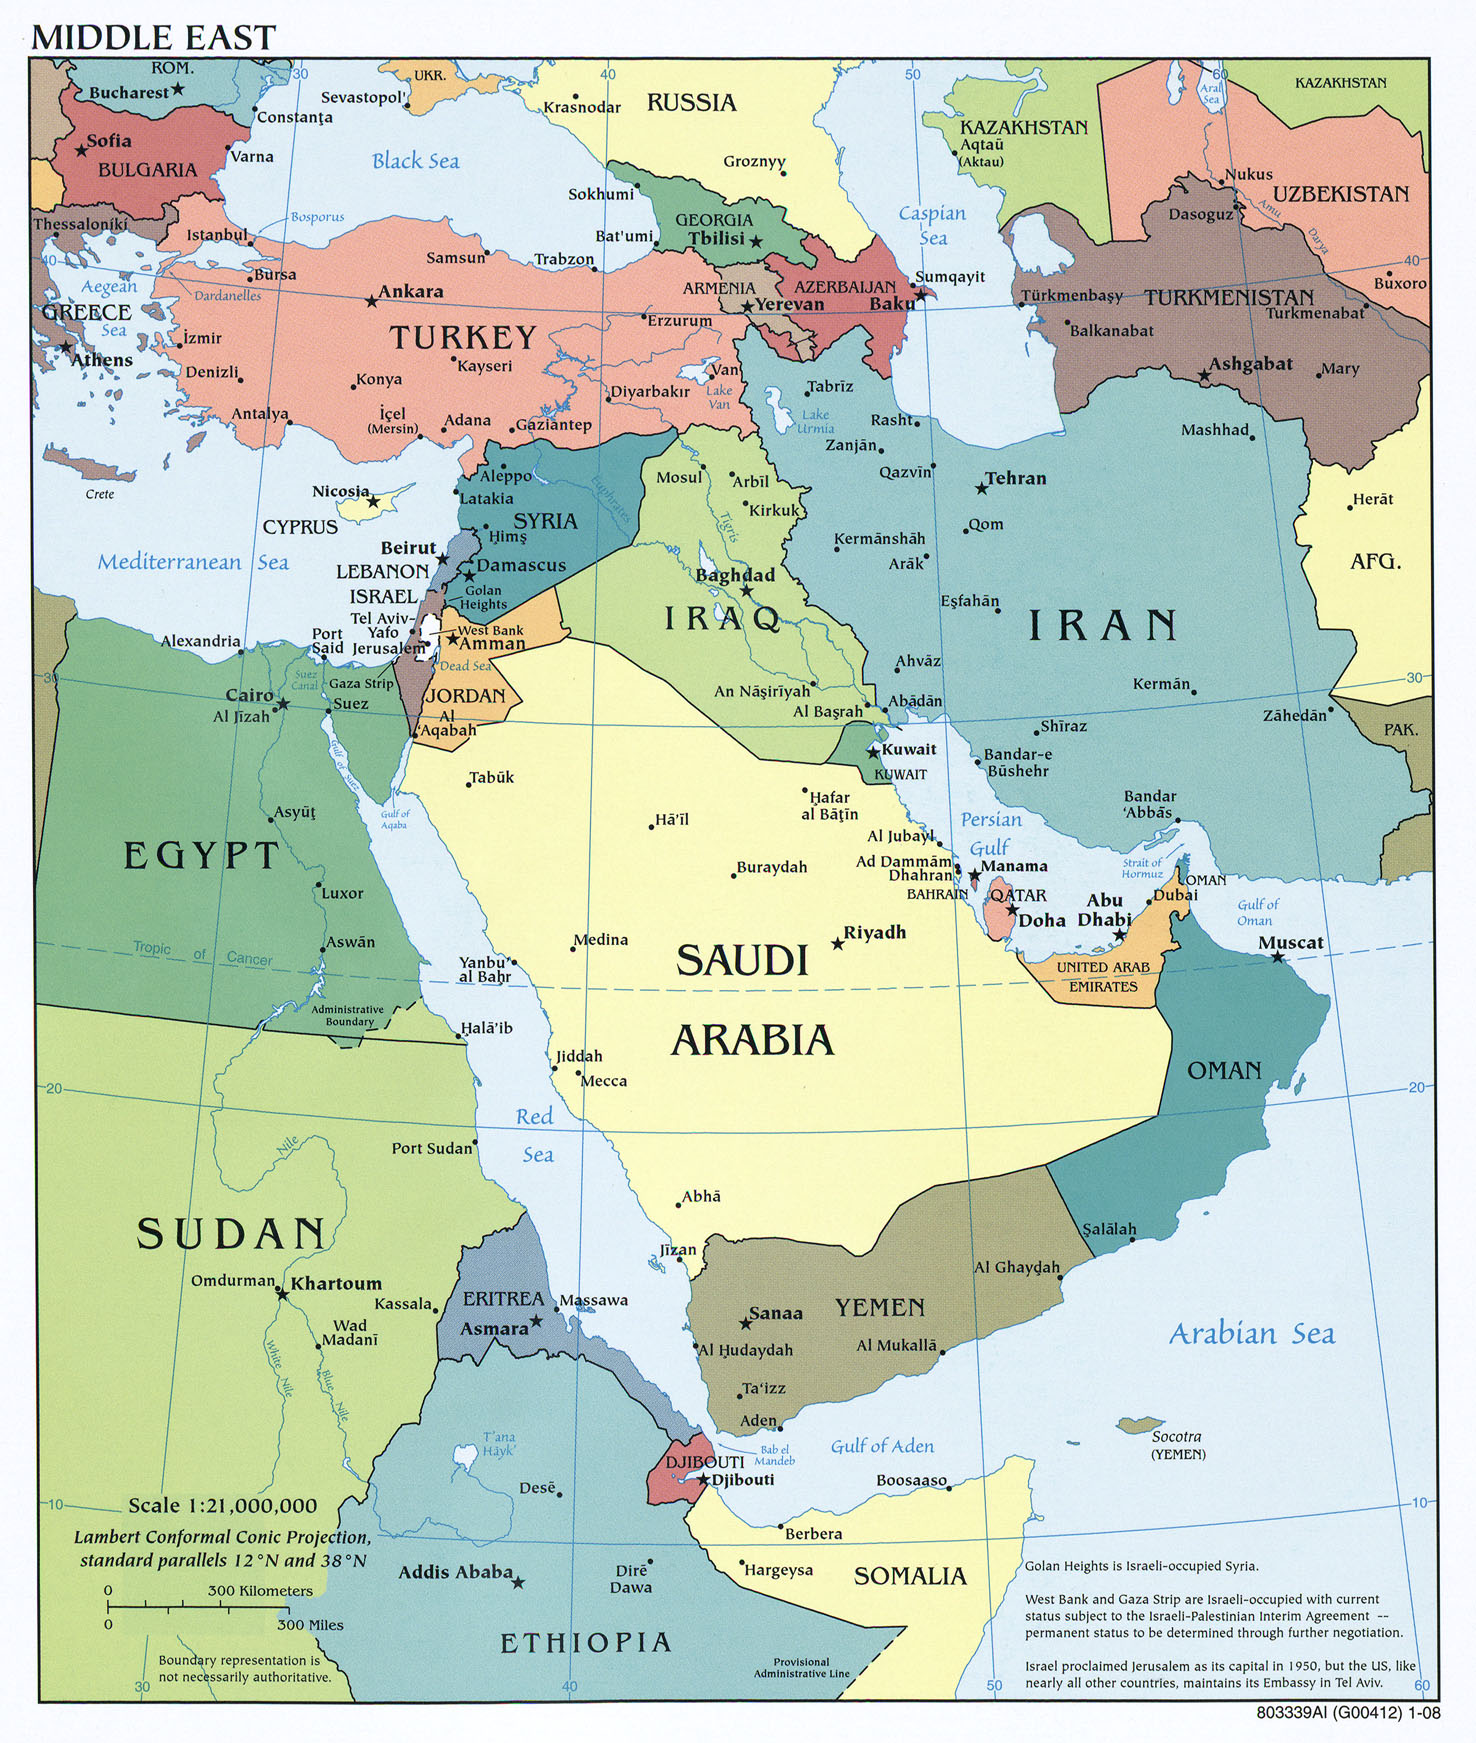
Speaker of the House John Boehner is on board and Senate votes today as the noose tightens around Syria’s neck. Even Vladamir Putin says he might be on board with an attack on Syria if it could be proved conclusively that the Assad regime actually used chemical weapons. Oil prices (NYMEX:CLV13) are being twisted and turned on all of the latest headlines. Seemingly wanting to break on a glut of supply but being supported by geopolitical risk. With the dollar on fire and emerging market currencies getting trounced, WTI continues to be supporting by the so called war premium. A war premium that not only includes a potential attack on Syria but has been juiced and pumped up by Egypt, Iraq and Libya as well.

Of course Mexico believes that the top is in. While Mexico isn’t exactly the best producer of oil, they know a good price when they see one. Reuters reports that Mexico has started executing its 2014 oil hedging program, energy trade sources said on Tuesday, bringing one of the biggest national oil sellers into the market amid a rally in crude prices. The annual hedging program, which is carried out by the Mexican Ministry of Finance, is closely watched by oil traders as the volume of selling needed to hedge even a percentage of the country's roughly 2.5 million barrels per day of production can move markets. Traders said the hedging program was depressing the Brent crude oil 2014 contract versus the Brent contract for delivery this December, which currently has a near $10 premium.

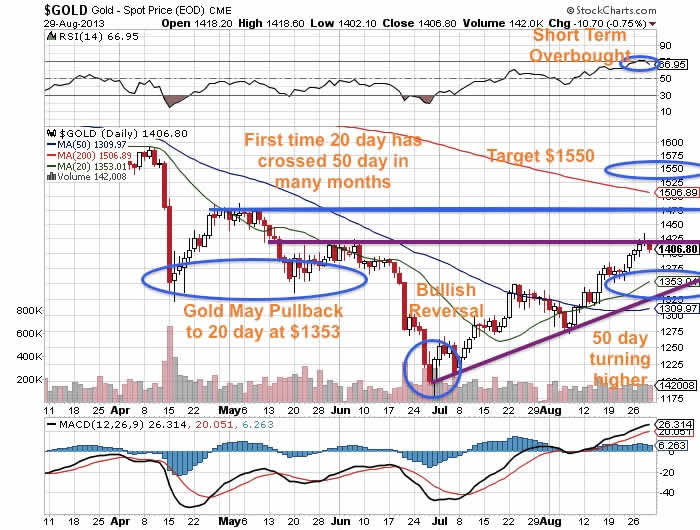
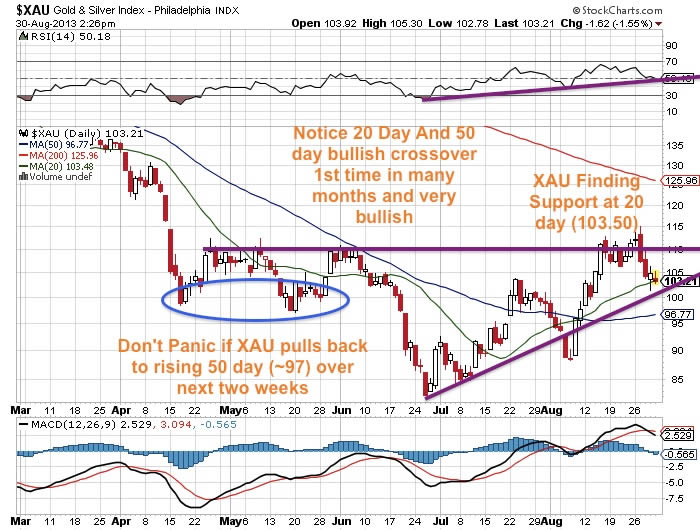
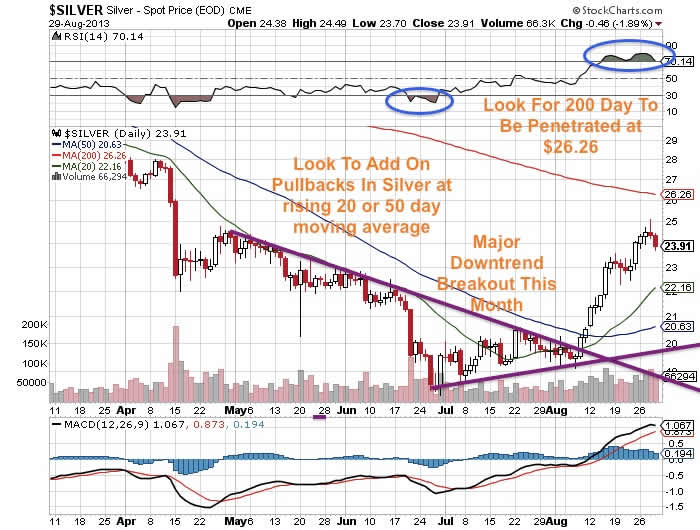
Gold (COMEX:GCZ13) and silver prices soared as emerging market currencies get smashed and South Africa’s National Union of Mineworkers, decided to go on strike and the possibility of war looms. Silver, the best performing commodity of last month, started off way in the lead once again.

Gold haters are stunned by the best back-to-back monthly performance of the metal since the 1970s. This market has many things in common with the 1970s and that is why we continue to maintain our bullish stance and a long term target of $2,400. Silver should retest $50 and longer term it should go as high as $77. Bottom line, never underestimate a market that has fallen under the cost of production and is seeing strong demand with a tightening supply scenario.

Barbara Powell of Bloomberg reported that gasoline slid to a three-week low as Monday’s U.S. Labor Day holiday marked the end of the nation’s summer driving season and a switch to winter-grade fuel, which is less-expensive to produce. Futures dropped as consumption typically declines after Labor Day when summer vacations end and students return to school. U.S. gasoline demand dipped to a five-week low in the seven days ended Aug. 23 and in June was the lowest for that month since 2001, government data show. Environmental regulations will ease this month, allowing refiners to choose from more components when blending fuel.

Supplies of reformulated gasoline blendstocks, or RBOB, along the U.S. East Coast, where Nymex futures are delivered, rose 687,000 barrels last week to 17 million, 8 percent higher than a year ago. Total U.S. inventories were 5 percent above the five-year average for that week, according to an EIA analysis.

Dow Jones reported that the national average price of retail diesel fuel rose 6.8 cents to $3.981 a gallon in the week ended Monday, the U.S. Energy Information Administration said Tuesday. That is the highest price since April 1. The price jump, the biggest since Feb. 11, came as crude-oil prices last week touched their highest level since February 2012 on worries that a potential U.S.-led strike on Syria could spill over into a broader crisis in the Middle East. Prices are 14.6 cents a gallon below their level a year earlier. The latest price puts retail diesel at 16.4% below the record high level of $4.764 a gallon hit on July 14, 2008. Then, diesel carried a premium to a year earlier of $1.875 a gallon as crude-oil prices soared to record highs near $150 a barrel. In its August Short-term Energy Outlook, the EIA said it expected diesel prices to average $3.91 a gallon in September, compared with a September record average high of $4.12 a gallon last year. The forecast is based on Nymex crude-oil futures averaging $100 a barrel, a five-year high for September, and up from $94.51 a year earlier.

Nymex crude futures opened the month on Tuesday at $108.54 a barrel.  Internationally traded Brent crude oil, which holds sway over gasoline prices, is expected to average $104 a barrel this month, down from the September record last year of $112.86 a barrel. Brent is averaging $115 a barrel so far this month. Prices rose in all regions, led by an 8.3-cent rise in the Midwest. Crude-oil prices accounted for 65% of the cost of diesel fuel in July, according to the EIA. Release of the EIA data was delayed one day by the Labor Day holiday on Monday. AAA Daily Fuel Gauge Report said its survey put retail diesel prices Tuesday at $3.935 a gallon, up 4.7 cents from a week ago. Prices were 5.1 cents higher than a month ago, but were 16.6 cents below a year ago.

See the original article >>

Coffee climbs as supplies start to dry up

By Jack Scoville

COFFEE (NYBOT:KCZ13)

General Comments: Futures were a little higher in all markets as traders noted little on offer. London was higher as deliverable supplies are falling. The cash market seemed relatively quiet, although Robusta differentials are said to be firming again as supplies start to dry up. However, wire reports indicate that Vietnam producers have started to harvest, and there is some talk that the crop could be as much as 27 million bags. Differentials are expected to start lower next month when export offers are expected. Most Brazil coffee producers apparently plan to move Coffee into the support programs and hope for higher prices, and that has cut offers to the market. Differentials overall appear weak for Arabica. Coffee appears to be available in Central America as farmers and mills clear inventories before the next harvest. Colombia is offering Coffee into the cash market at weaker differentials. Markets are very quiet, with little buyer interest seen and little selling interest reported. Buyers are said to be well covered. Current crop development is still good this year in most production areas of Latin America. Central America crop conditions are said to be good overall. Colombia is still reported to have good conditions. Harvest conditions are good in Brazil.

Overnight News: Certified stocks are higher today and are about 2.791 million bags. The ICO composite price is now 112.71 ct/lb. Brazil should get dry conditions or light showers. Temperatures will average near to below normal. Colombia should get scattered showers, and Central America and Mexico should get showers and rains. Temperatures should average near to above normal.

Chart Trends: Trends in New York are mixed. Support is at 116.00, 114.00, and 111.00 December, and resistance is at 120.00, 122.00, and 125.00 December. Trends in London are mixed. Support is at 1750, 1735, and 1730 November, and resistance is at 1800, 1825, and 1840 November. Trends in Sao Paulo are down with objectives of 134.50 and 123.50 December. Support is at 137.00, 134.00, and 131.00 December, and resistance is at 145.50, 148.50, and 150.50 December.

COTTON (NYBOT:CTV13)

General Comments: Futures closed a little lower and short term trends are down. Futures traded lower as traders weighed slow crop development against improving conditions and improved weather. Buyers have pulled away from the market and will wait for a bottom to form before buying in a big way. Very hot weather conditions in China continue, and the weather in Cotton areas is not really improving right now in that country. However, some showers are in the forecast to provide some help. Weather is moderate in the US. US crops remain behind the normal pace, but overall crop ratings are high and current conditions are called good. Texas is dry and warm. Weather for Cotton still appears good in India. The USDA crop progress and conditions report did not show improved crop conditions, and some new buying could surface today.

Overnight News: The Delta will be dry and Southeast will see a few showers. Temperatures will average above normal in the Delta and mostly above normal in the Southeast. Texas will see dry weather. Temperatures will average above normal. The USDA spot price is now 79.37 ct/lb. ICE said that certified Cotton stocks are now 0.018 million bales, from 0.021 million yesterday.

Chart Trends: Trends in Cotton are down with objectives of 82.70 and 81.20 October. Support is at 81.80, 81.20, and 80.00 October, with resistance of 84.00, 85.05, and 85.30 October.

FCOJ (NYBOT:OJX13)

General Comments: Futures closed lower and showed signs of breaking down from the recent trading range. It is the midpoint of the hurricane season and all remains mostly quiet. There are still no real threats showing in the tropical Atlantic for Florida or orange production as has been the case for the entire season until now. The weather in the tropics has started to show a little more life as some of the conditions for tropical development have improved, but there are no threats showing anywhere right now. Growing conditions in the state of Florida remain mostly good. Showers are reported and conditions are said to be very good in almost the entire state. Temperatures are warm. Brazil is seeing below normal temperatures and mostly dry weather, but production areas will turn warmer again this weekend.

Overnight News: Florida weather forecasts call for some showers. Temperatures will average near normal.

Chart Trends: Trends in FCOJ are mixed to down with objectives of 129.00 and 121.00 November. Support is at 129.00, 126.00, and 125.50 November, with resistance at 137.00, 139.00, and 140.00 November.

SUGAR (NYBOT:SBV13)

General Comments: Futures closed higher on reports of new demand from Iraq and Syria. Iraq has been buying Sugar all along, but Syria is having a tough time getting offers. There is a lot of Sugar in the world, but not much on offer in the cash market for now. The buying yesterday seemed more chart based in nature and less fundamental based. The Brazilian Real remains relatively weak and traders think Brazil will offer more for export. However, processors there remain more interested in Ethanol production as it pays better. Traders are also noting good weather for Sugar production in India, and the crop is expected to be big there. Countries like Thailand and India also expect more production this year, and Thailand is offering. Demand for ethanol has been good, but there is still a lot of Sugar and the supply side fundamentals seem to overwhelm any demand side strength over time. Chinese demand has been soft, but Middle East demand appears to be relatively good. Price appear to be in a trading range for now due to solid demand and big production.

Overnight News: Brazil could see dry weather and moderate temperatures Short term trends are now sideways.

Chart Trends: Trends in New York are mixed. Support is at 1625, 1610, and 1595 October, and resistance is at 1650, 1665, and 1685 October. Trends in London are mixed. Support is at 473.00, 470.00, and 465.00 October, and resistance is at 481.00, 486.00, and 488.00 October.

COCOA (NYBOT:CCZ13)

General Comments: Futures closed lower as traders noted better rains in West Africa. Ideas are that crop conditions there are generally improving, and these ideas pushed many speculators to sell again yesterday. Price trends turned down with the selling late last week. West Africa is expected to get scattered showers, and conditions there are said to be improving for almost all producers. Ghana has been getting rains, too. Temperatures are moderate. The harvest will be getting underway soon, and has already begun in Nigeria, with mixed results so far there. Malaysia and Indonesia crops appear to be in good condition and weather is called favorable.

Overnight News: Scattered showers are expected in West Africa. Temperatures will average near normal. Malaysia and Indonesia should see scattered showers, but southern áreas could be dry. Temperatures should average above normal. Brazil will get mostly dry conditions and warm temperatures. ICE certified stocks are lower today at 4.607 million bags. The ICCO estimates a production surplus of 52,000 tons this year, from 60,000 tons last estimate.

Chart Trends: Trends in New York are down with objectives of 2395 and 2285 December. Support is at 2405, 2390, and 2365 December, with resistance at 2455, 2505, and 2525 December. Trends in London are down with objectives of 1525 and 1470 December. Support is at 1610, 1600, and 1580 December, with resistance at 1660, 1670, and 1705 December.

See the original article >>

Stocks Secular Bull and Bear Markets

By: PhilStockWorld

Courtesy of Doug Short.Was the March 2009 low the end of a secular bear market and the beginning of a secular bull? Without crystal ball, we simply don’t know.

One thing we can do is examine the past to broaden our understanding of the range of possibilities. An obvious feature of this inflation-adjusted is the pattern of long-term alternations between up-and down-trends. Market historians call these “secular” bull and bear markets from the Latin word saeculum “long period of time” (in contrast to aeternus “eternal” — the type of bull market we fantasize about).

The key word on the chart above is secular. The implicit rule I’m following is that blue shows secular trends that lead to new all-time real highs. Periods in between are secular bear markets, regardless of their cyclical rallies. For example, the rally from 1932 to 1937, despite its strength, remains a cycle in a secular bear market. At its peak in 1937, the index was 29% below the real all-time high of 1929. For a scholarly study of secular bear markets, which highlights the same key turning points, see Russell Napier’s Anatomy of the Bear: Lessons from Wall Street’s Four Great Bottoms.

If we study the data underlying the chart, we can extract a number of interesting facts about these secular patterns (note that for the table below I am including the 1932-1937 rally):

The annualized rate of growth from 1871 through the end of July (using extrapolated CPI data for the most recent month) is 2.13%. If that seems incredibly low, remember that the chart shows “real” price growth, excluding inflation and dividends. If we factor in the dividend yield, we get an annualized return of 6.75%. Yes, dividends make a difference. Unfortunately that has been less true during the past three decades than in earlier times. When we let Excel draw a regression through the data, the slope is an even lower annualized rate of 1.74% (see the regression section below for further explanation).

If we added in the value lost from inflation, the “nominal” annualized return comes to 8.97% — the number commonly reported in the popular press. But for a more accurate view of the purchasing power of the market dollars, we’ll stick to “real” numbers.

Since that first trough in 1877 to the March 2009 low:

  • Secular bull gains totaled 2075% for an average of 415%.
  • Secular bear losses totaled -329% for an average of -65%.
  • Secular bull years total 80 versus 52 for the bears, a 60:40 ratio.

This last bullet probably comes as a surprise to many people. The finance industry and media have conditioned us to view every dip as a buying opportunity. If we realize that bear markets have accounted for about 40% of the highlighted time frame, we can better understand the two massive selloffs of the 21st century.

Based on the real (inflation-adjusted) S&P Composite monthly averages of daily closes, the S&P is 101% above the 2009 low, which is still 17% below the 2000 high.

Add a Regression Trend Line

Let’s review the same chart, this time with a regression trend line through the data.

This line is a “best fit” that essentially divides the monthly values so that the total distance of the data points above the line equals the total distance below. The slope of this line, an annualized rate of 1.74%, approximates that number. Remember that 2.13% annualized rate of growth since 1871? The difference is the current above-trend market value

The chart below creates a channel for the S&P Composite. The two dotted lines have the same slope as the regression, as calculated in Excel, with the top of the channel based on the peak of the Tech Bubble and the low is based on the 1932 trough.

Historically, regression to trend often means overshooting to the other side. The latest monthly average of daily closes is 66% above trend after having fallen only 11% below trend in March of 2009. Previous bottoms were considerably further below trend.

Will the March 2009 bottom be different? Only time will tell.

For a more optimistic view, see Chris Puplava’s February assertion that The Secular Bear Market in Stocks Is Over, over three months before the index hit a new all-time high. Chris’s commentary includes some interesting demographic analysis based on the ratio of the higher earning, bigger spending age 35-49 cohort to less financially empowered age 20-34 cohort. Unfortunately this ratio is being savagely trumped by a far more powerful demographic shift: The ratio of the elderly (65 and over) to the peak earning cohort (age 45-54). The next chart, based on Census Bureau historical data and mid-year population forecasts to 2050, illustrates this rather amazing shift.

The year 2013 is an inflection point in the chart above, with the elderly cohort dramatically increasing in numbers. The ratio of the two, the blue line in the chart, peaked in 2007 and began its long rollover in 2008, coincident with the beginning of the last recession. We have many years to go before this ratio approximately levels out around 2030.

Even more disturbing is the elderly dependency ratio, the label given by demographers to the ratio of the 65 and older population to the productive workforce, which for developed economies is usually identified as ages 20-64. The next chart illustrates the elderly dependency ratio with Census Bureau forecasts to 2050. Note that in this chart I’ve followed the general practice in demographic research of multiplying the percent by 100 (e.g., the mid-year 2013 elderly dependency ratio is 23.3% x 100 = 23.3).

As the chart painfully illustrates, the elderly dependency ratio is in the early stages of a relentless rise that doesn’t begin to level out until around 2036, over two decades from now. Given the unprecedented demographic headwinds for today’s investors, I’m unable to share the Chris’s confidence that the US is now in a new secular bull market.

Notes: For readers unfamiliar with the S&P Composite Index (a splice of historical data different from the S&P Composite 1500), see this article for an explanation.

Since the market data for this commentary is based on the monthly averages of daily closes, I should point out that the real (inflation-adjusted) all-time high in 2000 occurred in August 2000. The nominal daily-closing high in 2000 occurred on March 27th at 1,527.46, but that was an unusually volatile month, and the average of nominal daily closes for that month was much lower at 1,442.21. Inflation-adjustment to the latest dollar value puts that August all-time real high around 2,002.

See the original article >>

Drums Of War Spark Rally In Gold, Silver and Energy Prices

By: Hubert_Moolman

A potential bull market in commodities, precious metals and miners could accelerate higher if Congress gives Obama the approval to attack Syria based on the use of chemical weapons of mass destruction against innocent civilians. Commodities, energy, gold and silver are safe havens that usually rise in value during international conflicts and war. Remember the major breakout in gold after September 11th in 2001 and the invasion of Iraq in 2003. The ramifications of increased involvement in the Middle East could have a major impact on global trade. The tensions with Russia is increasing as Putin supports Assad.

Just 8 weeks ago in late June, I alerted my readers to a major buy signal in gold (GLD), silver (SLV), junior mining stocks (GDXJ) and energy (XLE). I was absolutely amazed at the investor euphoria in equities at the time and the pessimism in precious metals and commodities and predicted correctly that the concern about War in The Middle East will spark a rally in oil, gold, silver and the miners.
When no one was buying and in fact shorting precious metals and energy, I was one of the only writers who said at the time, "This instability in the Middle East and around the world means investors should look for assets that maintain value during chaotic times. Precious metals and energy could be one of the safest areas to hedge against rising Middle East turmoil." Now 8 weeks later gold has rallied $200, silver has gone up more than $6 and oil (DBO) is about to break through multi-year highs and could move to $150 a barrel. All over the headlines investors are scrambling for safe havens as the U.S. prepares to invade Syria. Don't forget Iran which may be advancing quickly towards having a nuclear weapon. We should remember that Assad is a proxy for Iran.
The interest in safe havens particularly gold, silver and the miners are reaching short term overbought levels as investors flee to safety. In the middle of the summer I wrote, "Do not be surprised to see gold and silver which are down over the past two years make a "V" shaped reversal shaking out all those who sold during this correction. Although I don't want chaos to happen, many savvy investors believe this possibility is growing, especially with oil now breaking $100. I believe now may be the best time to protect oneself with precious metals, energy and really cheap junior mining stocks."
Now eight weeks later, all the talking heads who were saying to short gold two months ago are scrambling back in. The U.S. may launch an attack as Syria's Assad is now using chemical weapons. An attack on Syria could accelerate the move in gold, silver and energy, which may continue to rally just based on inflationary concerns alone.
Short covering combined with new value investors looking to hedge with this sector has caused an explosive move. Some of the technical indicators are short term overbought so be prepared to use consolidations as buying opportunities. Housing numbers and economic indicators look weak and I expect the precious metals to surprise the market which may incorrectly predicting tapering from QE by the Fed in September. We may see a consolidation for a couple of weeks in precious metals and energy after rallying impressively before Labor Day, as investors wait for the Fed in the middle of September.
Look for a consolidation in precious metals as a potential buying opportunity. Precious metals and the miners (GDX) may rally after this meeting as the market realizes the Fed may not be so motivated to start tapering in September and as the Middle East continues to flare up with conflict.


Technically, gold is short term overbought and reaching resistance at $1425. A short term pullback to the 20 day ($1353) or 50 day (1310) which are now both rising and making a bullish crossover for the first time in many months, may be healthy and provide a secondary buy-point.

The Gold and Silver Index ($XAU) has rallied close to 30 points since June and is entitled to a breather. Don't panic if the $XAU pulls back to the 50 day around 97. The 20 day has made a bullish golden crossover with the 50 day which is also beginning to slope higher. This is very bullish and could mean a rally to the 200 day at $126 after breaking resistance at $115. The XAU is forming a bullish ascending triangle pattern which could predict a potential breakout and long term bullish reversal.

Silver is experiencing an explosive move of over $6 since the low in late June and is overbought so long term investors should look to add on healthy pullbacks to the 20 day ($22.16) or 50 day (20.63). I believe the major two year downtrend was broken this past month in early August and possibly after a healthy pullback silver could rally past the 200 day at ($26.26). Investors should also consider the silver miners (SIL) which are performing nicely. Silver is outperforming other commodities over this past three month rally. This may be a signal that we could once again see silver make a powerful move similar to 2010 when silver ran from $18 to around $50.

See the original article >>

Syria's Role in Critical Oil Supplies

By Kurt Cobb

I've been watching old episodes of The West Wing. In one sequence of shows, bombers kill two U.S. congressmen and a former chairman of the Joint Chiefs of Staff who are on a fact-finding mission to Gaza. Pressure mounts from both political parties in Congress, from the public and even from the president's own staff for a retaliatory military strike.

But the president doesn't like his options, and he delays. Violence will just beget more violence. Is there a way to bring the bombers to justice without killing innocent civilians and entangling the United States directly in the Israeli/Palestinian conflict as a combatant rather than a broker for peace?

Today, the real president of the United States has the opposite problem. He is getting pressure from many in Congress and the public NOT to make a military assault on Syria. Even the British Parliament rejected a call from Prime Minister David Cameron to join any U.S. military action in Syria. For obvious reasons, Americans are leery of involvement in yet another war in the Middle East. So, why is this president--the same one who opposed the Iraq war when he was a state senator in Illinois--drawing up plans for a military strike?

The ostensible reason is the use of chemical weapons by the Syrian military. President Obama called this heinous act a violation of "international norms." But in a war that has already taken 100,000 lives would "international norms" have been better observed if Syrian soldiers had simply gunned down everyone instead?

I believe that the Syrian regime's use of chemical weapons is merely a pretext for American intervention despite all the hoopla about the president's rather vaguely worded "red line" warning about chemical weapons to Syria last year. (Need I recount the simmering conflicts and resulting tragedies around the world in which the United States chose NOT to intervene?) One always suspects that oil is the real issue when it comes to the Middle East. So, let's see if that's the case here.

According to the U.S. Energy Information Administration (EIA) in 2010 before the civil war drove down oil production, Syria was the 34th largest oil producer in the world--behind Thailand, but just ahead of Vietnam. Syria's oil production of 367,100 barrels per day (bpd) represented about one half of one percent of world oil production--small in the overall picture. But it is more instructive to see what Syria's neighbors produce. (All oil production and ranking numbers are based on EIA figures for crude including lease condensate which is the definition oil.)

Oil producers in Syria's neighborhood ranked against all other countries in the world as of 2012 are as follows: Saudi Arabia (2nd, behind Russia), Iran (5th), Iraq (7th), Kuwait (8th), Egypt (25th), Turkey (54th), Israel (95th), and Jordan (96th). (In the age of jet warfare I am tempted to include the United Arab Emirates (8th) and Qatar (19th).) Turkey is more important than it seems because two major oil pipelines run through the country, one originating in Azerbiajan and the other originating in Iraq, that country's largest crude oil export line.

The general idea that Syria's neighbors hold the keys to a lot of oil certainly comes as little surprise to anyone with a cursory knowledge of the Middle East. But, the salient fact about the Syrian conflict is that it is a civil war. So, why is an American president so concerned about a war within the country?

That question leads to a second and even more salient fact. This civil war has now become a proxy for the Shia-Sunni split in the Muslim faith. Don't think: Catholics and Protestants in the United States. Rather think:Catholics and Protestants in Northern Ireland where a wide range of nonreligious issues sparked violence between the two groups for decades.

The split isn't just between countries that are predominantly Shia and predominately Sunni. It is, as Syria is showing, a split within many Arab nations which have citizens of both sects. So, there is not only the potential for conflict between nations in the Middle East, but also for the spread of civil unrest and civil war to other nations in the region. Iraq continues to demonstrate that this fear is not just hypothetical as bombings perpetrated in the name of minority Sunnis continue to vex a country which has experienced a long civil conflict between Shia and  Sunni after the U.S. invasion.

The spread of that kind of chaos would be very bad for oil supplies. Witness what has happened to Syrian oil production. It has fallen from 367,100 bpd in 2010 to just 157,200 bpd as of the end of last year. That's a decline of 57 percent in two years. That kind of decline in Middle East oil production would have catastrophic effects on an already iffy world economy, one absolutely dependent on oil for its smooth functioning.

The United States, as it turns out, has already been aiding the rebels for some time. The idea behind the aid may have been that the current regime might fall quickly, and the United States and its allies would have a solid relationship with those who take over.

With the stalemate continuing it's not obvious what strategy will work best to achieve America's number one goal in the region: stable oil production. One think tank academic even suggested that an ongoing stalemate was in America's best interests. Clearly, he doesn't believe the Shia-Sunni split will lead to conflict between or within other countries, at least on a scale that would prove troublesome.

But, there is one final consideration. After all we've been hearing about American energy independence, about growing domestic oil production, and about America being able to disengage from oil-exporting dictatorial regimes in the Middle East and elsewhere, the president seems as engaged as ever in the region.

There are three reasons for this: First, right now the United States imports just under half its oil needs. We produce a little over 7 million bpd and consume about 14 million bpd. Second, no realistic nonindustry assessment of future U.S. oil production suggests we'll stop needing substantial imports. Third, oil is traded in a world market, and its price is determined by world supply and demand. Any disruption in Middle Eastern oil supplies would lead to much higher prices which would ripple through the U.S. economy no matter how much we produce domestically.

The worldwide concern over Syria tells us that oil supplies remain tight and consuming nations remain very concerned about disruptions to supply. The oil price continues to hover near all-time highs when compared to the average daily price in 2011 and 2012, both record years. As the United States prepares plans for intervening militarily, there is not only much at stake in human terms, but also most assuredly in terms of critical oil supplies.

See the original article >>

Bombing for Morality

by Ian Buruma

NEW YORK – A gift for words was always US President Barack Obama’s strongest asset. Now it looks as if his words have trapped him.

This illustration is by Dean Rohrer and comes from <a href="http://www.newsart.com">NewsArt.com</a>, and is the property of the NewsArt organization and of its artist. Reproducing this image is a violation of copyright law.

Illustration by Dean Rohrer

Having stated in March that the United States would “not tolerate the use of chemical weapons against the Syrian people,” and having spoken last year about a “red line” that could not be crossed, he will lose face if he fails to react forcefully to the murder, allegedly by the Syrian regime, of more than 1,000 civilians by sarin gas. Of course, the risk of losing face is not a good reason for attacking another country.

But why did Obama fence himself in with such rhetoric in the first place? Why this particular red line? Secretary of State John Kerry was right to call the use of gas “a moral obscenity.” But so is torturing children, which is how the civil war in Syria actually began more than two years ago. And is killing civilians with chemical agents morally more obscene than shelling, shooting, or starving them to death?

At least since the use of mustard gas in World War I, it has been a common assumption that certain weapons are more immoral than others. Weapons of mass destruction, nuclear bombs in particular, certainly cause more damage faster than conventional armaments do. But is there really a clear moral distinction between killing roughly 100,000 people in Hiroshima with one atom bomb and killing even more people in Tokyo in a single night of incendiary bombing? Was it more immoral to gas Jews than to machine-gun them into open pits?

There is an argument, made by Nicholas Kristof in the New York Times, that a swift punishment might persuade Syrian President Bashar Al-Assad to stop using chemical weapons and use “more banal ways to slaughter his people.” This does not make sense to me. The problem is surely the slaughter, not the methods used.

In any case, moral outrage, however justified, is not a sufficient reason for going to war. Mao Zedong was responsible for the deaths of more than 40 million Chinese in the 1950’s and 1960’s. No one in his right mind suggested that military intervention in China would be a good idea. In the 1980’s, Saddam Hussein gassed hundreds of thousands of Iranians and Kurds. The US supported him.

So is it a legal issue? Using chemical weapons is indeed a breach of international conventions, including the Chemical Weapons Convention, which Syria has never signed, and the Geneva Protocol, to which it is a party. So there are good reasons to treat Assad as a war criminal, in which case he should be indicted at the International Criminal Court (ICC) – established, incidentally, by a treaty that the US has never ratified. But bypassing the United Nations and unleashing an illegal war to punish an illegal act is not an easy policy to defend.

Still, one might say, surely the “international community,” or the West, or the US as the major Western power, must draw the line somewhere. How can responsible governments simply look away when innocent people are being killed in large numbers? Tolerating genocide is intolerable.

But where exactly do we draw that line? How many murders constitute genocide? Thousands? Hundreds of thousands? Millions?

Or is it not a question of numbers? Genocide, after all, is a matter of intent, of killing or persecuting people on the grounds of their race, ethnicity, or creed. Technically, killing ten people for such reasons – or even two – could be a form of genocide.

There is another way of considering the matter. The question to ponder before intervening with force in another country is whether doing so is likely to improve matters, save lives, and make the world more secure. Yes, violence against citizens, whether by sarin gas or helicopter gunships, is a moral obscenity. The issue is how to respond: What will work?

Justice and morality have little to do with this. Like the ICC, “humanitarian intervention” has more chance of working in the case of a weak country (say, Serbia, Mali, or Sierra Leone) than where a big power is involved. No one is going to shoot missiles into China or Russia for the sake of upholding human rights or international standards of warfare.

Syria, as many people have pointed out, is not Libya or Mali. Nor is it a great power. But its civil war has already spread beyond its borders, implicating greater powers like Iran, Turkey, and Russia in the process. One thing worse than the moral obscenities of a civil war would be a regional conflagration.

It is by no means certain that US intervention would do anything to reduce the risk of a wider war. In fact, certain advocates of US intervention – both neo-cons and “liberal hawks” – seem to desire the opposite outcome; they want a war against Iran. And there is probably a clear link in Obama’s mind between the red line in Syria and the one he has drawn for Iran, perhaps equally unwisely, to prevent it from developing nuclear weapons.

So what is to be achieved by a US strike on Syrian targets, which Obama has already assured the world is not meant to change the Syrian regime? It will not stop the civil war. But even one missile would turn the US into a direct participant, provoking yet more violence. Saving Obama’s honor hardly seems worth that risk.

This is the view of many people in Syria, even among the rebels. It is the view of most people in Europe. It is also the view of most people in the US. Perhaps it is even the view of Obama himself, which is why he is playing for time, desperately turning over approval of an attack on Syria to the US Congress. His relations with Congress have been far from smooth. But now he needs it more than ever – in order, as they say in America, to cover his ass.

See the original article >>

The Price of Peace

by Shlomo Ben-Ami

MADRID – The relationship between peace and justice has long been the subject of polarizing debates. Some argue that the pursuit of justice impedes conflict-resolution efforts, while others – including International Criminal Court (ICC) Chief Prosecutor Fatou Bensouda – contend that justice is a prerequisite for peace. As President Juan Manuel Santos leads Colombia through the most promising peace talks in five decades of brutal conflict with the Revolutionary Armed Forces of Colombia (FARC), he will have to consider this question carefully.

This illustration is by Paul Lachine and comes from <a href="http://www.newsart.com">NewsArt.com</a>, and is the property of the NewsArt organization and of its artist. Reproducing this image is a violation of copyright law.

Illustration by Paul Lachine

The Nuremberg trials, which followed Nazi Germany’s unconditional surrender in World War II, provide an ideal model for post-conflict justice. But, in conflicts in which no side has been defeated, the peacemaker’s job becomes more challenging. Given what is at stake, a trade-off between reconciliation and accountability may well be inescapable.

Since 1945, more than 500 cases of amnesty in post-conflict transitions have been recorded; since the 1970’s, at least 14 states – including Spain, Mozambique, and Brazil – have given amnesty to regimes guilty of serious human-rights violations. In South Africa, amnesty was a key feature of the “truth and reconciliation” process that facilitated the peaceful transition from more than four decades of white-minority rule to democracy.

Similarly, in 2003, Nigeria’s president offered asylum to his Liberian counterpart, Charles Taylor, on the condition that Taylor retire from politics, thereby helping to end the rebellion against him. (In this case, justice was later served; in 2012, the ICC convicted Taylor of 11 counts of aiding and abetting war crimes in Sierra Leone, making him the first former head of state to be convicted for such crimes by an international tribunal since Nuremberg.)

Although it may be painful to offer a safe exit to war criminals and human-rights abusers, the prospect of ending the suffering of civilians can take priority over a principled stand for justice. Who today would oppose amnesty for Syrian President Bashar al-Assad if it ended the brutal civil war that has led to more than 100,000 deaths and created nearly two million refugees (including more than a million children) in just two years?

This is precisely the dilemma that Santos now faces. Given the innumerable atrocities that the FARC have committed, the prospect of suspending punishment is difficult to accept. But prolonging a conflict that has already led to more than 200,000 deaths and displaced roughly five million people is in no one’s interest.

With Colombia’s recent accord on agrarian reform having resolved the conflict’s root cause, the question of transitional justice has become the determining factor in whether the peace process will succeed. If impunity for perpetrators of crimes against humanity, however morally repugnant, could protect potential future victims by ending the conflict, accepting such an outcome may well be worth sacrificing a full measure of justice for past victims.

Rather than launching an uncompromising campaign to defeat the insurgents, Santos has pursued the more politically challenging course: a negotiated settlement. This suggests a willingness to do whatever it takes to protect long-suffering rural communities from continued violence.

Santos would certainly not be the first head of state to go silent on accountability. In 2003, the United States and the European Union acquiesced to an accord that formally ended the Democratic Republic of the Congo’s civil war, which had claimed nearly four million lives, though the agreement lacked provisions to hold war criminals accountable. The same is true for Sudan’s 2005 Comprehensive Peace Agreement, which ended a 22-year civil war in which more than two million died.

In these cases – as in Colombia today – a fundamentalist approach to transitional justice was not feasible. Rather, justice had to be applied according to the specific political conditions that brought about the transition. After all, transitional justice is essentially a political solution, a historic contract of national reconciliation – not a strictly judicial matter.

For Santos, reconciling peace and justice in a complicated domestic political context may require alternative formulas, such as reduced sentences, community penalties, conditional verdicts, or asylum in third countries. But none of these options, let alone amnesty, should be allowed unless the demobilized insurgents cooperate fully with the courts, including by disclosing all of their crimes.

Following this logic, FARC leader Pablo Catatumbo has acknowledged the “pain and acts of cruelty” that the guerillas have committed and has requested a collective pardon that would cover human-rights violations committed by both the FARC and state security forces. He has also insisted on the identification and compensation of victims as a prerequisite for peace and national reconciliation.

When conflict-resolution efforts are on the line, a single-minded quest for retribution often is the wrong option. Archbishop Desmond Tutu, a leader of South Africa’s democratic transition, has described an alternative – restorative justice – that focuses on “the healing of breaches, the redressing of imbalances, [and] the restoration of broken relationships.” With this constructive, forward-looking understanding of justice in mind, Santos, too, can succeed, thereby securing the peaceful, secure future that Colombians deserve.

See the original article >>

Calling Off America’s Bombs

by Jeffrey D. Sachs

NEW YORK – As the US Congress considers whether to authorize American military intervention in Syria, its members should bear in mind a basic truth: While Syrian President Bashar Al-Assad has repeatedly used extreme violence to retain power, the United States – and other governments in the Middle East and Europe – share responsibility for turning Syria into a killing field.

This illustration is by Tim Brinton and comes from <a href="http://www.newsart.com">NewsArt.com</a>, and is the property of the NewsArt organization and of its artist. Reproducing this image is a violation of copyright law.

Illustration by Tim Brinton

These governments, led by the US, have explicitly sought the violent overthrow of Assad. Without their involvement, Assad’s regime would most likely have remained repressive; with their involvement, Syria has become a site of mass death and destruction. More than 100,000 people have died, and many of the world’s cultural and archaeological treasures have been demolished.

Syria’s civil war has occurred in two phases. The first phase, roughly from January 2011 until March 2012, was largely an internal affair. When the Arab Spring erupted in Tunisia and Egypt in January 2011, protests erupted in Syria as well. In addition to the usual grievances under a brutal regime, Syrians were reeling from a massive drought and soaring food prices.

The protests became a military rebellion when parts of the Syrian army broke with the regime and established the Free Syrian Army. Neighboring Turkey was probably the first outside country to support the rebellion on the ground, giving sanctuary to rebel forces along its border with Syria. Although the violence was escalating, the death toll was still in the thousands, not tens of thousands.

The second phase began when the US helped to organize a large group of countries to back the rebellion. At a meeting of foreign ministers in Istanbul on April 1, 2012, the US and other countries pledged active financial and logistical support for the Free Syrian Army. Most important, then-Secretary of State Hillary Clinton declared: “We think Assad must go.”

That open-ended statement, without any clear means to achieve the goal that it announced, has done much to fuel military escalation and the rising death toll in Syria, while pushing the US repeatedly to defend its “credibility” against a line in the sand that it should not have drawn.

Then and now, the US has claimed to speak in the interest of the Syrian people. This is very doubtful. The US views Syria mainly through the lens of Iran, seeking to depose Assad in order to deprive Iran’s leaders of an important ally in the region, one that borders Israel. The US-led effort in Syria is thus best understood as a proxy war with Iran – a cynical strategy that has contributed to the massive rise in violence.

The US government’s misguided move from potential mediator and problem solver to active backer of the Syrian insurrection was, predictably, a terrible mistake. It put the US in effective opposition to the United Nations peace initiative then being led by former UN Secretary-General Kofi Annan, whose approach was to call for a ceasefire followed by a negotiated political transition. The US preempted this process by backing the military rebellion and insisting on Assad’s immediate departure.

It is hard to understand this blunder. Even if the US ultimately sought to force Assad from office, its blunt action hardened Assad’s resistance, as well as that of his two allies in the UN Security Council, Russia and China. Aside from seeking to defend their own interests in the region, both countries understandably rejected the idea of US-led regime change in Syria. Russia argued that America’s insistence on Assad’s immediate departure was an impediment to peace. In this, Russia was right.

Indeed, Russia was playing a plausibly constructive role at the time, albeit one premised on Assad remaining in power for at least a transitional period, if not indefinitely. Russia sought a pragmatic approach that would protect its commercial interests in Syria and its naval base at the port of Tartus, while bringing an end to the bloodletting. The Russians openly backed Annan’s peace initiative. Yet, with the US and others financing the rebels, Russia (and Iran) supplied more – and more sophisticated – weapons to the regime.

Now, with the use of chemical weapons, probably by the Syrian government (and possibly by both sides), the US has again ratcheted up the stakes. Bypassing the UN once again, the US is declaring its intention to intervene directly by bombing Syria, ostensibly to deter the future use of chemical weapons.

America’s motivations are not entirely clear. Perhaps there is no underlying foreign-policy logic, but only carelessness. If there is a kind of logic, however weak, it seems to revolve around Iran and Israel, rather than Syria per se. There are many dictatorships in the world that the US does not try to overthrow. On the contrary, many of them are ostensibly America’s close allies. So why does the US continue to back a deadly rebellion in a civil war that is continuing to escalate dangerously, now to the point of chemical-weapons attacks?

To put it simply, President Barack Obama’s administration has inherited the neoconservative philosophy of regime change in the Middle East. The overriding idea is that the US and its close allies get to choose who governs in the region. Assad must go not because he is authoritarian, but because he is allied with Iran, which, from the perspective of the US, Israel, Turkey, and several Gulf countries, makes him a regional threat.

In fact, the US has probably been lured into serving these countries’ own narrower interests, whether it be Israel’s unconvincing vision of its own security or the Sunni countries’ opposition to Shia Iran. But, in the long term, US foreign policy divorced from international law cannot produce anything other than more war.

The US should reverse course. A direct US attack on Syria without UN backing is far more likely to inflame the region than it is to resolve the crisis there – a point well appreciated in the United Kingdom, where Parliament bucked the government by rejecting British participation in a military strike.

Instead, the US should provide evidence of the chemical attacks to the UN; call on the Security Council to condemn the perpetrators; and refer such violations to the International Criminal Court. Moreover, the Obama administration should try to work with Russia and China to enforce the Chemical Weapons Convention. If the US fails in this, while acting diplomatically and transparently (without a unilateral attack), Russia and China would find themselves globally isolated on this important issue.

More broadly, the US should stop using countries like Syria as proxies against Iran. Withdrawal of US financial and logistical support for the rebellion, and calling on others to do the same, would not address Syria’s authoritarianism or resolve America’s issues with Iran, but it would stop or greatly reduce the large-scale killing and destruction in Syria itself.

It would also enable the UN peace process to resume, this time with the US and Russia working together to restrain violence, keep Al Qaeda at bay (a shared interest), and find a longer-term pragmatic solution to Syria’s deep domestic divisions. And the search for a US modus vivendi with Iran – where a new president suggests a change of course on foreign policy – could be revived.

It is time for the US to help stop the killing in Syria. That means abandoning the fantasy that it can or should determine who rules in the Middle East.

See the original article >>

Pricing of VIX August and September Calls

by Bill Luby

The monthly VIX futures and options expiration is a fascinating time from an options strategy perspective, as it marks the point in time in which VIX futures prices collide with the cash/spot VIX. Thanks to the VIX Special Opening Quotation (SOQ), that price collision is an inexact one, but for all practical purposes, the VIX front month futures and cash/spot index converge once every month, just after the open on a Wednesday thirty days before the standard monthly option in the S&P 500 Index options the following month.

To make things more interesting, the last day of trading for the front month VIX futures and options is the Tuesday session just prior to expiration.

All these product attributes make it difficult to navigate the complex waters of the VIX product platform just prior to expiration, but because the VIX is capable of such sudden sharp moves [see VIX All-Time Spike #11 (and a treasure trove of VIX spike data) for some details,] options prices have to include the possibility of a sudden VIX spike right up until the moment of expiration.

For these reasons, it is sometimes possible to sell VIX options for a surprisingly high premium right before expiration. In the graphic below, I have captured some data from the TD Ameritrade/thinkorswim platform that shows the prices of various VIX calls as of about 2:00 p.m. ET that expire tomorrow, with just more than two hours of trading left in these products. For comparison purposes, I have also included the September options for the same strikes, which will expire on September 18th.  For the record, at the time of this snapshot, the VIX was at 14.48 and the August VX futures (now available on the TD Ameritrade/thinkorswim platform as ticker /VXQ3) were at 14.43.

Note that the TD Ameritrade/thinkorswim platform includes information on the implied volatility calculated for these VIX calls as well as the estimated probability that these will expire out-of-the-money on September 18th. Theoretically at least, the VIX August 25 calls have a more than 1% of expiring in-the-money at tomorrow’s open, while there is more than a 5% chance that the VIX September 25 calls will expire in-the-money. With an implied volatility of 139%, the VIX September 25 calls are currently bid-ask at 0.25 – 0.30.

I am not recommending selling VIX calls just prior to expiration and I certainly would want anyone who is interested in these type of trades to start out with defined risk trades (e.g., bear call spreads) before considering trades with unlimited risk...but the possible trading opportunities are fascinating, to me at least.

[source(s): TD Ameritrade/thinkorswim]

For those interested in additional background on the VIX expiration and some potential trade ideas, the posts below should provide a good jumping off point.

See the original article >>

BofAML Warns Of 'Deeper Downside Risk' To June Lows (S&P 1560)

by Tyler Durden

Last week's 90%-down day and TRIN (market-breadth) above 2.0 provided the ammunition for an oversold bounce but as BofAML notes, there is plenty of resistance to limit upside. With 1658 as critical resistance (S&P 500 cash traded 1651 this morning), the following charts show the weight of evidence suggests deeper downside risk to the June lows around 1560.

Via BofAML,

Notwithstanding the rebound from last week’s low, we remain cautious on US equities given bearish readings and/or divergences for the Net Tab, Volume Intensity Model, new 52-week highs, daily and weekly momentum...

And the Negative divergence for % of NYSE stocks > 200dmas

The % of NYSE stocks above their 200-day moving averages has a strong bearish divergence similar to the divergences that preceded pullbacks in mid-2010 and mid to late 2011. This points to diminishing momentum for market breadth

The big downside gap is an overhang...

Margin debt is still contrarian bearish...

The March 2000 peak in NYSE margin debt of $278.5m preceded the August 2000 monthly closing price peak in the S&P 500 at 1517.68. The July 2007 margin debt peak of $381.4m preceded the October 2007 monthly closing price peak of 1549.38 for the S&P 500. Margin debt reached a record high of $384.4m in April and the S&P 500 continued to rally into July/August. This is a similar set up to 2007 and 2000.

Margin debt: the long-term overlay

Going back to January 1959, margin debt and the S&P 500 have moved together for the most part. But leverage is a double edge sword and can exacerbate selloffs, leading to deeper than expected market pullbacks.

  • Margin debt and the S&P 500 have moved together for the most part since 1959.
  • Margin debt formed higher lows as the S&P 500 formed lower lows at the 1974 and 2009 generational lows – in our view this supports the case that the 2009 low is a generational low that does NOT need to be retested.
  • Margin debt broke out in 1977, which was well ahead of the S&P 500 breakout in 1980.
  • Margin debt contracted as the S&P 500 pulled back into the 1982 low.

In addition, seasonals...

Going back to 1928 September is the weakest month of the year and is down 60% of the time with an average drop of 1.1%.

... and the Presidential Cycle are positioned to become a market headwind moving into September

If the US equity market continues to follow the Presidential Cycle, the risk is for lackluster returns in the last four months of 2013 and well into 2014, which is the mid-term election year. Based on the cycle, a strong bottom and rally occur after the mid-term year low. This low tends to form in September of the mid-term year.

2013 has followed the front-end loaded Presidential Cycle Year 1 Pattern. This pattern calls for a July/August peak in Year 1 (2013) ahead of a pullback into September of Year 2 (2014) or the Midterm year.

The September Year 1 through September Year 2 period is the weakest part of the Presidential Cycle. The average decline over this 13-month period is 4.31% vs. an average 13-month period return for the S&P 500 of 8.0% going back to 1928.

And with the plethora of headline-positive macro data recently, the Fed is losing its ability not to Taper even in the face of a market decline.

See the original article >>

Triple Bottom

By Tothetick Education

The Triple Bottom is a reversal price pattern & while not as common as the smaller Double Bottom it is seen in all markets, instruments, time frames, & price ranges. It presents with the immediate background environment as bearish with down-trending price action. The price pattern represents multiple failed attempts by sellers to break through an area of support and traders look for price to bounce back up. The classic Triple Bottom can be an indication that the established downtrend is losing strength & buyers may be gaining momentum possibly creating the end of the decline in prices. The Triple Bottom Reversal usually marks an intermediate or long-term change in trend & is therefore considered to have a definite bullish bias.

Visually the Triple Bottom pattern presents three consecutive minimums in price, ‘valleys or troughs’ that are roughly equal with the requirement of 2 moderate peaks or swing highs in-between. The price level of the highest swing high establishes what is called a ‘neckline’ & creates the immediate resistance for the pattern. Typically as this pattern develops overall volume levels usually decline. After a 3rd effort traders will look for an expansion of volume from the bulls to note conviction. The longer the pattern develops, the more significant the expected break.

Throughout development of the Triple Bottom traders should be prepared for the pattern to possibly resemble a number of other patterns before the third bottom forms. The ‘spirit’ of the pattern highlights a battle between buyers & sellers & it may take some time & not look perfect. Ultimately the ‘final’ picture is not complete until a confirmed breakout has cleared resistance…regardless of the ‘shape’. The inability to break support is bullish but the bulls have not won the battle until resistance has been broken.

Note that in the downtrend there may be many potential bottoms in price along the way down, but until significant resistance is broken, a reversal cannot be confirmed & traders should respect the trend.

Key points to formation:
  1. Background: price action trending Down
  2. 1st trough: marks lowest price point in the current trend
  3. 1st swing high effort: buyers step in & advance price typically to a significant price area also seen in the background downtrend action. This 1st effort establishes the immediate overhead resistance & defines a ‘neckline’. Volume on the advance is often large holders taking profits (‘buy to cover’) & may be inconsequential, but an increase could also signal early accumulation.
  4. 2nd trough: the decline off the resistance usually occurs with lighter volume. Support at the previous low is the expectation & aggressive traders will look at volume activity for early signs from the bulls. Note that there is NO confirmation of a reversal of trend at this point. The time period between troughs can vary but typically they are in-line with the symmetry of the instrument of choice. The 2nd low may offer a perfect double bottom in price but the ‘textbook’ range for price is acceptable within 3% of the 1st trough price.
  5. Advance from 2nd trough: Traders are looking for volume & buying pressure with the lack of sellers to accelerate off of the 2nd trough. The type of activity seen in volume during the effort back to resistance is an indication of strength or weakness. Note that often traders participate with this Double Bottom Pattern & watch prices run right back into resistance instead of getting a breakout. Or it is also quite common for prices to break through the 1st swing high price but then fail to advance much further. Therefore to be a Triple Bottom Reversal the pattern must have a minimum of 3 swing low efforts creating support & 3 swing high efforts creating resistance.
  6. 3rd trough: the decline off the resistance usually occurs with even lighter volume. Support at the previous lows is the expectation & aggressive traders will look at volume activity for early signs from the bulls. Note that there is NO confirmation of a reversal of trend at this point. The time period between troughs can vary but typically they are in-line with the symmetry of the instrument of choice. Seldom is this 3rd low price exactly equal to the previous 2 swing lows of the pattern. How close is close enough is a trader’s nuance to choose while remembering the ‘spirit’ of the pattern as a guideline. Volume ‘thrusts’ are common.
  7. Advance from 3rd trough: Traders are looking for volume & buying pressure with the lack of sellers to accelerate off of the 3rd trough. And again the type of activity seen in volume during the effort back to resistance is an indication of strength or weakness & becomes more important with each subsequent effort.
  8. Resistance break: even after trading back up to resistance a trend reversal is not complete. Breaking the resistance of the highest swing high price effort of the pattern & with conviction seen in volume completes the Triple Bottom Reversal.
  9. Resistance turns into support: broken resistance becomes potential support. Often but not always, there is a test of this newly created support & this effort offers a final consideration for a long entry into a potential change of trend.

While this pattern is fairly straightforward it should be noted that traders often ‘jump the gun’. Not all repeated lows produce a change of trend & traders need to remember that the trend is in force until proven otherwise. Bottom formations can take some time and patience is often a virtue. If a trader will give the pattern time to develop and look for the proper clues & then follow the guidelines, this chart pattern can be well-worth the effort to identify & trade.

Options for Trading the Triple Bottom as a bullish reversal pattern:

There are 4 methods of trading this pattern & it depends on your trading style.

Most Aggressive traders will be looking for the 3rd trough in price as soon as the first 2 troughs show buyer support & the swing highs are in place. As the action comes back to re-test this low support area aggressive traders will be diligently monitoring the volume action looking for clues to the buying pressure. Entries in this area can work with a stop placement just below the lowest low of the formation. Aggressive traders should be prepared for capitulation selling or ‘dump & run’ type price action.

Aggressive traders may wait until a 3rd swing low is made & then monitor the action thru the middle of the reverse pattern. The concept of this option is to identify the reversal price action as being contained in a support/resistance ‘box’. Traders monitor the middle ‘muddy trench’ or roughly 50-50 of the spread in price offered by the pattern for an entry once the bulls control. Stop placement can be fairly tight just below the trench zone. An additional option to add to this set up is to include waiting for 3 solid efforts on resistance & then consider the muddy trench zone entry. This can be an accurate trade offering an entry looking to capitalize on a breakout & potentially a new bullish trend but without the risk of the most aggressive option.

Classic traders will look for a long entry with the breakout of the neckline or immediate pattern resistance. Stop placement right below the neckline price.

Conservative traders will watch the breakout & look for a re-test of that new breakout support price to hold for full confirmation of the Triple Bottom Reversal Pattern. Stop placement right below breakout price. Note that this method of waiting for this pullback may or may not offer an opportunity but statistically it has a high % of success when it does present.

The aggressive trading methods can highly increase the profit potential of any Triple Bottom & may offer more than one entry. However, the trader needs to assess whether the ‘extra’ profits choosing an earlier entry offers a decent risk:reward over waiting for some confirmation of action based on clearing a defined price resistance. Traders choosing these options should look for strength from buyers in combination with the lack of sellers. It cannot be stressed enough that volume is a major key & an expansion of bullish volume aids confirmation.

False breakouts do happen & confirmation needed is always a traders’ choice. Several methods that apply here for either intrabar &/or close bar options offered in sequence: breakout above resistance price, retrace holds new support line, price clears breakout swing high price, price clears next swing high of background downtrend price action, larger chart combination.

Stop placement considerations for all trade entry choices can be aggressively raised after the breakout of the price.

Measured Move Target based on structure of the Triple Bottom Reversal Pattern
  • Triple Bottom Pattern measure (added to) BreakOut price = target
  • Triple Bottom Pattern measure = (swing high price of pattern (minus) swing low price of pattern)

Since the Triple Bottom Reversal Pattern once confirmed has such a high degree of success indicating a change of trend, there are additional target considerations based on the knowledge that history repeats. All traders can look for tests on each of the swing highs seen in the immediate background downtrend price action. At any point & for all of these options, traders should gauge the continued conviction of the bulls based on momentum. If momentum is strong stick with the trade, if they get ‘lazy’ then consider taking profits & possibly look for a re-entry.

Examples: Triple Bottom Reversal Pattern

TTTtri bot June 21 es 1m final TTTtribot aug 13 cl 1m final

See the original article >>

Head & Shoulders Nuances

By Tothetick Education

The Head & Shoulders is a powerful reversal price pattern seen in all markets, instruments, time frames, & price ranges.  A completed Head & Shoulders reversal price pattern usually marks an intermediate or long-term change in trend.

Visually the Head & Shoulders patterns resemble a head with 2 shoulders right side up or upside down. The Spirit of any Head & Shoulders price pattern represents multiple efforts to break through an area of control & when it fails then traders look for price action to start trending in the opposite direction, completing the definition of a reversal. The textbook calls for 3 efforts & for the pattern to be somewhat symmetrical in it's appearance. This 'perfect' set up does happen but traders will also see numerous variations.

Please note: a full video review of each pattern independently is offered on the website with a text description and chart examples. This video is meant to be a supplemental review for these very powerful patterns.

This video includes both the Head and Shoulders Top & Bottom patterns & the objectives are:
  1. a 'cliff notes' perspective of the Spirit of a Head & Shoulders reversal
  2. a review of numerous nuances for the Head & Shoulders reversal
  3. quick look at numerous charts - various time frames & instruments

Learning the volume patterns inside the structure of a Head & Shoulders Reversal is of the utmost importance. These patterns represent a 'duel' between buyers & sellers and a fight for control of where price will go next. For this reason I offer study materials in different versions. Please see the fully annotated charts offered on the website for these patterns independently as they were part of this video review. Then as further study material I have also offered 10  'clean' unmarked charts of different instruments & time frames for your further study with this post. The more exposure to the concept with the different variations will help train a trader's mind to see these patterns. In addition there is also a bar by bar real chart data video review of a Head and Shoulders Top Reversal pattern in the Library , video #3.

Head & Shoulders Reversal pattern variations unmarked chart examples:

cl aug 9 H&s 1m feb 19 H&S 15m es feb 26 es 3m H&S May 15 1m es H&S or June 25 1m cl InvH&S April 17-22 5mES June 3 es 3m multi H&S June 4 es 1m pp TTT inv H&S Nov 16 5m es TTT july 24 dbl top 6e 3m

See the original article >>

America's Energy Boom and the Rising U.S. Dollar

by Charles Hugh Smith

The energy boom directly reduces the number of U.S. dollars being supplied to the global economy, and that pushes the value of the dollar higher.


The petrodollar regime--that oil is bought and sold globally in U.S. dollars--is easy to understand. It boils down to these two principles:

1. Petroleum is the lifeblood of the global economy.

2. Any nation that can print its own currency and trade the conjured money for oil has an extraordinary advantage over nations that cannot trade freshly created money for oil.

This is why many analysts trace much of America's foreign policy back to defending the petrodollar regime. In the normal course of things, anyone printing money in quantity would soon find the conjured currency bought fewer and fewer barrels of oil as the surplus of conjured currency floating around the world greatly exceeded the supply of oil.

Currency can be conjured out of thin air, but oil is increasingly costly to find, extract and process.

America's energy boom is creating consequences for the value of the dollar. As I have explained here a number of times, this goes back to Triffin's Paradox, which states that when one nation's fiat currency is used as the world's reserve currency, the needs of the global trading community are different from the needs of domestic policy makers.

What Will Benefit from Global Recession? The U.S. Dollar (October 9, 2012)

Understanding the "Exorbitant Privilege" of the U.S. Dollar (November 19, 2012)

Prior to 1971, the dollar was backed by gold, which acted as a supra-national anchor to the dollar's reserve status. The gold standard inhibited both massive trade deficits and money creation, so it was jettisoned.

The Triffin paradox is a theory that when a national currency also serves as an international reserve currency, there could be conflicts of interest between short-term domestic and long-term international economic objectives. This dilemma was first identified by Belgian-American economist Robert Triffin in the 1960s, who pointed out that the country whose currency foreign nations wish to hold (the global reserve currency) must be willing to supply the world with an extra supply of its currency to fulfill world demand for this 'reserve' currency (foreign exchange reserves) and thus cause a trade deficit. (emphasis added)
The use of a national currency (i.e. the U.S. dollar) as global reserve currency leads to a tension between national monetary policy and global monetary policy. This is reflected in fundamental imbalances in the balance of payments, specifically the current account: some goals require an overall flow of dollars out of the United States, while others require an overall flow of dollars in to the United States. Net currency inflows and outflows cannot both happen at once.

In other words, the U.S. must "export" U.S. dollars by running a trade deficit to supply the world with dollars to hold as reserves and to use to pay debt denominated in dollars. If the trade deficit shrinks, fewer dollars are available for reserves and to service debt denominated in dollars.

Basic supply and demand will push the dollar higher relative to other currencies and eventually, other assets.

One reason why the trade deficit is shrinking is the U.S. is supplying more of its own energy. Every unit of petroleum extracted in the U.S. means a unit does not have to be imported from oil exporting nations.

The energy boom directly reduces the number of dollars being supplied to the global economy. This creates a relative scarcity of dollars, which pushes the value of the dollar higher:


Is it coincidence that the dollar's uptrend aligns with the rise of U.S. energy production? It's not coincidence, it's causation.

Oil prices have broken out of a technical wedge:


As global oil prices push higher, more previously marginal petroleum reserves in the U.S. and Canada become profitable, further boosting production. The more energy produced in the U.S., the smaller the trade deficit and the fewer dollars provided to the global economy.

As the dollar strengthens, the U.S. will pay less for imported energy and earn more for exported energy. This decline in energy costs will ripple through the real economy, offsetting any decline in exports. A strengthening dollar lowers the cost basis of all goods and services originating in the U.S.

A strengthening dollar also benefits trading nations, as the increasing value of their dollar reserves enlarges the base for their own credit. This is the irony of China's dumping of its dollar reserves: China only amassed such massive dollar reserves because it was running equally massive trade surpluses with the U.S. As the trade surplus shrinks, so too must China's dollar reserves contract.

Many observers confuse the dollars created by the Federal Reserve with the dollars available to trading nations for reserves and dollar-denominated debt. If the Fed creates $1 trillion which then lays fallow in the U.S. financial system, those dollars are not exported into the global economy via trade deficits.

Add all this up and it's clear America's energy boom will push the dollar higher as the trade deficit shrinks and those needing dollars on the global market will have to pay more for to get the dollars they need for reserves and payment of dollar-denominated debts.

See the original article >>

Natural Gas breakout…Large bullish inverse head & shoulders in play?

by Chris Kimble

CLICK ON CHART TO ENLARGE

Natural Gas ETF (UNG) fell 30% from it April highs to its early August lows, as it hit the bottom of of the falling channel above. Now UNG is breaking above resistance of the falling channel above.

Since August the 7th, the inset chart reflect UNG has gained 9% more than SPY.

Why is Natural Gas doing well and could their be more to come?

CLICK ON CHART TO ENLARGE

The above chart was sent to Premium & Sector/Commodity Sentiment Extreme members on almost a month ago.

The chart was sent at the lows in Natural Gas, reflecting it was on support with only 22% bulls and could be forming a very large bullish inverse head & shoulders pattern.

If you could benefit from Energy/Natural Gas or Commodity research like this (at extremes), I would be honored to have you as a member.

See the original article >>

Gold bulls increase positions to highest since January

By Joe Richter

Hedge funds and other speculators are making the biggest bet on a gold rally since January as mounting signs that the U.S. will lead a military strike against Syria drove prices to a three-month high.

Money managers boosted their net-long position by 34% to 97,902 futures and options by Aug. 27, the most since Jan. 22, U.S. Commodity Futures Trading Commission data show. Holdings of short contracts tumbled 37% to 32,088, the biggest drop in 11 months. Net-bullish holdings across 18 U.S.- traded commodities climbed 18% to 824,251, the highest since February.

Gold, down 28% (COMEX:GCZ13) from the record set two years ago after some investors lost faith in the metal as a store of value, climbed for four weeks as the rout spurred demand for coins, bars and jewelry. Prices gained 6.3% in August, and U.S. equities fell the most in more than a year, as western nations debated a response to alleged chemical-weapons use in Syria. That increased concern about disruptions to Middle East oil supply that would raise energy costs and stoke inflation.

“Investors have sobered up with their perceptions of gold,” said Michael Cuggino, who manages $12 billion of assets at Permanent Portfolio Family of Funds Inc. in San Francisco. “You have people talking about it as an investment again. Physical demand never really tailed off.”

Gold Climbs

Gold climbed 30 cents to $1,396.10 an ounce on the Comex in New York last week. Twenty-three analysts surveyed by Bloomberg expect prices to rise this week. Six were bearish and five neutral, leaving the highest proportion of bulls since March 8. Futures were down 0.3% at $1,392 today.

The Standard & Poor’s GSCI Spot Index of 24 commodities gained 2.9% last month. The MSCI All-Country World index of equities dropped 2.3%, while the S&P 500 tumbled 3.1%, the most since May 2012. The Bloomberg Dollar Index, a gauge against 10 major trading partners, gained 0.8% and the Bloomberg U.S. Treasury Bond Index slid 0.8%. Commodities beat equities, bonds and the dollar for a third month, the longest winning streak in two years.

President Barack Obama said Aug. 31 he will seek congressional authorization to use military force against Syrian regime targets once Congress returns from its recess. The administration released an intelligence assessment a day earlier that concluded with “high confidence” the Middle Eastern regime carried out an attack that killed 1,429 people earlier. Gold reached $1,434 on Aug. 28, the highest since May 14, before falling for three days.

Coin Demand

Demand for jewelry, coins and bars will reach as much as 1,000 metric tons in India and China in 2013, the World Gold Council estimates. Gold sales by the Austrian mint in Vienna expanded 79% from January to July compared with a year earlier. Russia increased its gold reserves in July to the most since at least 1993, with Kazakhstan and Guatemala also adding to holdings, according to International Monetary Fund data.

Bullion holdings through exchange-traded products climbed 0.1% last week, the third straight advance and the longest run of increases this year. About $54.2 billion was wiped from the value of the assets this year as gold prices tumbled 17%, spurring losses for billionaire John Paulson and forcing Newcrest Mining Ltd. and other mining companies to announce at least $26 billion in writedowns.

Fed Meeting

Federal Reserve officials meeting this month will consider whether to begin curbing $85 billion of monthly bond purchases. Gold rose 70% from December 2008 to June 2011 as the U.S. central bank pumped more than $2 trillion into the financial system by purchasing debt, increasing investor concerns about currency debasement and accelerating inflation.

Fed policy makers were “broadly comfortable” with Chairman Ben S. Bernanke’s plan to start reducing bond buying later this year if the economy improves, according to minutes of their July meeting released Aug. 21. The U.S. economy expanded 2.5% last quarter, up from an initial estimate of 1.7%, the Commerce Department said Aug. 29.

Bullion tumbled a record 23% in the three months ended June 30 amid mounting speculation that the central bank will reduce its asset purchases.

“The increase in gold has been because of some temporary factors,” said Rob Haworth, a senior investment strategist in Seattle at U.S. Bank Wealth Management, which oversees about $112 billion of assets. “As I look forward, some of these things start to unwind. With better economic news on the horizon, it means taper terror is back in the gold market.”

Commodity Funds

Money managers withdrew $361 million from gold funds in the week ended Aug. 28, according to Cambridge, Massachusetts-based EPFR Global, which tracks money flows. Commodity funds had outflows of $17 million.

Commodity assets under management rose in July by about $1 billion to $348 billion, the first increase since early 2013, Barclays Plc said in a report Aug. 27. Price gains made up for a decline of $3.1 billion in investments, with precious metals making up the majority of the withdrawals, the bank said.

Net-long positions in crude advanced 4.9% to 317,523 contracts, CFTC data show. West Texas Intermediate reached a two-year high on Aug. 28 amid concern that escalating conflict in the Middle East may disrupt supplies. Prices retreated 2.2% over the next two days as U.K. lawmakers rejected a proposal by Prime Minister David Cameron seeking a military response to Syria.

Copper Imports

Bullish holdings in copper slid 9.1% to 13,043 contracts. The wagers were bullish for a third week after five straight months of bearish bets. Futures in New York climbed 3.7% in August, the most since November, amid signs of improving demand in China, the world’s largest consumer. Refined imports of the metal reached a 10-month high in July, Chinese customs data showed Aug. 21.

Silver wagers climbed 2% to 16,469 contracts, the highest since February. Investors were betting on a decline as recently as June. Holdings of the metal in ETPs climbed to a record Aug. 30. Bullish platinum bets rose for a seventh consecutive week.

A measure of net-long positions across 11 agricultural products jumped 31% to 282,843 futures and options, government data show. Investors had a net-short holding of 9,713 in the week to Aug. 6, the first bearish outlook in records going back to June 2006. The S&P GSCI Agriculture Index of eight commodities advanced 0.4% last month, the first gain since January.

Soybean Wagers

Bullish soybean holdings increased 38% to 138,182 contracts, the highest since June 11. Prices surged 13% in August, the most in 13 months, as drought expanded in Iowa and Illinois, the top U.S. growers. Heat and dry weather may reduce the domestic crop that the U.S. Department of Agriculture forecast to be 8% bigger than last year.

Profit growth for industrial companies quickened to 12% in July from 6.3% in June, China’s National Bureau of Statistics said Aug. 27. Credit Suisse Group AG raised its forecasts for Chinese economic growth this year and next a day earlier as data from manufacturing to exports signal strengthening expansion. The GSCI commodity gauge has rebounded 10% since reaching a nine-month low in April.

“The declines in commodities were overdone on the concerns over China’s economy,” said Adrian Day, who manages about $135 million as the president of Adrian Day Asset Management in Annapolis, Maryland. “We’re seeing a more realistic view of the Chinese economy. People are also seeing that supplies will be up, but it’s not going to crush the market.”

See the original article >>

Follow Us