Thursday, June 6, 2013

Yen, euro jump as Europe bonds slide while U.S. stocks advance

By Michael P. Regan and Nikolaj Gammeltoft

The yen surged the most in two years and the euro jumped as Italian and Spanish bonds sank after European Central Bank President Mario Draghi said growth should return and more stimulus measures will be left “on the shelf.” U.S. stocks and Treasuries rose before tomorrow’s jobs data.

The yen rallied 2% to 97.09 per dollar and jumped as much as 3.2%, the most since 2011, while the 17-nation euro increased as much as 1.6% to a three-month high of $1.3306 at 3:42 p.m. in New York. Yields jumped more than 20 basis points on the 10-year debt of Italy, Spain and Portugal. The Standard & Poor’s 500 Index rose 0.6% to 1,618.64, rebounding from a one-month low, while the Stoxx Europe 600 Index retreated 1.2%. Ten-year U.S. Treasury yields declined one basis points to 2.08% after rising as much as four points earlier.

Japan’s currency strengthened against all 16 major peers as traders unwound bets on a weaker yen based on the Bank of Japan’s monetary stimulus plan. U.S. jobless claims declined last week before a report tomorrow projected to show payrolls grew, fueling debate over whether the Federal Reserve will plan to reduce bond purchases. The euro-area will return to growth by the end of the year, Draghi told a press conference after ECB policy makers left their benchmark rate at 0.5%.

“Draghi’s statement about no further stimulus weakened the U.S. dollar against the euro and the yen,” Donald Selkin, who helps manage about $3 billion of assets as the chief market strategist at National Securities Corp. in New York, said in a phone interview.

‘Third Arrow’

The yen aslo rallied more than 1.5% versus the Mexican peso, Brazilian real, Taiwanese dollar and South Korean won. Japan’s currency added to gains triggered yesterday after Prime Minister Shinzo Abe failed to provide additional detail on stimulus measures. Abe said a legislative campaign to loosen rules on businesses won’t begin for months as he outlined his “third arrow” of an economic revival plan.

Traders said today’s rally in the yen likely accelerated as the moves triggered so-called stop orders, which are set to automatically buy or sell an asset when it reaches pre-set levels.

“The weakness in dollar-yen, as the cross took out stops, pushed a positioning clear-out that took place across the G-10,” Brian Daingerfield, a currency strategist at Royal Bank of Scotland Group Plc’s RBS Securities unit in Stamford, Connecticut, said in a telephone interview. “The catalyst of broad-based dollar weakness was dollar-yen breaking through some important levels on the downside, 98.80 and then 98.50.”

Jobless Claims

The euro reached the highest since February versus the dollar and strengthened against all 16 major peers except the yen, pound and Swiss franc, rallying more than 1% against the currencies of Brazil, South Korea and Mexico. The pound gained against all 16, surging 1.3% to an almost four- month high of $1.5607, as the Bank of England kept its asset- purchase target and benchmark rate unchanged.

Italy’s 10-year note yield surged 23 basis points to 4.36% while Spain’s added 25 points to 4.69%, widening their premiums to benchmark German securities as the rate on bunds of similar maturity increased one basis point to 1.52%.

Thirty-year U.S. bonds reversed earlier losses, sending yields down one basis point to 3.23% while two-year rates were flat at 0.29%.

Treasuries rose yesterday by the most in almost two months after a report showed U.S. private employers added fewer jobs than forecast in May. The rally marked a reversal from last week, when 10-year yields climbed to a 14-month high as investors weighed whether the U.S. economy is strong enough to withstand a tapering of bond purchases by the Fed.

Investors shouldn’t turn positive on Treasuries just yet, according to Luca Jellinek at Credit Agricole Corporate & Investment Bank.

‘Tidy Correction’

“It is difficult to get too bullish on rates markets on the back of a tidy correction in yields,” Jellinek, who is based in London and is the head of European interest-rate strategy, wrote in a note to clients today. “Fixed-income investors are likely to remain obsessed with the Fed ‘taper.’”

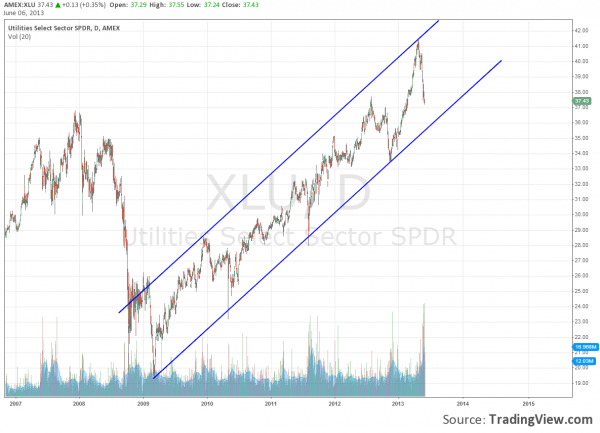
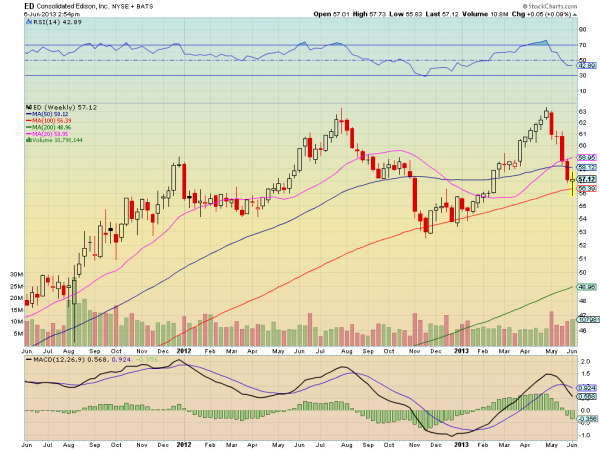
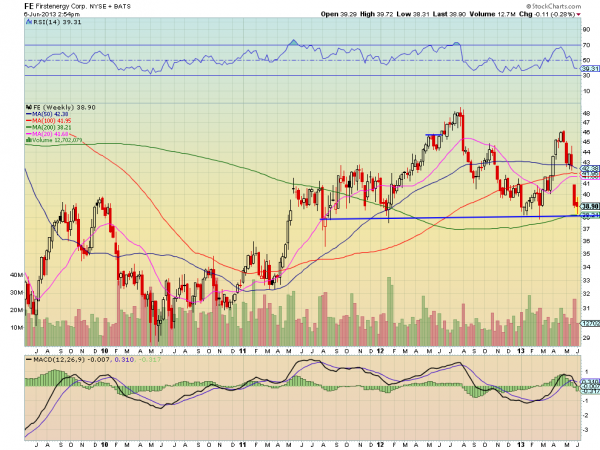
Utility, health-care, financial and telephone companies led gains among the 10 main groups in the S&P 500, while consumer- staples and technology shares performed the worst.

U.S. Movers

Home Depot Inc., Verizon Communications Inc. and Pfizer Inc. rose more than 2% for the best advances in the Dow Jones Industrial Average, which rebounded after yesterday tumbling 217 points in its biggest decline since April 15.

SodaStream International Ltd. climbed 3.1% after an Israeli business website reported that PepsiCo Inc. is in talks to buy the home soda-machine maker for more than $2 billion. VeriFone Systems Inc. plunged 20% as the maker of credit- card terminals forecast profit that missed analysts’ estimates.

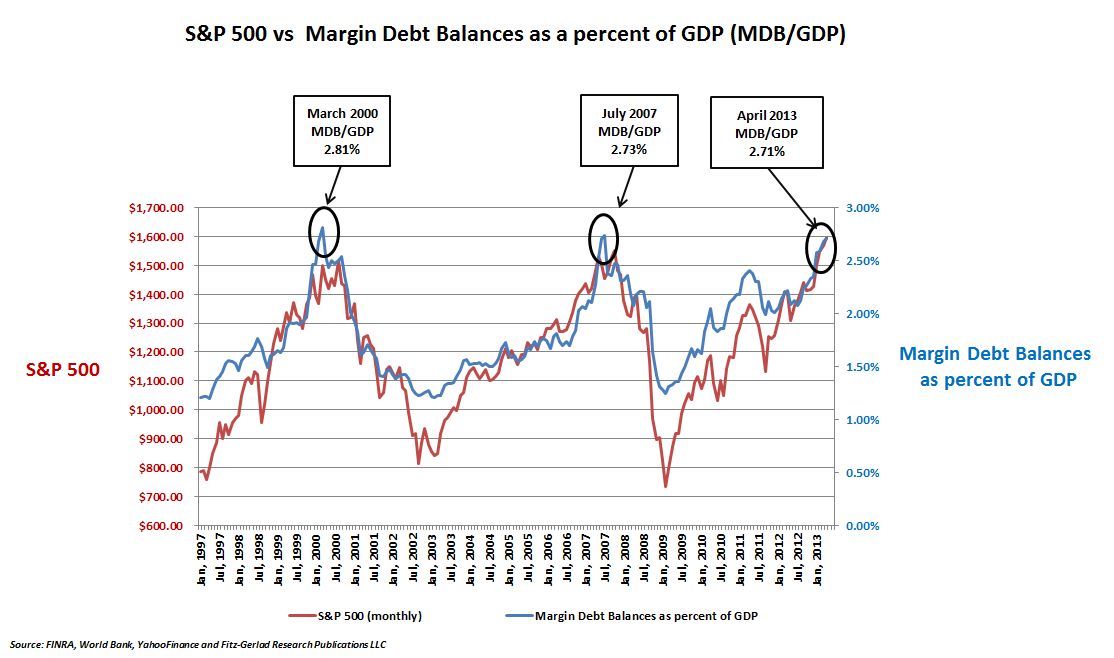
The S&P 500 slipped 3.6% from its record on May 21 through yesterday after Fed Chairman Ben S. Bernanke told Congress the central bank could reduce its $85 billion in monthly bond purchases if the job market improves in a “real and sustainable way.” The Fed’s quantitative easing and near- zero interest rates helped fuel a rally of as much as 147% from the benchmark index’s bear-market low in 2009.

The latest data on the labor market showed U.S. jobless claims decreased by 11,000 to 346,000 in the week ended June 1 from a revised 357,000, the Labor Department reported. The median forecast of 47 economists surveyed by Bloomberg called for a drop to 345,000.

Data tomorrow will probably indicate employment rose by 165,000 in May, the same as a month earlier, and the jobless rate held at 7.5%, economists in another Bloomberg survey forecast.

‘Wait and See’

“It’s wait-and-see before the jobs report tomorrow,” Frank Ingarra, head trader at Greenwich, Connecticut-based NorthCoast Asset Management LLC, said in a telephone interview. His firm oversees $1.6 billion. “It all depends on how traders will read that data and its effect on the Fed’s decision making. We need to be assured that the Fed will not taper off monetary stimulus or we need to see significant improvement in the economy to get the next leg up in the rally.”

Five shares declined for each that rose in the Stoxx 600, with the regional benchmark index sinking to the lowest since April 22. Barclays Plc lost 4.1% as an investor sold a stake in the lender.

Markets in Paris, Amsterdam, Brussels and Lisbon opened an hour later than usual as NYSE Euronext, the operator of the exchanges, faced a technical glitch. Trading in Stockholm was closed for Sweden’s National Day holiday.

Emerging Markets

The MSCI Emerging Markets Index fell 0.5% to six- month low. The Shanghai Composite Index slid 1.3% to a three-week low year as money-market rates jumped before a three- day holiday next week. The Hang Seng China Enterprises Index of mainland companies listed in Hong Kong dropped for a seventh day, the longest losing streak in a year, as Brazil’s Ibovespa extended was little changed after closing yesterday at the lowest level since July.

The cost of insuring corporate bonds with credit-default swaps increased, with the Markit iTraxx Europe Index of contracts linked to 125 investment-grade companies rising 5 basis point to 113 basis points, the highest since April.

Oil, gold and corn added at least 0.9% percent to help lead gains in 14 of the 24 commodities tracked by the S&P GSCI Index, while natural gas, lead and copper slid at least 1.6%. Copper dropped for the first time in four days, falling 1.6% to $7,335 a metric ton.

Volatility

Price swings across assets and around the world are holding below historical averages even as central banks roil markets.

Levels of investor concern in equities, commodities, bonds and currencies as measured by Bank of America Corp.’s Market Risk index of cross-asset volatility are below readings from about 75% of days since 2000, according to data compiled by Bloomberg. Among those markets, the cost of options has risen in Treasuries and foreign exchange in 2013 and fallen in stocks and raw materials.

Daily fluctuations have widened in the past month amid speculation the Fed will curtail its quantitative easing program and reports on Chinese and American manufacturing that trailed estimates. The increases have done little to increase expectations for price swings to historical levels after volatility tumbled amid rallies that added $5 trillion to global equity values this year and pushed bond yields to record lows.

“We don’t expect a big increase in volatility because monetary policy is still generally too stimulative,” Joost van Leenders, who helps oversee $657 billion as a strategist at BNP Paribas Investment Partners in Amsterdam, said in a phone interview yesterday. Central-bank policy makers are “not going to remove quantitative easing quickly. They will do it gradually to see how markets react and if markets become too volatile, they will move more cautiously.”

See the original article >>

Inflation Is Still the Lesser Evil

by Kenneth Rogoff

CAMBRIDGE – The world’s major central banks continue to express concern about inflationary spillover from their recession-fighting efforts. That is a mistake. Weighed against the political, social, and economic risks of continued slow growth after a once-in-a-century financial crisis, a sustained burst of moderate inflation is not something to worry about. On the contrary, in most regions, it should be embraced.

This illustration is by Chris Van Es and comes from <a href="http://www.newsart.com">NewsArt.com</a>, and is the property of the NewsArt organization and of its artist. Reproducing this image is a violation of copyright law.

Illustration by Chris Van Es

Perhaps the case for moderate inflation (say, 4-6% annually) is not so compelling as it was at the outset of the crisis, when I first raised the issue. Back then, against a backdrop of government reluctance to force debt write-downs, along with massively over-valued real housing prices and excessive real wages in some sectors, moderate inflation would have been extremely helpful.

The consensus at the time, of course, was that a robust “V-shaped” recovery was around the corner, and it was foolish to embrace inflation heterodoxy. I thought otherwise, based on research underlying my 2009 book with Carmen M. Reinhart, This Time is Different. Examining previous deep financial crises, there was every reason to be concerned that the employment decline would be catastrophically deep and the recovery extraordinarily slow. A proper assessment of the medium-term risks would have helped to justify my conclusion in December 2008 that “It will take every tool in the box to fix today’s once-in-a-century financial crisis.”

Five years on, public, private, and external debt are at record levels in many countries. There is still a need for huge relative wage adjustments between Europe’s periphery and its core. But the world’s major central banks seem not to have noticed.

In the United States, the Federal Reserve has sent bond markets into a tizzy by signaling that quantitative easing (QE) might be coming to an end. The proposed exit seems to reflect a truce accord among the Fed’s hawks and doves. The doves got massive liquidity, but, with the economy now strengthening, the hawks are insisting on bringing QE to an end.

This is a modern-day variant of the classic prescription to start tightening before inflation sets in too deeply, even if employment has not fully recovered. As William McChesney Martin, who served as Fed Chairman in the 1950’s and 1960’s, once quipped, the central bank’s job is “to take away the punch bowl just as the party gets going.”

The trouble is that this is no ordinary recession, and a lot people have not had any punch yet, let alone too much. Yes, there are legitimate technical concerns that QE is distorting asset prices, but bursting bubbles simply are not the main risk now. Right now is the US’s best chance yet for a real, sustained recovery from the financial crisis. And it would be a catastrophe if the recovery were derailed by excessive devotion to anti-inflation shibboleths, much as some central banks were excessively devoted to the gold standard during the 1920’s and 1930’s.

Japan faces a different conundrum. Haruhiko Kuroda, the Bank of Japan’s new governor, has sent a clear signal to markets that the BOJ is targeting 2% annual inflation, after years of near-zero price growth.

But, with longer-term interest rates now creeping up slightly, the BOJ seems to be pausing. What did Kuroda and his colleagues expect? If the BOJ were to succeed in raising inflation expectations, long-term interest rates would necessarily have to reflect a correspondingly higher inflation premium. As long as nominal interest rates are rising because of inflation expectations, the increase is part of the solution, not part of the problem.

The BOJ would be right to worry, of course, if interest rates were rising because of a growing risk premium, rather than because of higher inflation expectations. The risk premium could rise, for example, if investors became uncertain about whether Kuroda would adhere to his commitment. The solution, as always with monetary policy, is a clear, consistent, and unambiguous communication strategy.

The European Central Bank is in a different place entirely. Because the ECB has already been using its balance sheet to help bring down borrowing costs in the eurozone’s periphery, it has been cautious in its approach to monetary easing. But higher inflation would help to accelerate desperately needed adjustment in Europe’s commercial banks, where many loans remain on the books at far above market value. It would also provide a backdrop against which wages in Germany could rise without necessarily having to fall in the periphery.

Each of the world’s major central banks can make plausible arguments for caution. And central bankers are right to insist on structural reforms and credible plans for balancing budgets in the long term. But, unfortunately, we are nowhere near the point at which policymakers should be getting cold feet about inflation risks. They should be spiking the punch bowl more, not taking it away.

See the original article >>

Margin Buying Surpasses 2007 Danger Levels – Is Another Market Crash Coming?

By Gary Gately

There's nothing like buying securities with money you don't have - or, more precisely, with borrowed money from your broker, with your investments as collateral.
It's called buying on margin, and it's soaring as the market continues its tear and speculative investors seek a piece of the action. As your stocks appreciate you can borrow even more. A market rally lets you expand your portfolio by piling on more debt.
But it's potentially dangerous and could portend a stock market crash.
As the accompanying chart shows, historically there has been a direct link between a surge in margin loans and corresponding stock market peaks - followed by sharp declines in the markets.

So it's no small matter of concern that the Financial Industry Regulatory Authority reports the amount owed on loans secured by investments climbed to a record high $384 billion at the end of April.

That topped the previous high - $381 billion in 2007, not coincidentally, just before the financial meltdown and the Great Recession.
As a percentage of the economy, the latest margin borrowing totaled 2.71% of gross domestic product.
By comparison, margin borrowing hit 2.73% of GDP in July 2007, during the housing bubble, and 2.81% in March 2000 during the tech bubble, which was followed by a stock market crash.

"Very Much a Danger Sign"
So how should investors view the latest figures on margin borrowing?
"They're very much a danger sign," Money Morning Chief Investment Strategist Keith Fitz-Gerald said. "From a technical perspective, margin borrowing has risen to levels that we know are consistent with major corrections."
But Fitz-Gerald pointed out, "Investors need to learn to review the figures just like a big road sign. It doesn't stop you from driving down the road. It just says 'potential hazard ahead.'"
In margin lending, investors who take out margin loans get cash from their broker, with their investments as collateral, and can use the cash to pay for other investments.
Brokers set a minimum value of equities an investor must keep in an account, and if the account dips below this level as stocks depreciate they can issue a margin call requiring the investor to put more money into their account - or force them to sell securities to cover the margin.
"The problem with margin is that it magnifies the risks you take," Fitz-Gerald said. "Your profit potential is huge but then so is your loss potential unless you know how to manage that risk properly.
"Most retail investors simply do not understand what it is they're getting into and they fall prey to these very seductive investment ads coming out of Wall Street that are designed for one purpose and one purpose only: to separate them from their money."
Depression-Era Margin Calls
Today, an investor's minimum margin requirement - set by the Federal Reserve - is 50%, much higher than margins that had been as low as 10% during the 1920s. This means today you can buy $10,000 of stock by borrowing $5,000 from your broker on margin.
Back then, when the market started to contract and investors got margin calls they couldn't cover, their shares were sold, leading to more market declines and more margin calls.
This phenomenon was a major contributor to the 1929 market crash and the Great Depression, Fitz-Gerald noted.
"Investors started taking assets that they needed and they started leveraging them into investments that they arguably didn't need," he said, "and when we had the big crash, people found out the hard way that it's awfully hard to pay back loans you have with assets that depreciate in value."

See the original article >>

Quantitative Quicksand

by Allan H. Meltzer

PITTSBURGH – Almost all recoveries from recession have included rapid employment growth – until now. Though advanced-country central banks have pursued expansionary monetary policy in the wake of the global economic crisis in an effort to boost demand, job creation has lagged. As a result, workers, increasingly convinced that they will be unable to find employment for a sustained period, are leaving the labor force in droves.

This illustration is by Paul Lachine and comes from <a href="http://www.newsart.com">NewsArt.com</a>, and is the property of the NewsArt organization and of its artist. Reproducing this image is a violation of copyright law.

Illustration by Paul Lachine

Nowhere is this phenomenon more pronounced than in the United States, where the Federal Reserve has reduced interest rates to unprecedented levels and, through quantitative easing (QE), augmented bank reserves by purchasing financial assets. But inflation – which rapid money-supply expansion inevitably fuels – has so far remained subdued, at roughly 2%, because banks are not using their swelling reserves to expand credit and increase liquidity. While this is keeping price volatility in check, it is also hindering employment growth.

Rather than changing its approach, however, the Fed has responded to slow employment growth by launching additional rounds of QE. Apparently, its rationale is that if expanding reserves by more than $2 trillion has not produced the desired results, adding $85 billion more monthly – another $1 trillion this year – might do the trick.

America’s central bankers need not search far to find out why QE is not working; evidence is published regularly for anyone to see. During QE2 (from November 2010 to July 2011), the Fed added a total of $557.9 billion to reserves, and excess reserves grew by $546.5 billion. That means that banks circulated only 2% of QE2’s contribution, leaving the rest idle. Similarly, since QE3 was launched last September, total bank reserves have grown by $244.1 billion, and excess reserves by $239.4 billion – meaning that 99% of the funds remain idle.

Given that banks earn 0.25% in interest on their reserve accounts, but pay very low – indeed, near-zero – interest to their depositors, they might choose to leave the money idle, drawing risk-free interest, rather than circulate it through the economy. At current interest rates, banks lend to the government, large stable corporations, and commercial real-estate dealers; they do not extend credit to riskier borrowers, like start-up companies or first-time home buyers. While speculators and bankers profit from the decline in interest rates that accompanies the Fed’s asset purchases, the intended monetary and credit stimulus is absent.

At some point, the Fed must realize that its current policy is not working. But developing a more effective alternative requires an understanding of the US economy’s actual problems – something that the Fed also seems to lack. Indeed, Fed Chairman Ben Bernanke often says that his goal is to prevent another Great Depression, even though the Fed addressed that risk effectively in 2008.

The US economy has not responded to the Fed’s monetary expansion, because America’s biggest problems are not liquidity problems. As every economics student learns early on, monetary policy cannot fix problems in the real economy; only policy changes affecting the real economy can. The Fed should relearn that lesson.

One major problem, insufficient investment, is rooted in President Barack Obama’s effort to increase the tax paid by those whose annual incomes exceed $250,000 and, more recently, in his proposal to cap retirement entitlements. While such proposals have been met with opposition, Obama cannot be expected to sign a deficit-reduction bill that does not include more revenue. As long as that revenue’s sources, and the future effects of new regulations, remain uncertain, those whom the policies would most harm – the country’s largest savers – are unlikely to invest.

Likewise, Obama’s health-care reform, the Affordable Care Act, has hampered employment growth, as businesses reduce their hiring and cut workers’ hours to shelter themselves from increased labor costs (estimates of the rise vary). Meanwhile, the faltering European economy and slowing GDP growth in China and elsewhere are impeding export demand.

While subdued liquidity and credit growth are delaying the inflationary impact of the Fed’s determination to expand banks’ already-massive reserves, America cannot escape inflation forever. The reserves that the Fed – and almost all other major central banks – are building will eventually be used.

See the original article >>

Albert Edwards: "Has The US Recession Already Begun?"

by Tyler Durden

Some are surprised that inflation has failed to take off despite massive amounts of quantitative easing. The explanation, ECRI explains, is simple: recession kills inflation. For all the talk of the wealth effect, demand is falling and deflation is closer than at any time since 2009. The 'r' word is seldom heard on the lips of the mainstream media - how absurd - but as SocGen's Albert Edwards notes, if anyone is waiting for the ISM to tell them that a recession has started in the US, they are looking at the wrong data. Much more importantly, Edwards explains, we may well be in for a double dose of bad news - both falling revenues and falling margins. History suggests this as good a leading indicator as any other for whether the US economy will endogenously fall back into recession.

Via SocGen's Albert Edwards:

One of the axioms of economics I have always had a great deal of faith in is that profit margins mean revert.

But unfortunately at the height of a recovery most commentators forget this as they become intoxicated by the equity market's prior stellar performance and tend to continue to price the market off analysts' forward earnings - which inevitably always forecast further healthy gains ahead. Even the use of trailing earnings for PE calculations tends, in retrospect, to be too optimistic. That is why cyclically adjusted PEs are so important.

...

excluding financials, profit margins have failed to break out above their usual range. As night follows day, the market should be pricing in a decline in the margin cycle from here.

...

The surprisingly weak out-turn in May for the US manufacturing ISM seems to me just a continuation of what we have seen for the last few years, with mini-cycles of optimism and pessimism anchored to a clear downtrend

...

It is also notable that just as the last recession was starting in November 2007, the ISM was embarking on a surprising six month long H1 2008 recovery back above the key 50.0 mark, before plunging in August and September ahead of the Lehman bankruptcy... The bottom line here is that if anyone is waiting for the ISM to tell them a recession has started in the US they may be looking at the wrong data.

...

We find profits data far more useful to determine if a recession has started or indeed about to start. The results are 'shocking':

"In the S&P 500, there have been 91 negative EPS preannouncements issued by corporations for Q2 2013 compared to 13 positive EPS preannouncements. By dividing 91 by 13, one arrives at an N/P ratio of 7.0 for the S&P 500 Index. This 7.0 ratio is higher than the N/P ratio at the same point in time in Q2 12 (3.4), and is above the long-term aggregate (since 1995) N/P ratio for the S&P 500 (2.4)."

Reuters goes on to say that if this persists it would be a record pace of downgrading ahead of a reporting round.

...

In addition to the margin downturn, revenue growth is also flagging badly. Thomson Reuters also reports that revenue forecasts are being missed at an increasingly rapid rate. Indeed, the latest slide in the ISM below 50 suggests we are now close to outright yoy decline

Thus we may well be in for a double dose of bad news - both falling revenues and falling margins. History suggests this as good a leading indicator as any other for whether the US economy will endogenously fall back into recession.

AS ECRI confirms:

Despite surging prices for homes and equities, consumer spending is contracting, registering its biggest monthly decline since September 2009. Quite simply, the wealth effect is rendered moot by languishing incomes.

No wonder yoy U.S. import growth has also plunged into negative territory, whether or not oil imports are included. In recent decades, this has happened only during U.S. recessions. Notably, unlike data for GDP and jobs, imports data are not revised substantially, long after the fact.

As a result, core inflation – defined as yoy growth in the Personal Consumption Expenditure (PCE) deflator excluding food and energy – has now dropped under 1.1%, to the lowest reading in its entire 53-year record.

Meanwhile, yoy growth in the headline PCE deflator has dropped to 0.7%, its lowest reading since October 2009, and far below the Fed's official 2.0% target. This inflation measure has never been this low except during or in the immediate aftermath of recession.

The bottom line: for all the talk of the wealth effect, demand is falling and deflation is closer than at any time since 2009.

See the original article >>

Utilities Preparing to Flip the Switch

by Greg Harmon

Utilities were the first sector to pullback, starting May 1st. And they are nearing levels that present buying opportunities. The Utilities Select Sector SPDR, $XLU, has been in a rising channel since bottoming in 2009 with the market. But the chart below shows that they are now as a group less than 4% from the rising support at the bottom of that channel after

xlu rising channel

touching the top. Focusing on the last part of the move, since the November lows, they are hitting a 50% retracement of the upward advance Thursday. They could continue lower but if you now move away from the ETF and look at some individual names they yields are getting very attractive. Here are 4 that are worth preparing to enter.

Consolidated Edison, $ED
ed

After pulling back forma double top at 63, Consolidated Edison, $ED, is printing a Hammer, possible reversal candle, on the weekly chart right at the rising 100 week Simple Moving Average (SMA). The Relative Strength Index (RSI), has stopped falling and remains in bullish territory too and the dividend yield is now up to 4.3%.

First Energy, $FE
fe

First Energy, $FE, has pulled back to support at 38.25 where the 200 week SMA is holding. It also shows the RSI turning to flat after the fall. This name has a dividend yield now of 5.6% and I socked a little away in the family accounts today.

Hawaiian Electric, $HE
he

Hawaiian Electric, $HE is testing support at the 100 week SMA, a spot where it has reversed in the past. The dividend yield is up to 4.7% in this name, and hey , who does not want to have some connection to Hawaii?

Southern Company, $SO
so

Southern Company, $SO, is printing a Hammer for the week with a RSI that is rising back up. The stock is finding support at the 50 week SMA and has a dividend yield of 4.6%.

There are many more to consider and I do not advocate buying stocks that are falling. These are weekly charts and if you were to look at the daily charts all have had the RSI below the technically oversold level at 30 with ConEd and Southern Company moving back over it today as potential catalyst for an entry. But it is time to put utilities back on your radar for that turn.

See the original article >>

Should You Buy This Dip?

by Tom Aspray

The stock market was punished again Wednesday with just 800 stocks advancing and 3276 declining. Each of the ten major sectors closed the day lower as the weaker than expected ADP Employment Report and continued nervousness over the Fed’s future plans were a good excuse to sell.

Overnight, stocks in Asia were punished again with Singapore stocks down over 1.5%. Stocks in Europe are trying to stabilize and the US stock index futures are higher in early trading. The ECB kept rates unchanged today, and of course, Friday we get the monthly jobs report.

Many investors are wondering whether they should be buying now or if stocks will drop even further before the worst of the selling is over. A close look at the market internals will help investors and traders navigate what could be a difficult month in the markets.

chart
Click to Enlarge

Chart Analysis: The daily chart of the NYSE Composite goes all the way back to the June 2012 lows as it closed Wednesday below initial support at 9265. There is further support just a bit lower at 9143 (line a).

  • The daily starc- band is being tested with the short-term uptrend at 9041.
  • The 38.2% Fibonacci retracement support from the June 2012 lows is at 8757, which is just above the March low at 8700.
  • The uptrend from the lows, line b, is now in the 8500 area.
  • The McClellan oscillator (a short-term A/D indicator) closed at -311 Wednesday.
  • This is short-term oversold reading that was last seen in May and June of 2012.
  • At the November 14, 2012, lows it hit -258.
  • As was the case in June 2012, the oscillator will often form a bullish divergence at the market’s actual lows (point 1).
  • The NYSE Advance/Decline dropped below its WMA on May 23 as I had noted previously. It has now broken its uptrend, line c, that goes back to the November 2012 lows.
  • There is initial resistance in the 9350-9450 area, which includes the declining 20-day EMA and the monthly pivot line.

The Spyder Trust (SPY) closed Wednesday 4.6% below its all-time high at $169.07.

  • There is next good support at $159.80 and the daily starc- band.
  • The minor 38.2% support calculated from the November lows is at $155.94, which is 7.8% below the highs.
  • There is a band of further support down to the 50% level at $151.89.
  • The daily on-balance volume (OBV) did confirm the recent highs before dropping below its WMA.
  • The OBV has broken its uptrend at line e, with more important support at the uptrend, line f.
  • The S&P 500 A/D line has dropped further below its now declining WMA and has broken its short-term uptrend, line g.
  • There is more important support for the A/D line at line h.
  • There is initial resistance at $163.87 and the flat 20-day EMA with much stronger in the $166 area.

    chart
    Click to Enlarge

    The chart of the Powershares QQQ Trust (QQQ) shows that it is still well above the September highs at $70.58, line a. The monthly pivot support is at $70.68.

    • The QQQ has held up much better than the SPY as it is down just 3.8% from its high at $74.95.
    • The 38.2% Fibonacci retracement support from the November 2012 lows is at $69.72.
    • The 50% support is at $68.11 with the uptrend, line b, a bit higher at $68.23.
    • The Nasdaq 100 A/D line formed lower highs before dropping below its WMA.
    • The A/D line has next support at the April highs, line c, and much more important at the uptrend, line d.
    • The 20-day EMA is at $72.94 with further resistance in the $73.40-80 area.

    The iShares Russell 2000 Index (IWM) is also holding above the April highs at $95.10 (line e) and is now down just 3.9% from the high at $100.98.

    • The monthly pivot stands at $92.91 with the 38.2% support from the November lows at $91.12.
    • There is important chart support in the $89 area with the 50% support at $88.26.
    • The daily OBV has dropped slightly below its WMA but acts much stronger than the OBV on the SPY.
    • The Russell 2000 A/D has dropped below its WMA and is still well above converging support at line g.
    • There is first resistance now at $98.25 to $99.15.

    What it Means: The market is likely close to a short-term low. In the next week, we should see a pretty decent rebound that could take the S&P 500 back to the 1635-1645 area and possibly even 1660. Bearish sentiment is increasing as the number for bullish individual investors from the AAII has dropped to 29.7% down from 48.9% on May 23.

    For the NYSE Composite and Spyder Trust (SPY), the expected rebound should be followed by a further decline that could take them to new correction lows.

    The better relative performance of the Powershares QQQ Trust (QQQ) and the iShares Russell 2000 Index (IWM) indicates they could bottom first and may be the market leaders once the market’s major uptrend resumes.

    On a time basis, it has only been nine days since the market made its highs, and in my experience, the correction in the stock market should last longer. The oversold reading of the McClellan oscillator is unlikely to mark a final low but it could form a bullish divergence in a few weeks.

    In conclusion, while there may be a few stocks that are making their lows now I don’t think that generally this is a dip to buy.

    How to Profit: If the rebound is strong enough, it may allow for the purchase of an inverse ETF like the ProShares UltraShort S&P500 (SDS) at a reasonable risk/reward level to hedge your equity holdings.

See the original article >>

Using options to profit from a volatility inducing jobs report

By James Ramelli

With the most important day of the month coming up, future traders are preparing for the new employment level. What this number does is provide the traders with huge opportunities to turn a great profit, but at a high risk. To turn large risks into profits, traders must set wide stops when selling or buying futures ahead of the number.

Last week the number of Americans seeking unemployment benefits decreased by 11,000 to a seasonally adjusted 346,000. This is a level consistent with steady growth in jobs. According to the labor department, applications have dropped from a previous 357,000, which was adjusted up from the initial 354,000. A representation for layoffs is the weekly number of applications, which tumbled 6% in the last six months and also hit a five-year low of 338,000 in early May.

Decreasing layoffs is only half of increasing the future of jobs, the other is on the side of companies hiring. The problem here, though, is that companies have been very cautious about hiring people and creating more jobs. Tomorrow the government comes out with the updated unemployment number, which economists expect to show a modest growth of about 170,000 jobs.

With heightened volatility around the number, a trader is presented with opportunity. The best way to trade the number is by using a product that tracks the S&P 500.

There are several ways you can trade the S&P 500:

  1. Buy Individual stocks in the S&P 500. This is a very capital intensive way to take a view on the index.  It does, however, offer the opportunity to leg out laggards and add to winners, but this strategy may not track the index perfectly.
  2. Buy the ETF. The SPDR S&P 500 ETF Trust (SPY). Although this also would be capital intensive, this is an easy position to manage.
  3. E-mini S&P 500 Futures and Options. This gives a trader the best opportunity to set up a great risk vs. reward trade while tracking the performance of the index very well. This is also one of the most liquid futures markets.

Because options on futures give us the best risk vs. reward set up, especially around catalyst events, we can use them to set up a bullish and bearish strategy ahead of tomorrow’s number.  The E-mini S&P 500 future options are implying a move by tomorrow’s expiration of around 17.75 points as calculated by the at-the-money straddle. With futures trading at 1,609.00 we can use this to calculate an upside target of 1,626.75 and a downside target of 1,591.25. With these targets we can set up trades.

Bullish Setup:
Trade: Buying the ES Jun 7th 1615-1625 Call Spread for 3.45
Risk: $172.50
Reward: $327.50
Breakeven: 1,618.50

Click to enlarge.

Bearish Setup:

Trade: Buying the ES Jun 7th 1600-1590 Put Spread for 2.00
Risk: $100 per 1 lot
Reward: $400 per 1 lot
Breakeven: 1,598.00

Click to enlarge.

See the original article >>

Platinum: Time to shine

By Jamie Macrae

The PGM metals — platinum and palladium — are typically highly correlated assets. However, since February of this year, they have diverged, with palladium pushing toward the highs while platinum has languished (Chart 1). This is a reflection of the relative strength of the U.S. economy vs. Europe. The primary use of both metals is in autocatalytic converters, with palladium used extensively in gasoline-powered engines (the type favored by Americans), and platinum used in the diesel engines that are much more popular on European roads. Chart 2 shows the sharp difference in demand for new vehicles in the U.S. and in Europe.

The demand side of the equation clearly supports palladium’s outperformance; however, the supply side may be shifting to favor platinum. About three quarters of the world’s supply of platinum comes from South Africa, a country plagued by social and labor unrest, as well as insufficient infrastructure, which leads to frequent power outages and mining delays.

The situation in South Africa appears to be getting worse. Whereas disputes between management and labor unions are nothing new, the heating rivalry between the long-dominant National Union of Mineworkers (NUM) and the upstart Association of Mineworkers and Construction Union (AMCU) threatens to slow or stop production at the world’s biggest platinum producers, and it has been growing increasingly violent. As we head into “strike season,” a common term in South Africa to describe the annual mid-year wave of labor walkouts and wage negotiations, this tinderbox of hostility seems primed to catch fire.

The situation worsened on June 3 when an NUM steward was shot dead at a Lonmin mine. Reports abound that workers are arming themselves and bringing weapons into the mines. Union leaders are doing little to douse the flames, with Joseph Mathunjwa, leader of the AMCU saying last week, “Even if you kill me or assassinate me there are those who will follow and take the baton,” following a shooting days earlier that killed another AMCU leader in a tavern. Violence, wildcat strikes, legitimate work stoppages: There is a multitude of risks that could derail South African platinum production. The market returned to deficit in 2012 according to GMFS, a leading precious metals consultancy, and is vulnerable to disruptions in supply (Chart 3).

Investors seem to have taken note, as inflows into physically-backed platinum ETFs have been strong, even while money flows out of the more popular gold- and silver-backed funds (Chart 4). With a growing source of new demand, at-risk supply, and a relatively low price compared with its sister metal palladium, platinum looks set to outperform in the near term, at least through the “strike season.” Protective stops should be placed below the recent low of $1,430.

See the original article >>

The Makings of a Modern Home

See the original article >>

Goldman sees commodities bull run over as returns trail stocks

By Joe Richter, Elizabeth Campbell and Debarati Roy

Commodities are trailing equities for the longest stretch in almost 15 years as Goldman Sachs Group Inc. and Citigroup Inc. predict the end of the decade-long bull market even as the global economy expands.

The Standard & Poor’s GSCI Spot Index of 24 commodities lagged behind the MSCI All-Country World Index for six months, the longest stretch since 1998. Hedge funds cut combined bullish bets across 18 U.S. raw-material futures by 51% from a 16-month high in September and are bearish on six of them. Commodities will return 1.6% in a year as losses in agriculture and precious metals diminish gains from energy and industrial metals, Goldman said last month.

Investors pulled a record $23.3 billion from commodity funds this year as global equities attracted $182 billion, according to EPFR Global, which tracks money flows. Prices that more than doubled in 10 years spurred expansions at mines, farms and oil fields. Gluts are emerging as the International Monetary Fund predicts global growth of 3.3% this year, from 3.2% in 2012. The group cut last week its estimates for China, the top consumer of metals, grains and energy.

“There are times when you probably should be avoiding commodities, and I think this is one of them,” said John Stephenson, who helps oversee about C$2.7 billion ($2.61 billion) at First Asset Investment Management Inc. in Toronto. “Anytime you have a whole lot of inventory and visible supply, prices are going to be under pressure. The real issue for commodities is the source of demand, China, is weak.”

Natural Gas

The S&P GSCI dropped 3.1% this year, as 17 members of the gauge retreated. Silver led the decline, falling 26%. Corn and gold also entered bear markets in April, joining copper, sugar, wheat, soybeans and coffee. Natural gas is leading the gainers with a 17% advance, while cotton rose 11%. The commodity index is 30% below its record close in July 2008.

The MSCI equity gauge gained 6.3% since the end of December, with the Dow Jones Industrial Average and the S&P 500 Index reaching records last month. The dollar strengthened 3.2% against six major trading partners. Global bonds measured by the Bank of America Merrill Lynch Global Broad Market Index lost 1.5% in May, the most since April 2004.

Commodities are diverging from equities as the supercycle, or longer-than-average period of rising prices, is eclipsed by the supply surge, Jeffrey Currie, Goldman’s head of commodities research in New York, wrote in a report May 14. The agricultural segment of the S&P GSCI will drop 13% in 12 months as livestock and precious metals lose 4%, he said. Energy and industrial metals will advance 5%.

Domestic Consumption

Most commodities will drop this year as China’s economy moves from a focus on infrastructure to domestic consumption and services, Citigroup’s Ed Morse said in a May 20 report. That means investors should pay more attention to supply and demand rather than just broad economic trends, he said. The bank predicted the end of the supercycle in November. UBS AG and Credit Suisse Group AG made similar forecasts this year.

The S&P GSCI more than tripled since the end of 1999, including 11 gains over the past 13 years, setting records in everything from oil to gold to copper. Producers struggled to keep up as China’s economy expanded more than fivefold. That attracted a surge of investments and assets under management totaled $409 billion in March, from $154 billion at the end of 2008, Barclays Plc estimates.

Corn Supply

Pessimism about commodities is focusing on the price of raw materials as the pace of growth in consumption slows. China will use 5.2% more copper this year, from a gain of 6.8% in 2012, Barclays estimates. The nation is still using enough copper in cables each month to circle the globe almost 90 times, government data show. It will consume more than one in every five tons of global corn supply this year as its hog herd reaches 447 million animals, six times the U.S. figure.

In the U.S., where builders use about 400 pounds of copper in a single-family home, sales of new properties in April reached the second-fastest pace since July 2008. Central banks in the U.S., Europe and Asia are still printing unprecedented amounts of money to boost growth, adding to the almost doubling of global sovereign debt to $23 trillion since the end of 2008, a Bank of America index shows.

Biggest Exporter

Supply expansions may fall short of forecasts as bad weather curbs crops in the U.S., the biggest exporter, and mining is disrupted. Farmers in Iowa, the largest U.S. corn and soybean grower, had their wettest April and May in records going back to 1873. Freeport-McMoRan Copper & Gold Inc.’s Grasberg operation may be shut for as long as three months after a tunnel collapsed last month. The Indonesian mine is the biggest source of copper after Escondida in Chile, where port strikes have disrupted metal shipments.

“The outlook for commodities is likely to be brighter,” said Alan Gayle, a senior strategist at RidgeWorth Capital Management in Richmond, Virginia, which oversees about $48 billion of assets. “The outlook will turn bullish when demand starts moving higher. I’m not jumping in yet with both feet and am going to let the story develop first, which I expect to happen over the next few months.”

The International Monetary Fund cut its forecast for Chinese growth this year and next on May 29. It’s now predicting 7.75%, from an earlier projection of 8% for 2013 and 8.2% for 2014. The U.S. economy grew at a 2.4% annualized rate in the first quarter, the Commerce Department said May 30, cutting its previous estimate of 2.5%.

Largest Retailer

Cheaper raw materials may boost margins for companies from McDonald’s Corp. to General Mills Inc. to Boeing Co., while keeping inflation in check and allowing the Federal Reserve to continue stimulus. Kraft Foods Group Inc. cut the cost of its Gevalia coffee by 6% last month and Wal-Mart Stores Inc., the world’s largest retailer, is reducing grocery prices. U.S. retail gasoline fell 4.5% from this year’s peak in February, American Automobile Association data show.

Hedge funds and other large speculators are holding a net- long position of 652,708 futures and options across 18 U.S. commodities, from 1.3 million in September, government data show. Supply will exceed demand for 12 of 18 of the metals and agricultural products, according to estimates from Barclays and Rabobank International.

West Texas Intermediate crude oil will average $90 a barrel this year, from $94.15 in 2012, Citigroup estimates. U.S. inventories reached the highest since 1931 on May 24, government data show. New drilling technology is unlocking supplies trapped in shale formations, helping the U.S. meet the highest proportion of its own energy needs since 1986. Crude rose 2.7% in New York trading this year.

Exchange Traded

Gold dropped 17%, the worst start to a year since 1982. Holdings through exchange-traded products tumbled 19% to the lowest since May 2011. Bullion will drop this year for the first time since 2000, according to a Bloomberg survey of 38 analysts.

The LMEX index of six industrial metals fell 6.3%. Copper stockpiles tracked by exchanges in London, Shanghai and New York more than doubled in the past year. Production will outpace demand for the first time in four years in 2013, Morgan Stanley predicts. Prices will decline about 6% in 12 months, Goldman estimates.

Farmers around the world will harvest the biggest grain and soybean crops ever, the U.S. Department of Agriculture estimates. Corn will extend this year’s 22% decline by another 3.2% in six months, as wheat drops 11%, Goldman says.

“You have the combination of higher production together with slower growth in China,” said Adrian Day, who manages about $135 million of assets as the president of Adrian Day Asset Management in Annapolis, Maryland. “For rest of the year, you have a potential surplus of production over demand, which obviously means lower prices.”

See the original article >>

2013: Stock Market Crash!

By tothetick

They predicted it was going to happen long ago.

Are we talking about Nostradamus or even anything remotely as cheesy as him? We all know that was a load of baloney. Just hot air and wind! Right? The Mayans might have got it right after all. Remember, the end of the world for them didn’t necessarily mean the end of the world it just meant the end of a cycle. A new cycle might begin, just different, opening up a whole new world. So maybe that cycle did begin as the door closed on 2012. January came and went and we are still here.

But, there are people who are in-the-know and who are able to predict (or think they can) what’s going to happen even years ahead of when it actually does. Yet, we only look back and then it’s too late for the ‘if-only’ statements and weeping over the milk that got spilt. There’s no point looking back and regretting anything. Might as well listen to the people that have correlated the ups and downs in the financial markets. For once! What else have you got to lose?

If we are to believe what they said, then this is the year. 2013! It’s going to happen according to them. The stock-market is ready to crash yet again this year and this time it’s going to be a big one. Let’s take a look at what was said, when, why and by whom.

1.       2010

Charles Nenner claimed in December 2010 that the crash would occur sometime either in 2013 or just after. Although, we might ask if that is called hedging one’s bets. Nenner is a stock market analyst, right? But three years ago he developed a correlational theory that expressed the stock market moves as being influenced by sunspots. http://technorati.com/lifestyle/article/2013-catastrophic-economic-crisis-predicted/.

Anyone that wants to predict the downturn in the market will be able to consult the predictions of the sunspot cycle via http://solarscience.msfc.nasa.gov/predict.shtml. That means, in fact, that sunspot cycles are predictions that will enable us to make further predictions about the economic cycle of the world. Yeah!

2.       2012

Peter Shiff predicted that the bang would occur this year too. This is the guy, you will surely recall, that was poo-pooed because he said in 2007 that the stock market crash of 2008 would occur. We were told that the economy back then had never looked so good. Now, he’s predicting the crash of 2013. Can we afford to turn a blind eye to this one? There will be a huge US Dollar drop and Treasury bond crisis. He says that the banks won’t hold up this time. They have been shored up once before, and they have passed Federal-Reserve tests regarding their ability to cope in the event of a crisis. But, he adds that they are not ready to pass any stress test for viability over a Treasury bond crisis like the one that is lurking behind the Fed’s door this year. Shiff is one of the few that believes it’s 2013 and that things are nowhere near the happy-go-lucky mark that people are spouting on about.

http://ivn.us/2012/10/28/peter-schiff-who-predicted-the-financial-crisis-forecasts-the-worst-to-come-around-2013-2/.

3.       2013

Jeffrey Gundlach predicted the 2008 financial crisis too. Now, he is also one of the few telling us to prepare for the time-bomb that is about to explode. In January of this year, he said that the market was ready to implode. That’s all because we have been living on debt that has been piling up for thirty-odd years now. In the first decade we got hooked on debt. We must have been candy-flipping back then. We really jacked up, didn’t we? The second decade saw all of that go pear-shaped as we walked right into the sticky mess of the sovereign debt crises and the foreclosures. Our debt had become too big to be anything more than a big burden weighing us down. The third decade is just starting. It will involve rampant inflation that we’ll obviously try to control, but that we’ll make worse, debt defaulting on repayments as well as corruption galore. Lovely! Gundlach suggests that we should be moving elsewhere right now. Only problem is he doesn’t tell us where!  Does it all sound familiar, though?http://advisorperspectives.com/newsletters13/pdfs/2013-Market_Outlook.pdf.

4.       2013

Robert Weidemer tried to get his video interview banned, but you can see it at: http://w3.newsmax.com/a/aftershockb/video47b.cfm?.

Weidemer predicts that unemployment will hit 50% in the USA. 90% of the stock market will be wiped out and there will be inflation of 100%. Too over the top? Well, Weidemer predicted the failings of the housing market and the catastrophic result on the world’s economies. The unsinkable USA almost sank because of it. Probably best to jump ship now.

5.       2013

David Stockman predicted a few months ago that we were on the next train to stock-market hell and there were no tickets left for a return journey. That’s because, according to him, the Federal Reserve has been dishing out too much monopoly money. There are no real gains in the economy, just phony spoof-like patchwork. But that’s ready to pull apart. How can you not believe Stockman with a name like that?http://moneymorning.com/2013/04/01/is-david-stockmans-stock-market-crash-prediction-on-target/#.UbB_tvm9ByI.

The bursting of the dot com bubble cost us in the region of $5 trillion from 2000 to 2004 as it bust in our faces and brought the world down. That was even bigger in 2007, when it cost $7 trillion and perhaps we are still notching up the cost even today. How much is it going to cost this time?

Believe it or refute their claims as drunken beer-talk down the local pub. But, when (or if) it happens, no point telling anyone that you didn’t know. You can lay off the ‘what-ifs’ now. They won’t wash. I’ll just say “I told you so”. Maybe the Mayas got it right after all. The new cycle might begin this year. Just have to figure out what that new cycle will include, don’t we? The death of the dollar? The Death of our economies? A new cycle? But, hey, if the predictions were as worthy as all that, we wouldn’t be doing much all day, would we? I wouldn’t, at least. We would be acting on them, wouldn’t we? Or maybe we are just non-believers.

See the original article >>

China's Gold Holding Could Mean A Dollar Doom

By Michael Snyder

What in the world is China up to?  Why are the Chinese hoarding so much gold?  Does China plan to back the yuan with gold and turn it into a global reserve currency?  Could it be possible that China actually intends for the yuan to eventually replace the U.S. dollar as the primary reserve currency of the planet?  Most people in the western world assume that China just wants a "seat at the table" and is content to let the United States run the show.  But that isn't the case at all.  The truth is that China doesn't just want to compete with the United States.  Rather, China actually plans to replace the United States as the dominant economic power on the planet. 

In fact, China already accounts for more global trade than the United States does.  So what would happen one day if China announced that it was backing the yuan with gold and that it would no longer be using the U.S. dollar in international trade?  It would cause a financial shift so cataclysmic that it is hard to even imagine.  Most of those that write about the "death of the U.S. dollar" usually fail to point out that China is holding a lot of the cards as far as the fate of the dollar is concerned.  China owns about a trillion dollars of our debt, China is the second largest economy on the planet, and nobody uses the dollar in international trade more than China does except for the United States.  Up until now, China has had to use the U.S. dollar in international trade because there has not been an attractive alternative.  But a gold-backed yuan would change all of that very rapidly.

And without a doubt, the Chinese government has already been very busy promoting the use of the yuan in international trade.  In a recent note, John McCormick of RBS Group stated the following...

Financial crises in the US and Europe mean the world needs a new, more stable global reserve currency, and trade in RMB is growing rapidly. In the FX market, for example, our figures show that volumes are now worth around USD 5-6 billion daily – double what they were a year ago.
A number of factors suggest that the Chinese authorities want to make RMB internationalisation happen by 2015.

For China, having a global reserve currency is not just about economics.  It is also about power.

McCormick ended his recent note this way...

China’s new leadership faces a number of problems. The country’s economy is slowing and, although we would expect the rate of GDP growth to pick up a little, it is unlikely to be a steep rebound.
But promoting RMB as a global reserve currency, with all the economic benefits that will bring in addition to exerting more political influence on the global stage, clearly remains high on their agenda.

Similar sentiments were echoed in a recent article in the Wall Street Journal...

Beijing is undertaking a long, gradual campaign to establish the yuan as a more market-oriented, international currency. China's State Council, or cabinet, said in a statement this month that the country would draft a plan to allow the yuan to become fully convertible. Meanwhile, the People's Bank of China is guiding the currency higher and set the median point of its permitted daily trading band last week at the strongest level ever.

We don't hear much about these sorts of things in the western media, but the convertibility of the Chinese yuan is a very big deal.  Up until recently, the yuan was only directly convertible into dollars and yen.  But now that is rapidly changing.  So far this year, the Chinese government has entered into currency convertibility agreements with Australia and New Zealand.

So instead of having to change yuan into U.S. dollars to trade with Australia and New Zealand, now China can cut U.S. dollars completely out of the process.

But right now there is nothing that really gives the Chinese yuan a significant competitive edge over the U.S. dollar.  If Chinese authorities truly want the yuan to end up replacing the U.S. dollar as the primary reserve currency of the planet, they need to do something that will make the rest of the world want to use it.

And they could do that by backing the yuan with gold.  In fact, there are persistent rumors that China has been busily preparing for that.

For example, the Economic Policy Journal recently pointed out that Dr. Pippa Malmgren, the President and founder of Principalis Asset Management who once worked in the White House as an adviser to President Bush, is claiming that China has plans to turn the yuan into "a hard, gold-backed currency" that will have a distinct competitive edge over the rapidly depreciating paper currencies that the rest of the globe is currently using...

The most interesting piece of the puzzle is that the Chinese have emerged as the biggest buyers of gold, mainly off-market. They want the yuan to emerge as a hard, gold-backed currency in a world where everyone else has chosen to inflate and devalue.
The recent bilateral currency deals with Australia, France, Russia and Singapore, and many others, reflect this desire to displace the USD as the world’s reserve currency.
It may be an interesting and long race between the Chinese reaching for convertibility and the Western central banks straining credibility.

Other analysts are also fully convinced that the goal of the Chinese is a gold-backed yuan.  The following is what money manager Stephen Leeb told King World News recently...

Countries have been battling each other in order to cheapen their currencies. The problem with a cheaper currency is that commodities cost more. So China has decided to opt for a higher currency.
The move in the yuan overnight was one of the most significant upticks I have seen. Like I said, the yuan moved to an all-time high. The yuan has advanced roughly 5% against the US dollar in just nine months. China also imported over 200 tons of gold for the most recent month. That is an extraordinary number. At that rate that’s over 2,400 tons of gold per year on an annualized basis.
This simply speeds up the point at which China will be the largest gold holder in the world. China saw gold come down and they didn’t just buy on the dip, instead they bought as much as the market would give them. And, again, you see the yuan going up so that is making the price of gold even cheaper for the Chinese.
It’s only a matter of time before the Chinese back the yuan with gold. This will push the yuan front and center as a key element in terms of being part of the world’s reserve currency basket. China gets the message. They are doing whatever it takes to establish their dominance in the world, particularly in the commodity arena. Their currency is flying and they are importing as much gold as they possibly can.

And without a doubt, China has been hoarding massive amounts of gold.  Everyone agrees on that.  But what nobody knows is exactly how much gold China currently has stockpiled, because China is not telling anybody.

One recent estimate put China's gold reserves at more than 7,000 tons of gold, but it could potentially be far higher than that.  When China does finally tell the rest of us how much gold they have, they will probably be just a move or two away from checkmate.

What we do know is that China is importing absolutely enormous amounts of gold right now even though China is also the number one gold producer on the planet.

According to Reuters, more than 223 tons of gold was imported into China from Hong Kong in March.  That smashed the previous record of 114 tons in December.

Overall, Chinese imports of gold from Hong Kong tripled in 2012, and the final number for 2013 is going to absolutely smash what we saw in 2012.

Obviously something is happening.

China is massively hoarding gold at the same time that it is trying to substantially raise the international influence of the yuan.

It doesn't take a genius to see where all of this is headed.

If China does decide to back the yuan with gold and no longer use the U.S. dollar in international trade, it will have devastating effects on the U.S. economy.  Demand for the U.S. dollar and U.S. debt would drop like a rock, and prices on the things that we buy every day would soar.  At that point you could forget about cheap gasoline or cheap Chinese imports.  Our entire way of life depends on the U.S. dollar being the primary reserve currency of the world and being able to import things very inexpensively.  If the rest of the world (led by China) starts to reject the U.S. dollar, it would result in a massive tsunami of currency coming back to our shores and a very painful adjustment in our standard of living.  Today, most U.S. currency is actually used outside of the United States.  If someday that changes and we are no longer able to export our inflation that is going to mean big trouble for us.

So keep an eye on China, and look out for any news about the yuan.

It won't happen next week or next month, but eventually we could see China back the yuan with gold.

When that happens, it is going to be a complete and utter financial disaster for the United States.

See the original article >>

13-year cycle about to turn the market around again?

by Chris Kimble

CLICK ON CHART TO ENLARGE

What does the 1974 low, 1987 crash and 2000 dot.com highs have in common?  They are some of the most important highs/lows in the past 40 years and they are 13-years apart!

13-years from the 2000 high is 2013! Will this 13-year cycle influence the markets with the Dow hitting dual resistance lines from 1987 and 2000 coming into play right now???

One of my favorite quotes is...."It's not the odds of something happening, its the impact if it does!"

Odds may be low that this 13-year cycle impacts the markets this year...if it does, the impact could be big since Margin debt levels are into the DANGER ZONE again! (See Margin debt)  First time margin debt levels were the highest in history? 13-years ago!!!

Stay tuned to see if the 13-year cycle has an influence this year!

See the original article >>

This pattern could really be bearish and stink for small caps!

by Chris Kimble

CLICK ON CHART TO ENLARGE

Shared the above chart on Stocktwits yesterday (see post here).

The Russell 2000 is up against a resistance line that has been important since the 2009 financial crisis and has formed a bearish rising wedge, which is breaking down.

This pattern could really end up stinking for small caps and could spill over into the broad markets!

See the original article >>

Will Market Swoon After The May Rally?

By George Leong

May was supposed to a dud, according to the Stock Trader’s Almanac. In 2012, the month of May was a disaster, with the Dow and the S&P 500 plummeting 6.21% and 6.23%, respectively. The technology and small-cap sectors fared even worse, with the NASDAQ and Russell 2000 giving up 7.19% and 6.74%, respectively, in May 2012.

Fast-forward a year, and this May has been blooming for the stock market. The key stock indices recorded excellent gains, with the NASDAQ staging its best month in over a year.

The reality is that in spite of several days of selling in mid-April, the current upward move in the stock market this year really hasn’t faced any hurdles, which is a surprise.

In fact, we have yet to see sustained selling or a down month this year, with the exception of the 0.42% decline posted by the Russell 2000 in April. Small-caps came back with a vengeance in May, advancing nearly five percent.

And there will likely be more highs and records in the stock market to come as long as the Federal Reserve and other global central banks continue offering easy money and driving down interest rates. And if 2012 is any indication, it’s looking like full steam ahead.

In 2012, the stock market staged a strong rally following the May meltdown, reporting gains in each month from June to September.

Now, I’m not totally convinced this pattern will happen again this year, but the investment climate as far as the economy and easy money is better than it was in 2012.

The only thing that concerns me is that I just don’t see the current rate of the stock market advance keeping pace. If this were to happen, the Dow would end up with a 41% gain, while the S&P 500 would have advanced 38%. Honestly, I don’t see this happening, which means we could likely see some hesitancy over the next several months—or at least a stock market correction of some meaningful magnitude.

I would view a stock market correction not as a red flag, but as a buying opportunity to jump in and accumulate additional positions. My belief is that this stock market is heading higher.

The only thing that could derail the bull market is the Fed, especially if it decides to pare down its bond buying, which would force longer-term yields higher.

In addition, I’m concerned about the bubble-like conditions in the Japanese stock market, where I feel stocks are extremely vulnerable to more selling. (Read “Why Nikkei Sell-Off May Foreshadow Things to Come.”)

Since trading at a high on May 22, the benchmark Nikkei index has faltered 10.7% and has breached its 50-day moving average, as shown in the chart below, based on my technical analysis.

Tokyo Nikkei Average Chart

Chart courtesy of www.StockCharts.com

What concerns me in Japan is the lack of solid buying following the 7.3% correction on May 23. Of course, Japan’s situation is vastly different from the U.S., since Japanese stocks were up 70% in just six months.

See the original article >>

Hog, cattle exports weak; trade anticipates demand data

By Rich Nelson

Sharing Services 0

Hogs: Though futures had a quiet day on Wednesday, we will note the April pork trade figures caused some discussions. The new figures released in the morning showed pork exports at 397 million lbs. Compared with last year, that was down 12%. We call that an improvement from the March numbers that were 18% lower. In addition, these numbers were made even with terrible exports to China and Russia (-39% and -99%, respectively). The trade will assume a slightly better-than-expected pace in April will also mean a slightly better-than-expected pace right now.

In shorter-term issues, we still have not seen that transition point yet where packers note cash hog prices have pushed too far compared with cash pork. That point certainly may come, but is not here yet. In beef, supply is a clear negative. In pork, it is the exact opposite. One thing both sides do share though is their hopes/concerns regarding consumer demand. Friday’s report on employment may shed a little more light on that subject…Rich Nelson

Cattle: Packers took a hard stance Wednesday with $121 bids posted in the morning. Compared with last week’s $124 trading, that would appear as though $1 lower trade this week is an easy assumption. That may have disappointed those looking for steady prices. Cattle feeders are asking $125. As there is generally a $2 drop from initial cattle feeder asking prices and actual trade, that would mean they are also ready to accept lower prices.

Wednesday morning’s release of April U.S. beef trade numbers may have been the reason. April U.S. beef exports, at 180 million lbs. were 13% lower than last year. That was down from the March numbers that were 3% under last year. Keep in mind these numbers were made with zero exports to Russia.

On the import side, we brought in 232 million lbs. in April. That was 9% over last year (March was 3% under). Sending out smaller amounts of exports and taking in more imports means more beef left in the U.S. for consumers.

On the wholesale beef end, we must also point out week to date action is $2.25 lower for choice and $2.57 lower for select. We should expect continued declines in cash cattle prices, from the $128 spring high, for at least another two to 12 weeks. We continue to suggest cash will reach down to $113 for the summer low and for August futures to hit $115. The factor that bulls are hoping for here is Friday’s employment report. If it shows another month of good numbers, the trade will adjust its consumer demand expectations a little higher. That could also encourage us to bring our downside targets higher (if it is bullish)…Rich Nelson

See the original article >>

The IMF: Magnanimous

By tothetick

Once upon a time, there was (and still is) the International Monetary Fund. Their story reads something like this. It’s not all make-believe; it actually happens.

It never ceases to amaze that we vote people into positions. Those people that we have voted in elect in turn (or just go ahead and appoint without an election, making it all look very transparent) other people who are not as important but who will have the possibility of choosing (apparently in an “open, merit-based, and transparent manner”) someone who will be more important than they are, but less important than the first person that is in the voting/appointment chain. If it’s getting complicated by now, that’s the whole point of it. It’s meant to look complicated from the outside, so that we all lose in interest in the last person that’s being appointed in the said chain. Then, we allow that last person to take decisions all around the world, dish out the dough and tell other countries that they have got it all wrong, imposing austerity here and there willy-nilly as if it has been decided over a croissant in some Washington D.C. Hotel. The, to cap it all, that person stands up last night and says something along the lines of: “sorry boys, we went a bit tough on you I guess”. But, hey, the damage is done now, so what are we going to do? The answer is probably little, as usual.

Christine Lagarde announced yesterday in a press statement following an International-Monetary Fund report released on the austerity program offered to Greece in 2010 and 2012, that mistakes had been made. It had failed to see the full extent that austerity would have on the Greek economy. In 2010, they provided 110 billion euros in a loan to keep the Greeks afloat. But, there was an obligation to restore the fiscal balance through the setting up of an austerity program as well as the privatization of state assets (to the tune of 50 billion euros). The privatization of assets took longer than had been planned and structural reforms were not being put into place, so the IMF provided another bailout of 130 billion euros (not all on their own, along with the Eurozone in both instances).

The present situation in Greece is pretty dire. Unemployment stood at 24.4% (2012) and has since increased to 27% in February 2013. That’s a rise from 17.4% from 2011.  Youth unemployment has hit 60% (aged 15-24 years old) and the country is being crippled by the austerity measures. Inflation was -0.6% in April 2013. The national debt of the country stands at more than 381 billion, clocking up more than 50 billion more each year in interest alone. The debt represents 189.19% of GDP today.

Neither the bailout of 2010, nor the one that took place last year to patch the wounds up did very much to help the Greeks out of their predicament. The only thing that the IMF did largely was to enable the setting of the scene to push the Greek people into such a corner that they would elect a far-right fascist party, the Golden Dawn. In 2012, the waning economic bailout measures that were not showing through in Greece resulted in the break-through by the Golden Dawn Party (7% in the elections), who vowed to turf the immigrants out of Greece and make the country good again. Of course, it’s the immigration problem, isn’t it? In Greece 1/5 of the population is from immigration. But, that’s not the problem. Why oh why do we always have to fall back on the scapegoat theory and choose the people that we want to blame for our own mistakes?

The IMF and the European Central Bank may have kept the Greeks in the Eurozone. But, it was at a price. Market confidence has not been restored and unemployment has continued to rise. The poorest in the country were hit and are still being hit the hardest. Of course consumer confidence hasn’t returned in a country where we still talk of ousting them from the Eurozone, and perhaps even the EU. We refer to them as one of the PIGS. Would you fancy being an ‘oinker’ in the family? Would that restore your confidence?

The contraction of the economy of Greece is beyond the IMF’s wildest nightmare-scenario situation. They thought it would contract by just 5.5%. It turns out that it’s more than three times that (17%). Wonderful mathematical wizardry. Calculations are not easy at the best of times, but in times of crisis , they are even harder.

Stories that begin by “one upon a time” are not always for children. The Greeks aren’t children, but the IMF belittled them. The IMF told them they had to do this and that they had to do that; and it was that which brought them down even more. But, they had to be publically punished to make sure that the others that were getting bigger around the world didn’t end up doing the same thing. Who in their right mind would ask the IMF now for money? You would have to be desperate, wouldn’t you? It would only plunge you further into economic disarray. What a botch-job by the IMF. Well done guys. Credibility just went (further) down the pan. What did you expect? But, what’s worse, the Greeks are the ones that are being hit the hardest at the moment. They have just taken another slap in the face from Ms. Lagarde. Isn’t it magnanimous to admit one’s mistakes? Absolution?

See the original article >>

China corn, soy imports to fall short of US hopes

by Agrimoney.com

China's imports of corn will grow over the next decade, but not by as fast as some other commentators believe, being outpaced by those of cheese, and not far ahead of beef, leading economists said.

The Organisation for Economic Co-operation and Development and the UN Food and Agriculture Organisation, in a much-watched annual outlook on world agriculture, highlighted that China, the world's most populous country, will become increasingly more dependent on food imports.

While annual demand growth will slow to 1.9% over the next decade, from 3.4% over the past 10 years, reflecting the extent of the improvement in diets already achieved, the rate of increase in production will slow too, to 1.7% per annum from 3.2%.

"China's consumption growth will slightly outpace its production growth," the report said.

"The challenge is clear - feeding China in the context of its rapid economic growth and limited resource constraints is a daunting task."

'Environmental stress'

Meeting demand will require large increases in imports of many agricultural commodities, including corn and oilseeds, as China struggles to maintain self-sufficiency in production of pork, its favoured meat.

Producing virtually all of its own pork "will be a challenge" even with a slowdown to 1.6% a year in growth in consumption.

"Management of land and water constraints, for example, will play a major role in China's ability to remain self-sufficient.

"In the next decade, China's pig population will rise to almost 550m head, further stressing the environment, often in areas surrounding cities."

'Strict control'

However, while imports of coarse grains – mainly corn – will more than double to 13.2m tonnes by 2022, that is a far smaller increase than observers including the US Department of Agriculture foresee.

The USDA predicts China's corn imports alone hitting 19.6m tonnes by 2022-23, with barley buy-ins reaching 3.3m tonnes on top.

The FAO and OECD said that annual growth in China's use of coarse grains would slide to 2.1% over the next decade, from 5.2% in the last, "largely because China will exercise strict control over the industrial usage of corn".

"Production of ethanol from maize will remain less than 1.5bn litres."

The groups were, relatively, downbeat on imports of oilseeds too, seeing growth to 82.8m tonnes in 2022 from 65.1m tonnes this year – representing a slump to 2.6% from 13.3% in the annual growth rate.

"Import growth should slow down compared to the last decade, on account of the deceleration in growth of the crushing sector, as demand growth for both protein meal and vegetable oil eases, from a higher base," the report said.

The USDA foresees China's imports of soybeans alone hitting 102.9m tonnes in 2022-23.

Trade prospects for China, as the top buyer of soybeans and prospectively a huge purchaser of corn, are particularly closely watched in grain and oilseed markets.

'Slow down significantly'

The OECD and FAO, which five years ago were among the first to highlight the potential squeeze on food supplies caused by population growth and productivity slowdowns which has fuelled the revival in the agriculture sector, were also downbeat on prospects for China's sugar imports, which they saw stagnating at about 2.5m tonnes a year.

Extra beet and cane plantings, and yield growth, will allow the country to meet most of its increasing demand.

"China's recent import growth should slow down significantly compared to the last decade, and remain below the peak reached in 2011."

Purchases, and production, of cotton will slow too as China's rising labour costs shrink its textiles industry.

"While domestic consumption of textile products is likely to increase, the intensification of competition in cotton spinning products, especially from India and other countries with low-cost labour, the use of cotton in China will decline," the report said.

Diary, beef booms

The FAO and OECD were more upbeat on prospects for dairy imports, with domestic milk production slowing to 2.4% a year, from 6.9% a year over the past decade, behind growth in many milk products.

Consumption increases will be "mostly driven by income levels and the growing influence of multinational companies, which are introducing new retail products and processing efficiencies, as well as government programmes that promote, for example, school milk consumption".

Cheese imports will soar by 10% a year to top 100,000 tonnes in 2022.

Imports of beef will also soar, as China's low consumption rates, of 4 kilogrammes per person per year, catch up with the average in OECD countries of 14 kilogrammes per person per year.

"Bovine meat will become the fastest growing [meat] import sector with a growth rate of 7% per annum."

See the original article >>

Follow Us