Wednesday, May 11, 2011

Our Ninja System Is One Of The Best Trading Systems Of Strategy Runner!


Capitale Iniziale Minimo $ 50.000 / Minimum Account Size $ 50K
Durata media dei trades 6-7 Giorni / Avg Trades Duration 6-7 Days
Mercati su cui lavora il system / Used Markets
1 eMini S&P
1 eMini Russell
1 Gold
2 eMini Crude Oil
1 Euro Fx
1 T-Bond

Ninja System

Investors Don’t Turn Out the Lights on Commodities Just Yet


The prices for many commodities suffered the worst week in recent memory last week. Oil prices dipped below $100 per barrel, gold fell below $1,500 an ounce and silver gave back much of the past month’s gains by falling to the $35 an ounce level. The prices for other commodities such as sugar, tin, nickel, aluminum, lead and copper also pulled back.

Immediately, headlines on websites such as Marketwatch, Bloomberg and SmartMoney read “Has the Commodity Bubble Popped?” and “Imploding Commodities Complex.”

Is this the end? Has the great bull run for commodities come to an end?
In our opinion, not likely.

First of all, we wrote on April 24 that commodity prices were due for a pullback (Read: Don’t Fear a Pullback in Prices). Specifically, we pointed out that silver had wandered into “extreme” territory which exacerbated the reversal we saw this week. 

On May 3 (before we saw the largest declines), BCA Research wrote “one look at the hyperbolic rise in silver prices should be sufficient to convince even a hardcore commodity bull that things are getting frothy.”

In fact, the silver trade had gotten so far ahead of itself, the iShares Silver Trust ETF was “the most highly traded security on the planet,” according to our friend Tom Lydon over at ETF Trends. Last week’s selloff was less of an end to the bull market and more a function of “stampeding speculators” (to borrow a line from Sarah Turner at Marketwatch) rushing for the exits.

But short-term speculators aren’t the only factor; last week’s strength in the U.S. dollar was just as much a facilitator of the price declines. The U.S. dollar found additional strength on Thursday after Jean-Claude Trichet, president of the European Central Bank (ECB), said the ECB would not raise rates until after June. By week’s end, the U.S. dollar was up 2.5 percent for the week, a pretty big move.

In addition, we entered the month of May which has historically proven to be a weak and volatile period for commodities. With the Federal Reserve set to wind down its quantitative easing (QE2) program by the end of next month, it’s possible we could continue to see volatility for a little while.

Despite the selloff, commodities were still the year’s top performing asset class as of Thursday. You can see from the chart that the year-to-date return for commodities has far outpaced the return for foreign exchange, bonds and emerging markets.


Looking out on the horizon, very little has changed for the long-term bull case for commodities. The U.S. is still struggling to come up with a feasible solution to its multi-trillion dollar debt problem. Emerging markets are still seeing incremental increases in demand for nearly all commodities. And, the reserves for many commodities are still struggling to keep pace with this demand.

Essentially, what happened last week was more of a “technical correction” than a fundamental shift in the long-term dynamics for commodities and we’ve already begun this week with big gains for silver and crude oil prices.

The party’s not over for commodities, so don’t turn out the lights just yet. While it’s impossible to predict the future, we think in a month or two investors may look back and see this downdraft as a good buying opportunity.

See the original article >>

COMEX Drops Nepalm Bomb on Silver, What Next for Precious Metals?

By: David_Banister

What was I thinking trying to forecast a normal "wave 4" correction in Silver without the required insider information that the COMEX was going to raise margin/equity requirements four times in a week? My pullback silver low target of $40.10 was obliterated after two consecutive days of equity requirement increases early last week, knocking silver into the low 33's before it got off the mat and staggered around a bit. Gold followed right behind as margin calls and stop losses required over- zealous traders on the long end to liquidate everything they could find to avoid complete meltdown of their trading accounts.

That is all well and good, but now all of my subscribers want to know just one thing...what now? For starters, Silver had completed an A B C rally pattern from around $18.50 in late August to $49.90 about eight Fibonacci months later. I had written about that coming rally late last August with Silver at $18.73, so we were prepared for the opportunity. I even looked for long term targets as high as $45. That rally was pure crowd behavior in motion, and when you reach the extremes of a "C Wave" in optimism, the next leg down (Which I call the "D wave") is extremely difficult to predict. I trade A-B-C patterns all the time, looking for that imminent "C wave breakout", and last August I forecasted a huge move in Silver mostly because a very long B wave triangle had just about completed, and the powerful C wave rally was nigh.

Now that we ended that rally by touching the all time highs near $50 from 1980, it was clear we would have a corrective pattern, and the problem was trying to come up with a reasonable "Crowd Behavioral" bottom pivot forecast amidst the COMEX interfering. This D wave ended in catastrophe for those who were over exposed, or shall I say... "Greedy". You know what they say on Wall Street, Hogs get fat and pigs get slaughtered. Well, for those who want to dip their toe back in the water, here is the likely path going forward.
  1. I expect Silver to recover over several months and re-attack the $50 zone again.
  2. Silver will get past $50 by year end and probably reach $60 before the next strong correction.
  3. With three years left in the Gold and Silver bull cycle from 2001, there is a very good chance silver will be well north of $100 an ounce by 2014, but one week at a time.
I do not trade Silver or Gold futures, and never have... I just forecast direction and price as best as I can for my subscribers. Probably one of the reasons I've been lucky and accurate for many years is I have no bias, as I am not forecasting my own book... just what I see. Near term look for Silver to try to rally back to about $38 to $41.50 ranges, with another pullback to follow.


Gold should have bottomed at $1462 in what I call an "A wave" down, with the "B wave" currently bouncing to about $1520 if I'm right. Once this bounce is completed, I look for a soft pullback to $1489 or so, followed by a strong rally to re-test the $1577 highs. Gold should reach a minimal target of $1627 on this final 5th wave up from the January 1310 lows, with potential to spill higher than that. 

Silver has tripped on itself for now, and Gold will probably move a tad smoother over the near term, but look for Silver to regain it's sprinting abilities this summer-fall and re-take the baton from Gold and continue it's out-performance.

See the original article >>

US wheat sowings hit low, while corn seedings fly

by Agrimoney.com

Spring wheat planting slowed to its weakest pace since at least the early 1990s in the US, and to a trickle in Canada too, even as America's corn farmers – in one week - sowed an area equivalent to Denmark and Switzerland combined.
Just 22% of US spring wheat was in the ground as of Sunday thanks to the wet conditions which continue to dog northern areas. In North Dakota, the main spring wheat state, just 7% was seeded compared with an average of more than one-half by now.
The overall figure compared with 61% typically sown at this time, and was the lowest since at least 1994, the earliest year for which readily available US Department of Agriculture data are available.
Indeed, it fell behind the pace of 1997, which has been reported as setting a record slow pace, and when yields fell 15% to 29.9 bushels per acre.
In 1995, another slow year for plantings, the yield ended higher, at 32.2 bushels per acre, but below the 1990s average of more than 34 bushels per acre.
Late snows
The pace was even slower north of the border, where Canadian farmers have planted 3% of their overall spring crops, compared with 40% by now, following snowfalls of up to 25cm, or 10 inches, on some areas two weekends ago. On farms where moisture fell as rain, precipitation reached 5.0cm.
Rain and "moderate temperatures have combined to stymie the general commencement of seeding across the Prairies", the board said, adding that the poor sowing conditions were affecting "all western Canadian growing regions".
However, while weather looks set to remain poor for Manitoba and Saskatchewan, "a high pressure system may keep Alberta sunny throughout the week, which could prompt widespread and rapid seeding in that province".
'Second fastest on record'
The fate of spring wheat farmers contrasted with that of corn growers who, following a drier spell in much of the Corn Belt, lifting sowings to 40% of their intended crop as of Sunday.
The 27% of the crop sown in one week equates to an area of nearly 25m acres, or nearly 39,000 square miles – bigger than Hungary or South Korea.
The progress was well above trade estimates of seedings reaching aruond one-third complete, and saw farmers play catch up towards average rates.
"Iowa farmers made the most progress, jumping from 8% to 69% complete, the second fastest weekly pace behind 64% completed in one week in 1992," Kim Rugel at Benson Quinn Commodities said.
East vs west
And the progress was achieved despite wet weather continuing to hamper progress in eastern areas, with farmers in Indiana, Michigan and Ohio having less than 5%of their corn in the ground, compared with one-half typically by now.
"What is remarkable about this week's progress is that it was accomplished with basically no participation by eastern Corn Belt states," Steve Meyer at Paragon Economics said.
"Flying into Detroit International on Monday afternoon, it did not appear that eastern Michigan would catch up any time soon. There was a lot of water standing in fields."
The eastern Corn Belt is due to receive "periodic rain events" throughout this week, Benson Quinn added.
In the six-to-10 day forecast, weather models indicate "scattered showers with cool temperatures over the eastern Corn Belt, while the western Corn Belt and Plains stay dry", weather service WxRisk.com said.

See the original article >>

Market Shakes Off a Rough Start to May

by Bespoke Investment Group

After a rough start to May where the S&P 500 declined in each of the first four trading days of the month, equities are back in rally mode. As of today's close, the S&P 500 is trading back at overbought levels, and only three sectors are not trading above their normal trading ranges. The sectors that are not participating, however, are noteworthy. While we have all come to expect Financials to underperform, the recent underperformance of Energy and Materials, which had been among the market's leaders, is indicative of the shift taking place in market leadership.


S&P 500 Breadth Back at New Highs

by Bespoke Investment Group

As mentioned in our prior post, the S&P 500 has quickly shaken off the weakness to start the month of May. Although the index is still 1% below its 52-week high, breadth readings suggest that new bull market highs are in the cards. As shown in the chart below, with today's rally the S&P 500's cumulative A/D line is now back to new bull market highs.


Why the U.S. Dollar is Ready to Rebound, Anatomy of an Inflection Point


Jack Barnes writes: For most of the past year, anything involving the U.S. dollar has been what traders like to refer to as a "one-way trade."

And with good reason: Over the past year, the U.S. currency has traded in only one direction - down.

Indeed, during the period in question the dollar is down 8.3% against the British pound, 11.65% against European euro and 14.2% against the Japanese yen. On a year-over-year basis, the biggest gains against the dollar have been notched by the Australian dollar (20%) and the Swiss franc (26.7%). 

This freefall by the greenback is part of the reason that gold and silver soared to new records and commodity prices have zoomed during the past year (before their decline in the past week).

But here's the thing: This nosedive by the dollar is ending - with a U-turn that's going to send the U.S. currency into a zooming climb.

Traders refer to this abrupt reversal-of-fortune pattern as an "inflection point." 

And those traders recognize this about-face in the U.S. dollar for exactly what it is: A windfall profit opportunity for investors who understand just how to play it.

Anatomy of an "Inflection Point"
Since June, when it achieved its most recent peak, the U.S. dollar - as measured by the benchmark U.S. Dollar Index (DXY) - plunged more than 14%. 

The greenback has rallied a bit in the early part of this month. But there are much bigger gains to come - the kind of gains associated with a true financial asset "inflection point."

To understand the about-face that we're about to experience, it's important to understand there were essentially five factors that tipped the greenback over into its nose-dive. Those factors included:

•A Debt-Intent Central Bank: A big part of the demise in the near-term value of the U.S. dollar was the continuation of a U.S. Federal Reserve monetary policy that caused the central bank's balance sheet to balloon from $850 billion in 2007 to a new all-time high of $2.669 trillion in April of this year. Indeed, the Fed's balance sheet grew by $340 billion during the last year alone.
•A Debt-Addicted Federal Government: Global interest in the dollar was further diminished by a U.S. federal debt load that soared from $8.9 trillion on Aug.1, 2007 (when the first signs of distress really hit the financial markets) to $14.298 trillion just 3.7 years later.
•A New Market Rival: Thanks to some market machinations by China's government -which has caused that country's yuan (renminbi) currency to rise slowly against the U.S. dollar while dropping against China's other trading partners - the U.S. currency has grown progressively weaker. This has been driven by Chinese interventions in the so-called "FX" (foreign-exchange) markets on an almost-daily basis.
•A Global Leadership Vacuum From Washington: It's a sad-but-true fact that the United States no longer commands the respect that it once did on the world stage. And much of that is the fault of Washington, which has lost touch with what's important both here at home and abroad. This lack of respect has helped diminish the "reserve status" of the U.S. dollar, leading to a bit of a run on the American currency.
•The ‘Mortage-Backed Securities" on the Fed's Balance Sheet Fueled the Real Dollar Collapse: That real dollar collapse arrived as the implications of the Fed's monetization of MBS holdings hit home. In simple terms, people around the world have felt that America's central bank was debasing its own currency with the purchases of mortgage-backed securities (MBS) from U.S. banks that had been left holding the bag for some horrid trades. The Fed handed those bankers freshly minted U.S. Treasury bonds.

With each of these preceding five factors at work, it's little wonder that the United States was essentially debasing its own currency - leaving the leaders of other countries to watch as they scratched their heads in rueful disbelief.

In reality, Wall Street has been able to talk Washington into just about anything it needed - even though most of these schemes robbed Main Street consumers of their middle-class buying power. The obvious debasement of the American currency reached the point internationally that investors wanted to own anything but the U.S. dollar.

The accompanying graphic illustrates how investors have abandoned the dollar as they fled into other asset classes over the past year.


You only have to look at the results for a few seconds to see that the reserve status of the U.S. dollar was being abrogated. It didn't hit the lows it reached during the depths of the global financial crisis but it got darned close.

Now, however, the inflection point is upon us.

Time For a Trend Reversal?
The reality of a "one-way" trade opportunity - which underscores the sharpness of an "inflection point" - is that they persist until they don't. I think of this as the "inflection moment," the point at which investors realize that they've ridden the trade as far as they can, meaning it's time to cash out and book their profits.

This is usually represented by a giant shift in investor sentiment. In the case of the U.S. dollar, it was the monetization of our national debt - to fund the deficit spending of the last two administrations - that destroyed the trust in the U.S. dollar. This single action, once boiled down, has carved off the U.S. dollar's buying power.

But now - with the dollar at a potential inflection point - should the Fed shift away from its currency-debasing policy, this could well prove to be the market bottom. That means the greenback will build on the early rebound move that we've already seen. Markets bottom when selling pressure abates. 

At some point, the net selling pressure will abate as sellers run out of ammo, and the market switches to net buying pressure. It doesn't matter if it is FX, commodities, stocks or bonds. At the margin, trading is where real price discovery happens. 

You can see the different signs showing up in different places, if you know where to look.

.Five Inflection-Point Signals
During my time as a hedge-fund manager, I discovered five indicators that, taken together, provide a pretty reliable signal that a dollar reversal - an inflection point - is at hand.

When viewed individually, these indicators aren't that significant. But when they all shift at once, it's a pretty powerful hint that a new trend is afoot - and that windfall-profit opportunities are there for the taking.

To anticipate a reversal in the current decline of the dollar, you should:

•Follow the U.S. Dollar Index (DXY): Despite its travails, the greenback remains the world's most-reliable reserve currency, which also makes it one of the very best indicators of raw market sentiment. If the index (as a proxy for the actual currency) establishes a bottom, you can bet change is afoot.
•Watch Commodity Exchange Margin Requirements: As volatility increases, something we normally see in advance of an "inflection point," exchanges will rein in risk by increasing margin requirements. As we've seen with silver - a commodity that stumbled after margin increases in recent weeks - these shifts in the regulations can have quite an impact on speculation and on prices - dampening both.
•Follow the (Big) Money: Pacific Investment Management Co. LLC's Bill Gross is the largest bond-fund manager in the world. Gross' buying or selling can get a market moving in a new direction quite easily. So when he opted to dump all his U.S. Treasury bonds recently, investors took note.
•Never Forget the Fed: When the U.S. Federal Reserve needs to change its direction, it will send out a plethora of independent Federal Reserve presidents, or governors, to reshape market expectations.
•Watch Dollar-Denominated Assets: The capital markets can be boiled down into a couple of major asset classes, which will trade either with - or against - one another. The U.S. dollar is the single-best example of this. Commodities are priced in dollars.

So let's look at each of these five in a bit more detail:

•The Dollar Index: When the dollar does start to strengthen, it will unfold over a period of months, giving you plenty of time to make your move. Commodities will be directly affected: As the dollar increases in value, the cost to purchase them should start to shrink. If you are an investor with a long-term outlook, a lot of damage can be done to your portfolio while you wait for the next commodity-bull-market-move to return.
•Commodity Margin Requirements: The Chicago Mercantile Exchange (Nasdaq: CME) changed margin rates on silver futures 10 times in the last six months or so. In early November, the CME Group's Comex Division permitted a leverage level ratio of 28-to-1 on futures contracts already held. Today, after five margin increases in silver in the last two weeks, the CME is now offering leverage of about 8-to-1. In my field, this is called "leverage compression," and it was likely one of the primary reasons that silver topped the way that it did - "spiking" up, and then down.
•Big Money Moves: PIMCO's Gross is in a unique position. He manages the world's largest bond fund, which has morphed into the world's largest mutual fund. The so-called "King of Bonds," as he was known during the "Great Bond Rally of 1983-2010," is now out of U.S. Treasuries. This is a "screaming Buy" alert to anyone who pays attention to the "big picture" in terms of top-down investing. In fact, at the end of April, the PIMCO Total Return A Fund (MUTF: PTTAX), was 4% short on U.S. Treasuries via swaps in that "world's largest bond mutual fund," according to Reuters. This extreme change in sentiment is a tacit illustration of his expectations for the direction of the U.S. Treasury yield curve over the near-term to medium-term time horizon. Historically, Gross has been great at calling inflection points in the market. The only way his trade will make sense is if the U.S. Federal Reserve makes a surprise quarter-point increase in the benchmark Federal Funds rate - which would set the stage for a long-term series of rate increases in the future. While 25 basis points is insignificant in the big picture, it is a major change in sentiment and one that would have serious implications for the future structure of the U.S. bond market.
•Never Forget the Fed: When the central bank decides to change its stance, markets will move. While hawks on the policymaking Federal Open Market Committee (FOMC) have started to sound off about a stronger U.S. dollar, this group lacks the votes, which has kept the market from fearing their comments. If and/or when the sentiment within the FOMC changes to favor an increase in rates (or even a "bias" in that direction), then all market biases will change. If you want an example, the best one to review is one from 1994, and the steady state of small, incremental increases that the market endured during the period. Stock prices were challenged, and bond values were hammered.
•Watch Dollar-Denominated Assets: If the dollar is in a downward-trading pattern, there is little reason to fear that your long commodity positions will be hurt. If the U.S. dollar changes direction, you can expect that the longer-term commodity-price trends will experience a change, too. That may not happen overnight. But "at the margin" all commodities are a "short" U.S. dollar trade, meaning they represent a bet against a rising dollar. In other words, if I am leveraged long gold, I am realistically making a leveraged short U.S. dollar trade.

Moves to Make Now
Now that we know what to look for, it's time to talk about how to profit - at least in a general sense. (Future stories in this Money Morning series, "The Inflection Point," will provide many specific dollar-rebound profit plays to help readers navigate this tricky stretch.) But for you to understand what we'll be talking about, you need an overview of the kinds of profit plays we'll be looking for and talking about.

When the U.S. dollar bottoms, you can expect to see commodities pull back in price. You can expect to see margins expand in businesses that consume high levels of raw commodities. International shipping companies should see their profit margins improve. 

Investors, companies and governments around the world use U.S. dollars as their "reverse" currency. When the dollar changes direction, it impacts the economy of the whole world. In the near future, having reached this "inflection point," the dollar will change its bias direction. And when it does so, every investment or investment strategy that used to work in the global financial markets, no longer will.

Now is the time to prepare your portfolio to the coming change in bias - the inflection point. You'll be glad that you did.

See the original article >>

IMPORT PRICES FLASH WARNING SIGN

By Lance Roberts

This morning the Bureau of Labor Statistics released the Import Prices for the recent month.
“Overall import prices increased 2.2 percent for a seventh straight month of gains, the Labor Department said, slowing from a 2.6 percent increase in March. The increase was, however, above economists expectations for a 1.8 percent rise”
While the headlines downplay the importance of rising import costs as investors this is something that we want to pay close attention to.

Rising import costs are an additional pressure on the cost of manufacturing and production. As imports rise the issue becomes at what pace can those costs be passed along to the consumer. As we have already written about several times in the past rising costs to the consumer are an additional tax on an already over leveraged and burdened consumer. Corporations has done a fantastic job of increasing productivity and while keeping employment low which has boosted the profitability of companies over the last two years as input costs plunged with the rest of the economy. However, that tailwind is now dissipating as import costs rise and companies lack the ability to continue to layoff workers and cut overhead costs have also vastly diminished.

As you can see in the attached chart whenever import costs rise above 5% on a year over year (YOY) basis the economy tends to slow. During the recovery from 2004-2007 import prices did rise above 5% without immediately impacting the economy due to the massive amounts of leverage and liquidity readily available to the consumer which allowed input costs to passed along. However, that was unsustainable and eventually the consumer cracked under it owns weight. Today, the excess liquidity and leverage is NOT available to absorb rapidly rising input costs so it is not surprising that we saw the 1st Qtr GDP number come in at 1.8% and now see most of the Wall Street houses scrambling to lower full year GDP expectations. These rising import prices don’t bode well for 2nd Qtr GDP and we are now revising our 2nd Qtr GDP estimate to below 2% as well.


See the original article >>

IS GLOBAL GROWTH PEAKING MID-YEAR?

By Rohan Clarke

OECD leading indicators were released Monday (here) and are signalling that global growth remains on the front foot – though it’s likely to be peaking by mid-year:
In the US, growth was heading towards a cyclical high relative to trend, but again looks likely to peak over the next three months:
Interestingly growth out of China looks to be regaining some momentum:
While in the Euro area, growth has already peaked and is likely to struggle on in the face of the ECB interest rate rise.
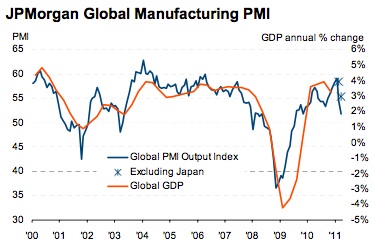
Finally, as a counterpoint to the OECD’s data, following is the latest JPMorgan Manufacturing PMI (from Markit here) that hints at the same sort of conclusion – that the global growth rate has peaked but remains in expansion mode.

See the original article >>
Four Guys Walk up to a Copper Mine Field…


Copper is important because it is considered by many to be a market tell. I explored whether this is true or not two months ago in the story linked below. But whether you believe in the correlation long term or not is irrelevant if the collective market does. So what does Copper have to say for itself? Let’s look at it from four different perspectives.

Point and Figure

copper PnF stocks
The simplest interpretation is the Point and Figure chart. Above is a standard 3 Box Reversal chart with 4 point box size for Copper. If you are not familiar with Point and Figure charts they look at price movement solely, without regard to time or volume or anything else. This chart shows Copper in a downtrend since it broke the Triple Bottom by printing the ‘O’ in the 404.0 box. The price objective for the breakdown is 384.0.

Andrew’s Pitchfork

copper pitchfork e1304978738844 stocks
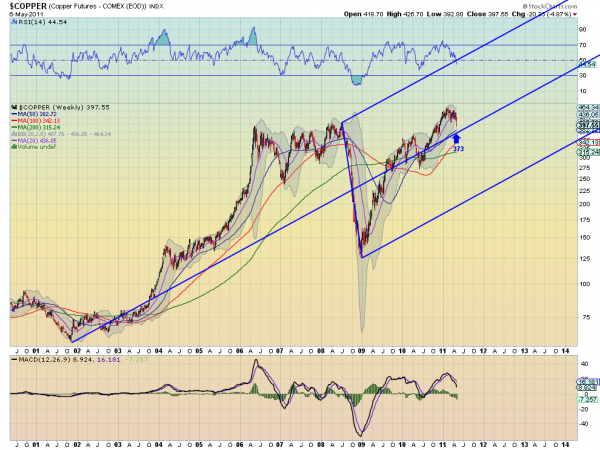
Also a clean chart technique the Andrew’s Pitchfork has been working well in the metals complex lately. The basic premise is that the tines of the Pitchfork or Median Lines, attract the price. This chart shows that Copper rose from the Lower Median Line at the beginning of 2009 to the Median Line and has been contained in the gravity of that line since. It is now being pulled back to the Median Line which is currently at 373. You can see that it can overshoot the Median Line like it did in mid 2010 so 373 is not a price objective.

Elliott Wave Principles

copper e1304979663488 stocks
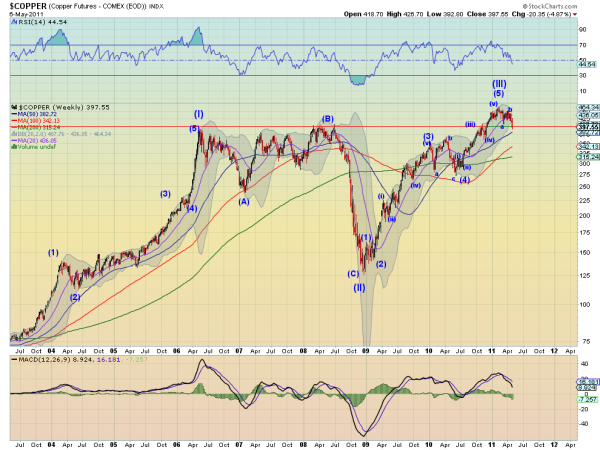
Contrary to what the media would have you believe Elliot Wave is used by people besides Robert Prechter and does not always give a doomsday scenario. Elliott Wave Principles applied to the Copper chart show that it is in the corrective Wave (IV) of the Primary Motive Wave higher. It is not clear if it is in the intermediate wave c (as the chart shows) or still in wave a. Either one points to more downside. Wave (II) and Wave (IV) often have different characteristics so since Wave (II) was an expanding wave then Wave (IV) can be expected to be more sideways as it has been. Not a rule but an observation. This would mean that the correction does not have much more to go lower.

Fibonacci

copper fibs e1304980754220 stocks
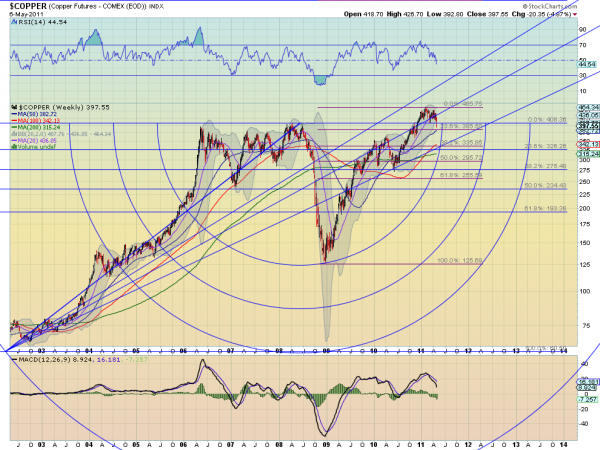
This one is a bit more crowded with two sets of Fibonacci retracement levels (Levels), Fibonacci Arcs (Arcs) and Fibonacci Lines (Lines). The blue Levels and the Arcs and Lines are generated from the low at 60.50 in 2001 and trace to the top at 408.36 in mid 2008. the purple Levels are from teh correction low to the recent high. You can see the Lines roughly bounding the move higher from mid 2009 until the throw over when Copper broke to new highs late last year. Also that the Arc was support at the low at the end of 2008 into 2009. As the price bounces back below the 100% Level on the blue lines it is moving through time toward the Arc again. This view shows the purple 23.6% Level coming into play as potential support at 385.50 and then a drop to 335.85 below that.

So four different perspectives, but each one sees Copper heading lower with targets of 384, 373 and 385.50 at least. One final note that each time chart also had the Relative Strength Index (RSI), Moving Average Convergence Divergence (MACD) indicator and Bollinger Bands on it. The RSI and MACD both also suggest more downside and the Bollinger bands which had been squeezing are now expanding to allow for a run. These indicators suggest that maybe the price objectives above are not the end of the fall. What do your charts say?

China’s Currency and Trade Balance: Two Pictures


The US-China Strategic and Economic Dialog is underway. [0] The topics span many issues. One of the perennials is the yuan’s real value and the Chinese trade balance. Here are two figures.

First, one needs to recall the distinction between bilateral and multilateral real exchange rates.
cnypix1 economy
Figure 1: Log real CNY/USD exchange rate (blue) and log real value of CNY (red), 3 month trailing moving average, both normalized to 2005=0; up is appreciation of the Chinese currency. Dashed line at 2005M07 (China depegs). Source: St. Louis Fed FREDII, IMF IFS, and author’s calculations. 

The figure highlights that the CNY is appreciating in real terms (see this post for a discussion of the components due to nominal appreciation and due to inflation). The bilateral appreciation is actually more marked than the multilateral. I think this phenomenon partly reflects the fact that it was becoming increasingly difficult to maintain the previous policy configuration, and (as I observed here) faster appreciation was going to become increasingly harder to resist.

The correlation of the CNY value with Chinese trade balance (with the world) is shown in Figure 2.
cnypix2 economy
Figure 2: Annualized 12 month trailing moving average Chinese trade balance (bn USD) (dark blue), and log real value of CNY (red); up is appreciation of the Chinese currency. Dashed line at 2005M07 (China depegs). Source: St. Louis Fed FREDII, IMF IFS, ADB ARIC, and author’s calculations. [updated 7:45am]

The trade balance has shrunk considerably. How much is due to exchange rate movements is the subject of an ongoing research project, although some results are reported here. The World Bank predicts the 2011 trade balance will be roughly the same in dollar terms, at around $250 billion (so shrinking as a share of GDP), shrinking to around $200 billion, before rising again in 2012 to around $230 billion.[1]

So in my view, some rebalancing is being effected. [2] [3] Whether it’s enough remains to be seen.

See the original article >>
Follow Us