Wednesday, June 26, 2013

5 Ways You'll Lose Money in the Next 5 years

By: Submissions

Richard Moyer writes: We live in strange times. There are unimaginable amounts of money at stake, and someone is going to lose big, and that someone could be you. Here are the biggest risks that I see on the horizon.

1. Bond Funds

Rates can only rise, so values can only fall.

It's number one for a reason. If you have bond-based mutual funds in your 401(k), you have some crazy risk going on. The reason being, interest rates are basically the lowest they've been in the history of civilization, and this means bond prices are peaked out. There's almost no going up, because interest rates can't get much lower. Sell now, invest in moldy ox hooves, lead paint for kids, anything but bonds.

The worst part about these bond funds is that almost everyone over 50 has been automatically funneled into these funds by employer provided 401(k)s. Ask your loved-ones and friends if they have lots of bonds in their portfolio.

2. Adjustable Rate Mortgages

Monthly payment goes boom.

For God's sake, get a fixed-rate mortgage yesterday. As with the previous article, interest rates are the lowest they've been in nearly forever, they can't reasonably get lower, so if you wait, all you can do is lose. How do you know if you have an adjustable rate mortgage? Check your paperwork, and if you see the abbreviation "ARM" anywhere, you might have one of these "exploding mortgages".

3. Municipal Bonds

Retail investors are often shepherded toward municipal bonds for their tax-free status and decent yield. However, recent news has shown that pensions take a front seat to bond holders in the event of municipal bankruptcy. Expect to see a lot more municipal bankruptcies like Stockton's as interest rates ratchet up, and the monstrous debt racked up by municipalities comes due. Rising interest rates will also mean whatever "good" bonds you hold will have a lower sales price if you are ever forced to sell.

Municipal bonds are popular with retirement plans, so check and see if you are buying these without even knowing it.

4. Home Equity

Mortgage rates are bargain basement. That means house payments are low for any given sales price. That means home prices can be high and people can still afford the payment. For instance, a $150,000 30-year mortgage at 3.5% has a monthly payment of around $675. If mortgage rates rise to only 6%, $675 a month only buys $113,000 of mortgage.

Since the monthly price is what most homebuyers are limited by, the selling price will have to fall.

5. Annuities

Annuities are very popular with retirees, and if you're not into managing your money, annuities are tempting. You throw your money in, and you are locked into a safe, predictable income stream. Right now, though, annuities are as bad a deal as they can get. Since borrowing money is so cheap, why would a financial institution pay you handsomely to "borrow" yours? They won't.

If you hang until interest rates rise a little, the deal you get when you buy an annuity will be better.

See the original article >>

Gold Has Had a 34% Correction

by Jesse

Here is a chart from Tom Fitzpatrick at King World News that I thought put this into some perspective. 
It is certainly worth reading his commentary, and I produce only his first chart with the rest to be seen at the source. With last night's selloff that correction is probably more like 35% or so but that does not alter the chart pattern.  He also shows his long term chart on silver.
I took the liberty of circling the secondary cup and handle that was the consolidation before that last big leg to the upside top. This is what I was referencing last night. I had not realized at that time it was a 34% top to bottom correction. I was setting down to do the longer term chart today when I came across this, and it is well done.
That secondary cup and handle consolidation marked a big resistance level that thereafter became big support after having been exceeded.
I am waiting to see what happens here.  This is a very 'purposeful' correction with selling that is blatantly timed to move prices lower in quiet markets.  But the overall timing matches with the new lows in deliverable bullion at the COMEX and the TOCOM.
Big corrections like this are not unusual in bull markets.  That huge correction in 2007-2008 cleared out the market and set up the move to the high. 
I do think that such corrections represent 'asset stripping' by powerful and lightly regulated insiders and traders who have a free hand to obtain assets on the cheap after manipulating prices lower, and then allowing them to rise again.  But who can say, except for someone like a regulator with access to the relevant information.
These sorts of action disrupt normal market operations and allocation of capital that may inhibit future supply. But it is too much to think that these jokers would care as long as they are making money.
One serious caveat is that since we are in a 'currency war,' at least to some peoples' thinking, one can only rely on market-oriented things like charts so much.  As I said, the selling is obviously purposeful.  And there are contentious issues being discussed by the world powers behind the scenes.

See the original article >>

Marc Rich, fugitive commodities trader in 1980s, dies at 78

By David Henry

Marc Rich, left, and author Daniel Amman pose on Dec. 11, 2008. (Source: Bloomberg)Marc Rich, left, and author Daniel Amman pose on Dec. 11, 2008. (Source: Bloomberg)

Marc Rich, the commodities trader who fled the U.S. to avoid federal indictments during the 1980s before President Bill Clinton pardoned him two decades later, has died. He was 78.

The businessman with a taste for flamboyant neckties and Cuban cigars was celebrated for inventing the spot-oil market and later became one of the most wanted white-collar fugitives in American history for 17 years. After leaving the U.S., he founded a commodities trading company that became the forerunner of today’s Glencore Xstrata Plc.

Rich died in a hospital near his home in Switzerland early today, spokesman Christian Koenig said by telephone.

Rich fled to Switzerland hours before being indicted in 1983 on more than 50 counts of wire fraud, racketeering, trading with Iran during an embargo, and evading more than $48 million in U.S. income taxes. The charges stemmed from a multimillion- dollar chain of U.S. crude oil deals that roiled the global petroleum industry in the early 1980s.

On the last day of his presidency in January 2001, Clinton pardoned Rich, who repeatedly maintained his innocence.

“We bought the oil, we handled the transport and we sold it,” Rich said of his Iran dealings during an interview for the 2009 book “The King of Oil: The Secret Lives of Marc Rich” by Daniel Ammann. “They couldn’t do it themselves, so we were able to do it.”

Commodities Empire

Rich ran a multibillion-dollar empire that stretched from Russian nickel mines through Malaysian tin deposits and into trading rooms in London, Hong Kong and New York. He owned a fleet of oil tankers, counted former U.S. Secretary of State Henry Kissinger and opera tenor Placido Domingo as friends, lived in a $9.5 million home on Spain’s Costa Brava coast and even co-owned 20th Century Fox studios. He donated generously to charities and museums in Switzerland and Israel, and helped bankroll the Jamaican Olympic team and Zurich Opera.

Rich co-founded commodities company Marc Rich & Co. in 1974, which was renamed Glencore International AG 20 years later when he sold his 51 percent stake. Rich’s firm was where Ivan Glasenberg, who was part of the $1.2 billion management buyout and is now chief executive officer of Glencore Xstrata, learned the commodities trade.

Great Pioneer’

“We are saddened to hear of the death of Marc,” Glasenberg said today in an e-mailed statement. “He was a friend and one of the great pioneers of the commodities trading industry, founding the company that became Glencore. Our deepest sympathies and condolences are with his family at this time.”

Rich’s exact fortune was a mystery, though his assets were estimated at more than $1.5 billion. He was ranked No. 937 in Forbes magazine’s list of world billionaires published in 2010.

Eventually, Rich’s companies pleaded guilty to 35 counts of tax evasion, paying $90 million in fines, leaving the commodities trader known through the industry as “el matador” for his ability to avoid disaster facing a potential prison term of more than 300 years if he ever returned to the U.S.

The pardon drew sharp criticism. Former U.S. Department of Justice officials involved in prosecuting Rich characterized it as “outrageous” and “disgusting.” Rudolph Giuliani, who was a federal prosecutor when Rich fled, said he was shocked by the presidential order and called for a congressional investigation into the matter by the House Government Reform Committee.

On Run

Sandy Weinberg, the U.S. prosecutor who spent years investigating the scope of Rich’s global oil and commodity empire, said “the act of trading with the enemy is so egregious in itself, and indicative of the kind of attitude Rich and his companies had in relation to being good citizens of the U.S.”

Rich, who held U.S., Spanish and Israeli citizenship at various times, spent about two decades dodging a team of U.S. marshals and international executives who operated under the codename Otford Project. The group was tasked with bringing Rich back to the U.S.

At the same time, the U.S. government continued to conduct business with Rich and his companies. In 1985, congressional investigators discovered that Rich’s Swiss-based grain operation, Richco, had racked up almost $100 million in sales through an Agriculture Department subsidy program designed to help foreign nations purchase U.S. wheat and barley.

Government Deals

In 1988 and 1989, investigators learned that a Rich- controlled company named Clarendon sold almost $30 million of nickel, copper and zinc to the U.S. Mint and that the Interior Department had approved a request from the government of the U.S. Virgin Islands that allowed Rich to finance its purchase of a $45 million alumina plant in St. Croix.

Rich was born on Dec. 18, 1934, in the Belgian city of Antwerp as the only child of David Rich and Paula Rich-Wang, according to his website. Fleeing the Nazi occupation of Europe, the Jewish family emigrated to the U.S. in the early 1940s where Rich’s father opened a jewelry store in Kansas City, Missouri.

Rich attended E.F. Swindon Elementary School, Westport Junior High School and Southwest High School in Kansas City. When his father decided to start a jewelry business on East 11th Street in New York, Rich went to Forest Hills High School and then Manhattan’s Rhodes School. A teacher’s report from Rhodes in 1952 described Rich as “purposeful, actively creative, strongly controlling, deeply and generally concerned, assuming responsibility and exceptionally stable.”

Father’s Businesses

The family moved to Queens, New York, in May 1950, where David Rich opened Melrose Bag & Burlap Co., which imported Bengali jute to make burlap bags. Rich’s father then started an agricultural trading company and helped found the American Bolivian Bank with partners he worked with previously.

Marc Rich began a business degree at New York University, dropping out in 1954 to work at trading company Philipp Brothers, where he later helped run operations in Bolivia, Cuba and Spain. He remained there until 1974 when he founded Marc Rich & Co. with Pincus Green, trading commodities until the 1983 indictment on evading taxes and violating a trade embargo.

Rich founded companies based in the low-tax Swiss canton of Zug after fleeing from U.S. authorities. He also received three honorary doctorates, from Bar-Ilan University, Ben Gurion University and Tel Aviv University for his philanthropic work.

Rich was married twice, divorcing New York songwriter Denise Eisenberg in 1996. They had three daughters, one of whom died of leukemia at age 27. He was divorced from second wife Gisela Rossi and is survived by his daughters Ilona Schachter- Rich and Danielle Kilstock Rich.

See the original article >>
Coffee finds buyers as sellers wait for prices to rise

By Jack Scoville

COFFEE

General Comments: Futures were higher again in recovery trading, with speculators seen on both sides of the market.  Trends in all three markets are down after the price action late last week.  However, futures also got to or close to the final down side objectives for the down trend, so it is possible that the market can continue to try to rally this week.  Arabica cash markets remain quiet right now and Robusta selling interest has become less, as well.  Most sellers, including Brazil, are quiet and are waiting for futures to move higher.  Buyers are interested on cheap differentials, and might start to force the issue if prices hold and start to move higher in the short term on ideas that the market made a bottom.  Brazil weather is forecast to show dry conditions, but no cold weather.  There are some forecasts for cold weather to develop in Brazil early next week, but so far the market is not concerned.  Current crop development is still good this year in Brazil.  Central America crops are seeing good rains now.  Colombia is reported to have good conditions.

Overnight News:  Certified stocks are higher today and are about 2.749 million bags.  The ICO composite price is now 114.46 ct/lb.  Brazil should get dry weather except for some showers in the southwest.  All areas could get showers early next week.  Temperatures will average near to above normal.  Colombia should get scattered showers, and Central America and Mexico should get showers, with some big rains possible in central and southern Mexico and northern Central America.  Temperatures should average near to above normal.  ICE said that 26 delivery notices was posted against July today and that total deliveries for the month are now 749 contracts.

Chart Trends:  Trends in New York are down with no objectives.  Support is at 117.00, 116.00, and 113.00 September, and resistance is at 122.00, 123.50, and 125.00 September.  Trends in London are mixed.  Support is at 1720, 1705, and 1680 September, and resistance is at 1765, 1775, and 1800 September.  Trends in Sao Paulo are down with no objectives.  Support is at 140.00, 137.00, and 134.00 September, and resistance is at 148.00, 151.00, and 155.00 September.

COTTON

General Comments:  Futures were higher as political and economic leaders in the US and China moved to calm markets that had been moving sharply lower in the last few days.  Ideas of better production conditions in the US caused some selling interest.  Ideas of better weather in US production.  USDA showed that conditions in some areas got better while conditions in other areas got worse and this supported markets.  Texas is reporting dry weather again.  Dry weather is being reported in the Delta and Southeast as well.  The weather should help support crop development in the Delta and Southeast, and could help in Texas as some areas of the state saw good rains last week.  Weather for Cotton appears good in India, Pakistan, and China.

Overnight News:  The Delta and Southeast will see some light showers this week.  Temperatures will average near to above normal.  Texas will get dry weather.  Temperatures will average above to much above normal.  The USDA spot price is now 81.43 ct/lb.  ICE said that certified Cotton stocks are now 0.587 million bales, from 0.576 million yesterday.  ICE said that 59 notices were posted today and that total deliveries are now 1,205 contracts.

Chart Trends:  Trends in Cotton are mixed to down with no objectives.  Support is at 85.10, 84.00, and 82.80 October, with resistance of 86.00, 86.90, and 88.00 October.

FCOJ

General Comments:  Futures closed lower and broke some important support areas on the charts as weather remains mostly good in Florida.  Better weather in Florida seems to be the big problem for the bulls at this time.  Futures have been working generally lower as showers have been seen and conditions are said to have improved in almost the entire state.  Ideas are that the better precipitation will help trees fight the greening disease.  No tropical storms are in view to cause any potential damage.  Greening disease and what it might mean to production prospects continues to be a primary support item and will be for several years.  Temperatures are warm in the state, but there are showers reported somewhere in the state every day now.  The Valencia harvest is continuing but is almost over.  Brazil is seeing near to above normal temperatures and mostly dry weather, but showers are possible next week.

Overnight News:  Florida weather forecasts call for showers.  Temperatures will average near to above normal.  Nielsen said that domestic retail sales of orange juice were 39.89 million gallons, down 4.2% from the previous four week period.  

Chart Trends:  Trends in FCOJ are down with objectives of 130.00 and 119.00 July.  Support is at 132.00, 130.00, and 125.00 July, with resistance at 136.00, 137.50, and 139.00 July.

SUGAR         

General Comments:  Futures closed higher on follow through buying and as July goes off the Board on Friday.  Some in the Sugar market are talking more and more about a low forming in this area.  Ideas are that Sugar prices are cheap enough that many refiners are now making ethanol and not Sugar.  The Indian monsoon is off to a good start and this should help with Sugarcane production in the country.  But, everyone is more interested in Brazil and what the Sugar market is doing there.  Traders remain bearish on ideas of big supplies, especially from Brazil.  Traders in Brazil expect big production as the weather is good.  Demand is said to be strong from North Africa and the Middle East.  Sugar refiners in Brazil are concentrating on producing Ethanol and not Sugar, so down side overall might not be that extreme and any moves lower this week might be chances to buy for at least a short term move. 

Overnight News: Showers are expected in Brazil, mostly in the south and southwest.  Temperatures should average near to above normal.

Chart Trends: Trends in New York are mixed to up with objectives of 1770 and 1820 October.  Support is at 1715, 1700, and 1665 October, and resistance is at 1760, 1770, and 1790 October.  Trends in London are up with objectives of 495.00 October.  Support is at 487.00, 484.00, and 478.00 October, and resistance is at 499.00, 503.00, and 508.00 October.

COCOA        

General Comments:  Futures closed higher.  There was not a lot of news for the market, but some are worried about dry weather developing in western Africa right now and there is a lot of smog in Southeast Asia.  Ideas of weak demand after the recent big rally kept some selling interest around.  The weather is good in West Africa, with more moderate temperatures and some rains.  It is hotter and drier again in Ivory Coast this week, but the rest of the region is in good condition.  The mid-crop harvest is about over, and less than expected production along with smaller beans is reported.  Malaysia and Indonesia crops appear to be in good condition and weather is called favorable.

Overnight News:  Scattered showers are expected in West Africa.  Temperatures will average near to above normal.  Malaysia and Indonesia should see episodes of isolated showers.  Temperatures should average near normal.  Brazil will get mostly dry conditions and warm temperatures.  ICE certified stocks are lower today at 5.021 million bags.  ICE said that 20 delivery notices were posted today and that total deliveries for the month are 148 contracts.

Chart Trends:  Trends in New York are mixed to down with no objectives.  Support is at 2140, 2105, and 2080 September, with resistance at 2200, 2230, and 2250 September.  Trends in London are mixed to down with objectives of 1380 and 1270 September.  Support is at 1420, 1360, and 1320 September, with resistance at 1450, 1470, and 1490 September.

See the original article >>

The Single Largest Driver of the US Economy is About to Collapse

by Graham Summers

The markets continue their dead cat bounce while the economic data worsens.

First quarter US GDP was revised down from an annual rate of 2.4% to 1.8%.  The drop was due to lower personal consumption expenditures than initially forecast.

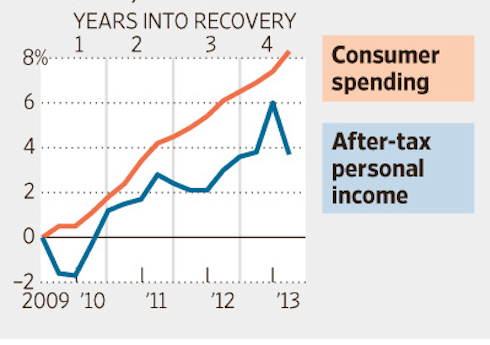
This is the crux of the US’s current economic woes: consumer-spending accounts for roughly 70% of our GDP. And QE does nothing to help incomes, which drive consumption.

The US Federal Government has subsidized a weak economic recovery via food stamps and other social program, but the private sector is lagging with most of its hiring coming in the form of temporary or part-time jobs.

The Wall Street Journal ran this graphic yesterday. Anyone who is banking on consumers to continue spending as they have is out of their mind. I’ve been warning Private Wealth Advisory subscribers of this for weeks.

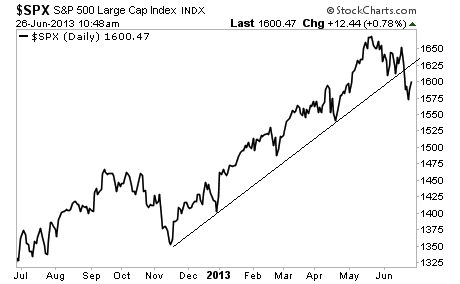
Regarding the stock market, it’s important to note that all market collapses follow a similar pattern of:

1)   The initial drop breaking support

2)   Bouncing to re-test support

3)   The larger drop

The S&P 500 has completed #1 and is now in #2:

This move could take us as high as 1,625. However, if the market fails to reclaim its trendline we’re going down as far as 1,500 in short notice. And if we take out that level we’re in BIG TROUBLE.

This is just the start. I warned Private Wealth Advisory subscribers in our most recent issue that higher rates were coming noting a collapse in bonds in Europe and the emerging market space.

This could easily become truly catastrophic. The world is in a massive debt bubble and the Central banks are now officially losing control. The stage is now set for a collapse that could make 2008 look like a joke.

See the original article >>

Can we still anticipate a record U.S. soybean crop?

By Sholom Sanik

Back in April, early forecasts for a record 2013-14 US soybean crop pushed prices down far enough for even die-hard bulls to declare lights out on the bull market. It was a given that the coming record crop would replenish low inventory levels that had resulted from strong domestic and foreign demand.

Initially, the wet spring that hampered corn planting was not viewed as problematic for soybeans, because its planting window closes much later. But as the planting season dragged on without any significant progress, traders began to worry that the crop would be planted late enough to extend the growing season into frost season.

As of the most recent crop progress report, 92% of the crop has been planted, compared with 99% last year at this time and the five-year average of 95%. Those numbers don’t tell the whole story, though. About a third of what’s been planted just made it into the ground over the past two weeks. Last year the crop had been almost completely planted several weeks previously. At this point, a disaster has been avoided, but the shorter growing season will give bears something to worry about throughout the summer.

The June crop report maintained its May estimate for the 2013-14 US crop at 3.39 billion bushels. The jump in the estimate for ending stocks, to 265 million bushels, up from a record low 125 million bushels, or 4% of consumption, can hardly be an accurate reflection of current developments and will almost certainly be revised downwards in the coming months.

The forecast for record average national yields of 44.5 bushels per acre is very courageous, given how late the crop was planted. The only time US yields were even close to that level was in 2009-10. Excluding that season, the five-year average yield was 41.28 bushels per acre. While the excessive precipitation was certainly beneficial, particularly after subsoil moisture was compromised during last year’s drought, it is a very optimistic estimate.

The quarterly stocks report, scheduled for release on June 28, will be important to determine how strong domestic consumption has been and just how tight old-crop ending stocks will finish up the marketing year. The accompanying acreage report will be far more significant, though, because it is a more accurate reflection of how many acres farmers planted.

One other note on the domestic front: Soybean oil received a new lease on life when Congress instituted biodiesel incentives early last year, which included a $1-per-gallon tax credit. The USDA estimates that soybean oil usage for biodiesel will grow during the 2013-14 marketing year to a record 5.4 billion pounds, 10% above 2012-13 usage. That represents 27% of total U.S. soybean oil consumption. To put that in perspective, consider that as recently as 2009-10, only 8.7% of U.S. soybean oil was used as biodiesel.

The outcome of the U.S. growing season is crucial after U.S. supplies for the 2012-13 marketing year have been all but depleted, as illustrated. New-crop prices will certainly gyrate with the inevitable threatening weather forecasts, but there is no real urgency.

Brazil and Argentina have produced record crops of 85 million tonnes and 54.5 million tonnes, respectively. That’s up from 83 million tonnes and 51 million tonnes the previous year. Global ending stocks are estimated at 73.69 million tonnes, or 27.3% of consumption. That is just shy of record burdensome stocks we saw in 2006-07 and 2010-11. Although that figure is highly tentative, because US acreage and yield estimates are probably already too high – not to mention the unknown of the weather in July and August – it is still likely to be a substantial improvement over the past two seasons, when the global carryover averaged only 22.5% of usage.

To some degree, current price levels have factored in the overly optimistic USDA estimate for the US crop. Perfect weather will erase any price gains in a hurry. On the other hand, bears are also at the mercy of the weather. The upcoming USDA quarterly stocks and acreage reports, as well as the July monthly crop report, will incorporate much more up-to-date information about old-crop supplies and prospects for the new crop.

See the original article >>

Economy in U.S. grew less than projected in first quarter

By Shobhana Chandra

The economy in the U.S. grew less than previously calculated in the first quarter, reflecting less spending on services by consumers who were trying to make ends meet after taxes rose.

Gross domestic product expanded at a revised 1.8% annualized rate from January through March, down from a prior estimate of 2.4%, figures from the Commerce Department showed today in Washington. Household purchases, which account for about 70% of the economy, were revised to a 2.6% advance compared with the 3.4% gain estimated last month.

Households cut back on travel, legal services and personal care expenditures and also curbed spending on health care as the two percentage-point increase in the payroll tax caused incomes to drop by the most in more than four years. A housing rebound and improving job market will probably help revive purchases in the second half of the year, one reason economists project the economy can withstand the automatic government budget cuts.

“We just got off to a slower start than expected,” said Maury Harris, the New York-based chief economist for UBS Securities LLC, who projected a 2.1% advance in GDP. “The second half will be better,” he said, because banks are making it easier to borrow.

Stocks rose, sending the Standard & Poor’s 500 Index higher for a second day, as China’s cash crunch eased. The S&P 500 climbed 0.7% to 1,599.81 at 10:15 a.m. in New York. The yield on the benchmark 10-year note fell to 2.53% from 2.61% late yesterday.

Survey Results

The median forecast of 82 economists surveyed by Bloomberg called for a 2.4% rise in GDP, the value of all goods and services produced, the same as the Commerce Department previously estimated.

Forecasts ranged from 1.6% to 2.6%. The government’s GDP estimate is the third and final for the quarter. The economy grew at a 0.4% annualized pace in the last three months of 2012.

Last quarter’s increase in consumer purchases was still the strongest in two years, and followed a 1.8% gain in the fourth quarter of 2012.

The revisions showed household spending in the category of other services, which includes tourism, legal help and personal care items such as hair cuts, dropped in the first quarter from the previous three months. Outlays on health care services grew at a slower pace than previously projected.

Income Slumps

Disposable income adjusted for inflation fell at an 8.6% annualized rate, the biggest drop since the third quarter of 2008. The decrease reflects the increase in the payroll tax.

The smaller gain in spending helped boost the saving rate to 2.5% in the first quarter, compared with an initial estimate of a 2.3%.

Businesses such as 3M Co., a St. Paul, Minnesota-based manufacturer, are among those seeing steady household demand. Consumers are spending on home improvement in addition to purchases of products such as Post-it Notes and Scotch Tape, according to 3M’s Chief Financial Officer David Meline.

“We do expect some modest improvement as we go through the year based on a view that the economy is going to continuously show some improving resilience,” Meline said at a June 12 conference.

Fiscal Policy

Sustained gains would allow the economy to better cope with the fallout from $85 billion in fiscal tightening and the lagged effect from a two percentage-point jump in the payroll tax that went into effect at the start of 2013.

Given the restraints, growth will cool to a 1.7% pace this quarter before advancing at a 2.3% in the last three months of 2013 as the fiscal headwinds fade, according to the median forecast of economists surveyed by Bloomberg this month.

Federal Reserve forecasts for growth this year and next are more optimistic than those in the Bloomberg survey. The central bank will probably taper its $85 billion in monthly bond buying later in 2013 and halt purchases around mid-2014 as long as the economy performs in line with its projections, Chairman Ben S. Bernanke told reporters on June 19 after policy makers’ two-day meeting.

Bernanke’s View

“If the incoming data support the view that the economy is able to sustain a reasonable cruising speed, we will ease the pressure on the accelerator by gradually reducing the pace of purchases,” Bernanke said at the press conference in Washington. “However, any need to consider applying the brakes by raising short-term rates is still far in the future.”

It may be a few months before it becomes clear how the economy will adapt to the volatility in the stock and bond markets generated by the prospect of a wind-down in Fed stimulus, economists said. At the same time, a recent surge in borrowing costs may slow the residential real-estate recovery rather than derail it, they said. Purchases of new homes jumped in May to a five-year high, figures showed yesterday.

“If the rise in rates continues indefinitely, that will have an effect over time,” Dean Maki, the New York-based chief U.S. economist for Barclays Plc, said before today’s report. “But for now, housing is in solid shape.”

Rising home prices are likely to keep boosting Americans’ wealth and their ability to spend. Values of existing properties in 20 U.S. cities in April posted the biggest year-over-year gain since March 2006, according to S&P/Case-Shiller data.

The automobile industry continues to be a bright spot as May sales indicated it is on course for the best year since 2007, which in turn is encouraging automakers to invest and hire. Ford Motor Co. said it is adding 2,000 workers and a third shift at its F-150 factory in Missouri to increase production of pickups beginning in the third quarter.

See the original article >>

Three Trend-Bucking Picks

by Tom Aspray

The stock market rebound Tuesday helped calm the very nervous bulls, and the futures are higher again in early Wednesday trading. This rebound can clearly go further but the daily technical studies still suggest that this rebound is likely to be followed by another round of selling.

The good news is that the seasonal pattern does favor a higher market in early July, and secondly, not all stocks or industry groups bottom at the same time. Though one does not want to be an aggressive buyer when the market is still correcting, one should not miss an opportunity to put their high cash levels to work.

In this type of environment, I look for stocks or ETFs where the weekly OBV confirmed the most recent highs and those that are outperforming the overall market. This ETF and both of these stocks meet this criteria and should be bought at the right price but not chased.

chart
Click to Enlarge

Chart Analysis: The SPDR Regional Banking ETF (KRE) has assets of $1.49 billion and currently yields 1.78% with an expense ratio of 0.35%. Its is quite diversified with over 70 regional banks and the top ten holdings make up less than 20% of the fund.

  • The daily chart shows that it completed its flag formation (lines a and c) with Tuesday’s close.
  • The formation has initial upside targets in the $35 area.
  • The breakout has been confirmed by the technical studies as the relative performance broke through resistance, line d, last Thursday.
  • The RS line is rising very sharply and the weekly (not shown) is also positive.
  • The volume was heavy Tuesday as the OBV has slightly overcome the resistance at line f.
  • The weekly OBV is also holding well above its rising WMA so the OBV multiple-time-frame analysis points higher.
  • There is initial support at $32.40 to $33 with stronger at $31.40-$31.80.

MB Financial Inc. (MBFI) is a $1.41 billion regional bank headquartered in Chicago that currently yields 1.6%.

  • The daily chart shows a trading range, lines h and I, since early May.
  • This is likely a continuation pattern that will be resolved to the upside.
  • The initial upside targets are in the $28-28.50 area, which corresponds to the 201 highs.
  • In 2008, MBFI traded as high as $44.41.
  • The daily relative performance has already broken through its resistance at line j, indicating it is a market leader.
  • Last week there was a big-volume day, and the OBV has just moved above the resistance at line k.
  • Both the week RS and OBV analysis (not shown) are also positive.
  • Initial support at $25.40-$25.80 and then in the $24 area.

chart
Click to Enlarge

M&T Bank MTB +1.65% Corp. (MTB) is a $13.83 billion northeast regional bank holding company that currently yields 2.60%. It closed strong Tuesday as the May 22 high was overcome.

  • MTB has been in a trading range, lines a and b, for the past eight months.
  • A close above $108 would be an upside breakout with upside target from the formation in the $119-$120 area.
  • In early 2007, MTB made a high of $125.13.
  • The relative performance has broken its long-term downtrend, line c.
  • The RS line is well above its rising WMA and the weekly (not shown) is also positive.
  • The daily OBV is now testing its resistance, line d, and shows a positive uptrend (line e).
  • The weekly OBV (not shown) closed above its WMA last week.
  • There is initial support at $106-$106.50 with monthly support for July at $102.76.

What it Means. The weekly and daily analysis of this ETF, as well as these two banks, does indicate they are likely to be the market leaders in the coming months. If our buy levels are not hit today, then they may be on the next pullback in the overall market.

The SPDR Regional Banking ETF (KRE) looks the most attractive because of its diversification. MB Financial Inc. (MBFI) has some good upside potential if you can get long before it breaks out to the upside, but I would only buy M&T Bank Corp. (MTB) on a decent pullback.

How to Profit: For SPDR Regional Banking ETF (KRE), go 50% long at $33.11 and 50% at $32.46, with a stop at $31.63 (risk of 3.5%).

For MB Financial Inc. (MBFI), go 50% long at $25.86 and 50% at $25.48, with a stop at $24.28 (risk of 3.5%).

For M&T Bank Corp. (MTB), go 50% long at $105.62 and 50% at $104.57, with a stop at $99.33 (risk of 5.5%).

See the original article >>

Still Waiting For The Gold Rally, The Good News Bears

By: HRA_Advisory

Gold continues to struggle and so do explorers.  I am seeing encouragement in the trading of some discovery stories but this is a very small subset of the junior sector.  

I think the precious metals markets are well set up for a rally but gold rallies don’t usually happen in the summer.   It’s still possible but I don’t think a rally strong enough to drag the juniors along for the ride can be assumed in the short term.

I will continue to focus on discovery and potential discovery stories. The lack of well-funded companies with targets I really like means I haven’t been adding new names to the list recently.   I don’t see that changing soon.   In a low liquidity bear market no one wants to get stuck with the wrong stock.  There are a handful of situations that look interesting but I’m waiting for the market to come to me. If that happens those of you on the SD list will hear about it first.

Most of the companies I have been concentrating on are either drilling or will be before the next issue is out.  That is where the rubber meets the road for this type of speculation.   We’ve had one work out and I’m hoping to see other successes before much longer.  The summer doldrums are almost upon us but companies that announce important discoveries will still get attention.

Markets just keep getting stranger.   Traders are obsessed with guessing when the US Fed will start to taper their QE program. This has been generating a lot of counterintuitive trading.  

The US economy continues to post positive economic readings though it looks like things may be slowing a bit.
It’s clear market participants don’t think the US economy is strong enough yet to advance without prodding by the Federal Reserve.  Every comment by a member of the Fed Open Market Committee (voting or not) sends markets stampeding one way or another.  Volatility levels are high.  A lot of retail money recently entered the markets for the first time in years.   It will be interesting to see if the wild swings during the last couple of weeks are too hard on their nerves.

The overwhelming concerns about QE or no QE can be seen in the reaction to major economic readings through the last month.   In a “normal” market that has seen the sort of move the S&P 500 has the past few months any sort of negative or even contradictory economic reading would be a disaster.  That certainly hasn’t been the case lately.

The US employment report for May is a perfect example.  The US economy produced 175k jobs in May, slightly higher than the consensus estimate of 165K jobs.  Revisions to March and April data basically accounted for the amount above consensus.   Normally this would have produced a flat or down session in the markets as traders who bet on a strong reading exited.

Instead of that we got a huge rally in equities and a pummeling (again) for gold.  Most mainstream finance sites credited an employment report that “beat consensus” for the rally.  I think a widespread belief that the job gains would not be strong enough to convince the Fed to cut QE was the real reason stocks soared.

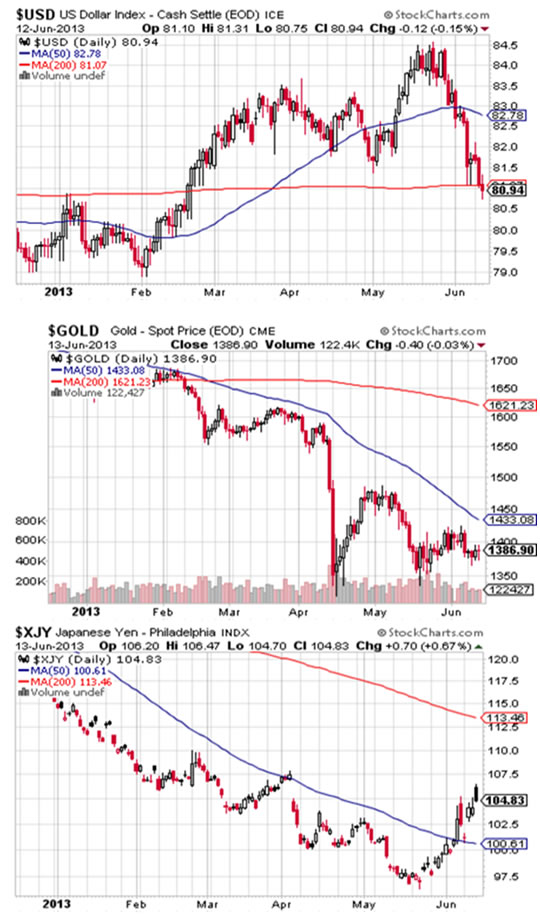
The charts above show recent action in the gold, $US and Yen markets.  Gold has continued to struggle, which is not comforting given the looks of the $USD chart.  

The Dollar Index has put in what looks like an important top, losing 4% and dropping below its 200 day moving average.  At least some of this is due to the bounce in the Yen.  Traders closing Yen short/Dollar long positions certainly accounts for some of the move.  It’s also part of the reason precious metals have reacted so weakly to the Dollar move.

Another trade that may be affecting the Dollar is a move out of US Treasuries. It’s hardly a stampede but yields on 10 and 30 year treasuries have increased by a third (from a record low base, admittedly) in the past month or so.   This too is a reflection of traders betting on how and when the Fed exits QE.

I can’t read Bernanke’s mind any better than Wall St traders can but I’m not convinced he’s as close to pulling the trigger as many assume.   Swings in the markets are making the decision that much harder.   The Fed Open Market Committee is well aware of the impact this move will have.   They want to time it to ensure the change in QE buying does not become a self-fulfilling prophesy that crashes bond markets and takes Wall St down with it. 

Based on comments by Bernanke he is looking for at least a 200k per month increase in employment for several months running.  We haven’t got that yet.  Job growth is still light and the jobs being created are mainly low quality ones.

See the original article >>

Changes in the Chinese Economy That Will Alter Your Investment Strategy

By Sasha Cekerevac

We are all aware that the global economy is still relatively stagnant, running below optimal gross domestic product (GDP) levels. Specifically, the Chinese economy is not only experiencing a slowdown in growth, but also a liquidity crunch.

One of my concerns regarding the Chinese economy over the past couple of years has been the rampant increase in credit and loose lending standards. Because the Chinese economy has become such an integral part of the global economy, if imbalances within that nation aren’t addressed, this will lead to further speculative boom-and-bust cycles.

Last week, the interbank lending rate, which is the interest rate banks charge when they lend to each other, spiked to 13.44%. This compares to an average of 3% over the past 18 months. Since last week, the interbank lending rate has fallen back to 6.48%; still, concerns are mounting over liquidity constraints. (Source: Wassener, B., “Asian Markets Falter After Central Bank Statement,” New York Times, June 24, 2013.)

The global economy has relied too much on excess credit for growth and an increase in debt over the past decade. We have seen what happens with too much credit when the U.S. housing market crashed a few years ago.

But the Chinese central bank did not step in initially when the interbank lending rate skyrocketed. That is a sign to both banks and companies in China that they will not necessarily be bailed out without suffering costs associated with poor lending practices.

It’s a sign of China’s new leadership, which is trying to shift the Chinese economy into an increasingly domestically oriented economy built on lower levels of debt. The focus on lower levels of lending should lead to a stronger long-term Chinese economy.

However, the process of deleveraging is never easy, and in the short term, there are many painful steps that need to be taken. Because the Chinese economy has grown to be so large, those people who think it can continue growing at 10% or more per year clearly don’t understand the law of large numbers and the limits to growth.

As a country becomes a larger part of the global economy, it can only maintain a certain level of national growth. As the Chinese economy tries to shift to a more stable footing, it will naturally lead to lower levels of economic growth. That situation is much like the one here in the U.S., where the economy cannot grow at a pace faster than approximately three percent without serious consequences, even though the U.S. is still a leader in the global economy.

The chart for the Dow Jones Shanghai Index is featured below:

Dow Jones Shanghai Index Chart

Chart courtesy of www.StockCharts.com

Even though the actions being made by leaders in China will be beneficial in the long run, the short-term pain for companies in the Chinese economy can be quite severe; in fact, that pain is causing many investors to sell their shares of Chinese stocks and sit on the sidelines.

Because credit is now beginning to be reduced through higher interest rates that raise costs, the Chinese economy will have lower levels of overall growth. But that growth will be on a much more solid footing.

The real question is: can the Chinese economy sustain a deleveraging process without too much damage to the global economy? Unfortunately, that is an incalculable variable because so much lending within the Chinese economy is not done through official channels, but rather through shadow lending facilities.

I certainly would not be foolish enough to try to predict the full extent of the debt that has been built up by corporations and local governments within the Chinese economy—but I do know that it is quite substantial. And while I think it’s a positive effort for the long run that the Chinese leaders are trying to reduce this leveraging within the Chinese economy, the pain that will initially be felt by the global economy could be substantial.

We are still in the early stages of this transitional shift within the Chinese economy; therefore, I will need to see several more months of data before being able to calculate the true extent of the impact this shift in China will have on the global economy.

See the original article >>

What Higher Mortgage Rates Mean in the Real World

by Charles Hugh Smith

Rising mortgage rates reduce household purchasing power just like higher taxes and inflation.


Mortgage rates have jumped significantly in the past few weeks, from 3.50% at the beginning of May to the current rate of 4.875% for conventional Fannie Mae mortgages.

These are the two rates quoted by a mortgage broker in Mish's recent post on rising mortgage rates.
Here is the repayment summary for both rates courtesy of mortgagecalculator.org:

I plugged in these parameters, basing them on the average cost of a new home and a mid-range property tax rate:


$360,000 home value, $300,000 mortgage, annual property tax rate of 1%, interest rate of 3.50%:


Monthly Payment: $1,647.13

Total of 360 Payments: $592,968.26

Total Interest Paid: $181,968.26

Total Tax Paid: $108,000.00

Interest rate of 4.875%: This is an increase of 1.375%, which represents a 39% increase over the initial rate of 3.50%.

Monthly Payment: $1,887.62

Total of 360 Payments: $679,544.88

Total Interest Paid: $271,544.88

Total Tax Paid: $108,000.00


The monthly payment rose by $240.49, or 14.6%. While unwelcome, that in itself doesn't seem like much.

But look at the lifetime cost increase: $86,576, all extra interest of course.

This relatively modest increase in mortgage rates to a still low by historical metrics 4.875% will reduce the purchasing power of the household by $240. Over time, $86,000 in additional interest payments will be transferred from the household to the lender/ owner of the mortgage.

We are constantly told inflation is near-zero, but a decline in purchasing power is equivalent to inflation. If one's labor buys fewer goods and services, then saying inflation doesn't exist is merely a semantic victory.

In other words, the $240 reduction in the household purchasing power due to rising rates has the exact same effect as inflation that reduced the household's monthly income by $240/month.

For context, here is a chart of mortgage debt. The total debt has declined for a number of reasons, including writedowns due to defaults and foreclosures and the decline in housing prices, which reduced the size of new mortgages:

Over time, rates on the roughly 48 million outstanding mortgages in the U.S. will rise. There are still millions of adjustable rate mortgages out there, often second mortgages or home-equity lines of credit (HELOCs). Those will start ticking higher in the months ahead.

$240 a month ($2,880 a year) may not seem like much, but multiply that by a million, and then by many millions, and the number starts becoming consequential: that money is no longer available for consumption or investment. Rising mortgage rates reduce household purchasing power just like higher taxes and inflation. That means there is less household income to spend on other things, and that's not good for "growth."


See the original article >>

Gold plunge not met by stronger physical demand

By Ben Traynor

Spot market gold fell to its lowest level since August 2010 Wednesday, trading as low as $1,224 an ounce, as stocks rallied along with the dollar following better-than-expected U.S. economic data a day earlier.

By Wednesday lunchtime in London, gold in dollars was trading around 4% down on where it started yesterday's London session.

The euro gold price also hit a fresh three-year low this morning, dipping below €940 an ounce, as did gold in Sterling which traded as low as £797 an ounce.

In contrast with April's price drop, gold's recent fall has not been met with a surge in demand for physical bullion, Asian dealers report.

"We have not seen a substantial increase in demand," agrees Victor Thianpiriya, commodities analyst at ANZ Bank. "We are going through a whole bunch of stop losses...the liquidity issue in China is also hurting sentiment," he adds, referring to the recent spike in short-term interbank borrowing rates in Shanghai, which saw China's central bank yesterday step in with short-term lending to keep interest rates at a "reasonable level".

The world's largest gold exchange traded fund SPDR Gold Trust (ticker: GLD) saw outflows totaling 16.2 tonnes of bullion yesterday, taking total holdings down to their lowest level since February 2009 at 969.5 tonnes.

"This is a seriously large daily decrease and shows the general lack of demand for gold as an investment tool at the moment," says David Govett, head of precious metals at brokerage Marex Spectron. "All in all, these are not happy times for the precious metals markets and for the time being I remain happy to sell rallies."

"There has been 550 tonnes of gold sold out of ETFs since mid-February," adds Bernard Dahdah, precious metals analyst at Natixis. "That's the equivalent of saying we've added to the gold market an additional 11% on top of 2012's gold [mining] output."

On the currency markets, the euro fell to a three-week low against the dollar this morning, with the U.S. currency strengthening following the release of positive economic data yesterday.

European stock markets meantime extended yesterday's gains during Wednesday morning's trading, following gains a day earlier for U.S. markets following better-than-expected data on U.S. durable goods orders, home prices and consumer confidence.

"The first leg of the correction [in stocks] is close to over and the markets should be more stable going into month end," says Jean-Paul Jeckelmann, chief investment officer at Banque Bonhote & Cie. in Neuchatel, Switzerland.  "The Chinese central bank's liquidity pledge has calmed markets in the short term, but the picture is not that clear in the medium term."

Silver meantime dipped below $18.50 an ounce this morning, as with gold its lowest level since August 2010.

Over in India, the world's biggest source of private gold demand, jewelry maker Rajesh Exports said Wednesday it expects its sales and earnings to grow 10% during the current financial year. This is below previous expectations, with the dip the result of India's recently introduced measures aimed at curbing gold imports, such as raising the import duty to 8% and restricting importation on credit.

Rajesh Exports added however that it does not plan to suspend sales of gold bars and coins, despite a request from the All India Gems & Jewellery Trade Federation.

"We don't feel stopping these sales would solve the problem [of India's high level of gold imports]," the firm's chairman Rajesh Mehta tells Reuters. "If genuine people stop the sale then all other spurious people will come into the market."

See the original article >>

EU resumes battle over how to impose losses at failing banks

By Rebecca Christie and Jim Brunsden

European Union finance ministers descended on Brussels, aiming to break a deadlock on rules for assigning losses at failing banks that doomed overnight talks last week.

Irish Finance Minister Michael Noonan, chairing his final meeting of Ireland’s six-month EU presidency today, held preliminary talks this afternoon in a bid to get a deal that he says is essential for keeping the EU’s crisis-fighting strategy on track. All 27 EU finance chiefs are scheduled to convene at about 6 p.m. in the Belgian capital.

“It’ll be slow -- bring your sleeping bag,” Noonan told reporters on June 24, after he spoke in the European Parliament. If ministers again fail to reach a deal, their timeline for strengthening central control of banks will be “off-kilter,” he said.

Talks last week foundered on the question of which creditors face writedowns when banks fail. Some countries demanded more flexibility for national authorities, while others sought strict rules across all 27 EU nations. Ministers considered several ways to set thresholds for losses that would need to be assigned via strict formulas before national discretion would be allowed.

An updated plan, circulated by Ireland to nations today, would hand regulators different degrees of flexibility depending on how they plug gaps that arise when some creditors are exempted from writedowns.

‘Liability Cascade’

“We need a clear liability cascade: first the shareholders, then the various bondholders, then the depositors -- not the insured deposits, which have always been excluded by European law -- then the member state concerned, and if that member state can’t do it, then also the European rescue fund,” German Finance Minister Wolfgang Schaeuble said on Deutschlandfunk radio today.

“What we saw in 2008, that the big ones make billions in profit and the community of taxpayers bears the losses; that’s something we no longer want to have,” Schaeuble said.

Under the revised Irish plan, regulators would have more freedom to grant carve-outs from writedowns if the burden is shifted to other private creditors, rather than to national resolution funds.

Flexibility could be applied in cases where writedowns could threaten financial stability, or cause “value destruction that would leave other creditors worse off,” according to the proposal, obtained by Bloomberg News.

Levies on Banks

Nations would have to work within certain limits if they chose to tap resolution funds to make up the shortfalls caused by exempting some private creditors.

These funds, financed by levies on the banks, couldn’t be used until 8% of the distressed bank’s liabilities had been wiped out, according to the document. Limits would also be placed on how much support these funds could provide.

The plan also stipulates that nations can use public money, including potentially the European Stability Mechanism, to plug gaps caused by creditor exemptions if the limits on the use of resolution funds have been reached.

The EU needs an approach “that allows some but limited flexibility to ensure financial stability, while still providing an ex-ante pecking order and clear rules,” Joerg Asmussen, a member of the European Central Bank’s executive board, said in a speech today in Paris.

“Global investors need certainty about the rules of the game in Europe,” he said.

Cycle of Contagion

After more than three years of crisis and bailouts in five euro-area nations, EU leaders have pursued the banking union as a way to reassure investors that they can break the cycle of contagion between banks and sovereign debt. The ECB will take over bank oversight in the euro zone next year, and the strategy calls for bank resolution procedures to be in place along with national backstops.

Leaders gathering in Brussels tomorrow may downplay the pace of banking reforms. Draft conclusions for the summit affirm that “it is imperative to break the vicious circle between banks and sovereigns,” without setting deadlines for further action.

“This is a tough negotiating chapter,” German Chancellor Angela Merkel said on June 24. Europe’s priority should be to “become more competitive,” not just increase its oversight of banks, she said.

Financial Stability

Denmark, one of the few European nations that has allowed some of its banks to fail, is pushing hard for strict rules in all 27 countries.

“Beyond our main point that banks will have to pay for themselves, we believe rules must apply for everybody and competition must be equal,” Danish Economy Minister Margrethe Vestager said on June 24.

Swedish Finance Minister Anders Borg countered that nations, especially those outside the euro zone, need to be able to step in when financial stability concerns become paramount. “Rigid” rules would increase credit risks and imperil economic recovery, he said yesterday.

“We cannot go into a banking resolution with a straitjacket on,” he said. “Dealing with crisis, you need a certain degree of flexibility.”

ECB President Mario Draghi said in Paris today that “it’s very important that whatever regulation finally comes out is mindful of creating a situation of order.”

See the original article >>

Major Chinese Banks Stop Lending

By tothetick

It was bound to happen some might say. We were warned! Chinese banks have stopped lending due to pressure from liquidity deposits. Some branches of the Bank of China and the Industrial and Commercial Bank of China have issued statements in which they announce that they are halting lending for a temporary period.

Industrial and Commercial Bank of China Ltd                                         Bank of China Ltd

Industrial and Commercial Bank of China Ltd                  Bank of China Ltd

Loans to businesses and individuals will resume according to the Bank of China on July 15th. The Industrial and Commercial Bank of China has stated that it is normal for them to put limits on the amount of lending that they do and those limits are set each month. Cases of where the bank has to interrupt their lending have already occurred. However, it would appear that the amount of lending was reduced in comparison with previous months by the banks head office for June. Apparently, the credit line will be reopened in July, but it will be only for a few days as they do not have enough deposits. On June 23rd, the Industrial and Commercial Bank’s customers had trouble withdrawing cash from cash machines and they also did not see bank transfers going through on their accounts on time. The Bank of China suffered the same setbacks on June 24th. Today they have cut loans heightening worry both inside and outside of China as to the stability of the banks. Statements were issued by the banks giving upgrades in IT services as the reason. Rather strange, however, that both banks updated their systems at the same time and suffered the same glitch in the system.

There are two other banks that have interrupted their mortgage loans also: CITIC Bank and Huxua Bank.

Analysts have always stated that the larger banks have stopped lending to smaller banks as they are worried about liquidity and there are deposit issues, but they seem to believe that the large banks will not stop lending to individuals and businesses. Only smaller banks will suffer from the credit crunch taking place in China right now. But, the banks that have halted lending today are not in line with that thinking. The Bank of China, which has existed since 1905, is the 2nd largest lender in China at the present time. It is the 5th largest bank in the world in terms of market capitalization. It employs nearly three hundred thousand people and has total assets to the value of CN¥ 11.829 trillion. That doesn’t sound very much like a small bank. It also has branches in 27 countries around the world. The knock-on effect in those countries will surely be felt too. Investors are not worried for the moment as share value rose today by 3.3%. But, will that continue?

The Industrial and Commercial Bank of China is also one of China’s big four banks (Bank of China, Agricultural Bank of China, and China Construction Bank). It is the largest bank in the world with regard to profit and market capitalization and was listed by Forbes Global 2000 in number one position as the world’s largest public company. It employs four hundred thousand people. In 2010 net lending of the bank stood at 70 billion Yuan, meaning that it lent than any other bank in China. 20% of its lending goes to manufacturing industry and personal loans are over 15% of its business also. It was the world’s largest Initial Public Offering at US$21.9 billion when it was listed on the Hong Kong Stock Exchange and the Shanghai Stock Exchange simultaneously in 2006. However, the news doesn’t seem to worry investors for the moment as share value rose by 6.82% today to 4, 700HKD (up 0.3 points).

This is all cause for major concern however. It will be an issue in the coming days, in particular in light of the People’s Bank of China’s recent statements that there was ‘reasonable’ liquidity statement that was issued a couple of days ago. The ‘reasonable’ turned into ‘ample’. Share value is still rising for the moment for both banks, but the Bank of China is below what it was just a few days ago as can be seen in the chart.

Bank of China Ltd

Bank of China Ltd

The Bank of China had already tightened lending in early 2010 in a bid to increase deposits and liquidity. But today the reining in of loans is in a different set of circumstances. The entire banking sector in China is currently strapped for cash and not just one bank.

How much the People’s Bank of China will be able to ward of accusations that there is indeed a big liquidity problem in China today is far from certain.

So, the options that are open to businesses and individuals? Unless the People’s Bank of China comes up with some cash to unfreeze the situation and double-quick, the Chinese (but, unfortunately, not only the Chinese) had better start popping down to the pawnbrokers and speaking to Uncle. Otherwise it looks as if they are in for a rough time. If money dries up in those two banks and continues, then small and medium sized businesses are likely to suffer and there will be a bank-run on. Don’t envy them at all for that. We could always send Ben Bernanke, couldn’t we? He will sort the problem out in true Federal-Reserve fashion. Uncle Ben would be a better option than the pawnbrokers maybe for some!  He may be looking for a short stopover in Shanghai when his stint at the Federal Reserve is up in 2014.

See the original article >>

Why 2012 Is Turning Into Another Bad Year For Hedge Funds

by DesiTrader

Some may find this a bit surprising. The magnitude of losses experienced by hedge funds on average during the height of the Eurozone crisis in 2011 was as large as the losses the industry witnessed during the financial crisis in 2008.

But unlike the performance after the financial crisis, the industry has been unable to shake the 2011 losses. Since the 2011 shock, hedge funds have been trending sideways for over a year now. Managers continue to find it extremely difficult to position themselves in response to the Eurozone madness. Many became short the various risk markets (or went into cash) this past summer and got hurt by Draghi’s action in late July (see discussion).

Numerous funds got involved in sovereign CDS – long protection – and took losses as CDS tightened (see discussion). Being short going into QE3 did not help either. Also a number of equity funds got hurt by a sharp sell-off in technology recently. The declines in commodities and emerging markets earlier in the year caused some funds to underperform as well.

The groups that did well have been some of the more specialized managers such as the Nile Pan Africa Fund (up 35% YTD) or DAFNA Lifescience (up 49%). But with yields at historical lows and macro risks still lurking, generating consistent returns (after high fees) has became extraordinarily tough for the industry as a whole.

image

See the original article >>

Stock Market Ready for Liquidation?

By George Leong

I advise you to look at buying stocks—but not quite yet; the time for buying hasn’t arrived. Just like a fire or liquidation sale at a retailer, the best buying opportunity in the stock market is when the discounts are at their heaviest. We’re not at that point yet.

As I have noted in my commentaries following the Federal Reserve Chairman’s recently proposed exit plan for the Fed’s bond buying and its effect on interest rates, the stage is set for the stock market to readjust to the norm. By this, I mean the rapid gains we have seen in the stock market over the past few years—specifically this year—are soon to be a thing of the past.

With the Fed planning to scale back on its monetary stimulus and, in turn, drive up bond yields, I do not envision a massive and sustained period of selling in the stock market, but instead a brief opportunity to buy some discounted stocks sometime on the near horizon.

Some are calling for a bear market to surface, but I don’t agree. While the Fed’s money printing may soon be over, as long as interest rates remain low and the economic renewal is actually in place, we could see an upward move in corporate America and the stock market—but it won’t come easily.

With the second quarter coming to an end this Friday, the focus will shift to the earning season, when I’ll again be looking at the revenue side to see if there’s any progress. Recall this year’s first quarter, when revenue growth in corporate America was weak and numerous companies fell short on revenues. The reality is that companies need to produce in order to support the equities prices.

Let’s take a look at the research by FactSet in its recent commentary (source: “Earnings Insight,” FactSet Research Systems Inc. web site, June 21, 2013):

Revenues for S&P 500 companies are estimated to grow a dismal 1.2% in the second quarter, down from a much higher 2.7% at the end of the first quarter. This slow growth doesn’t get my vote of confidence for corporate America; but it does indicate the continuation of low interest rates.

Earnings in the second quarter are estimated to grow at an anemic 1.1% versus the 4.3% seen at the end of the first quarter. This again is not encouraging, and suggests the U.S. economy is still fragile. In fact, based on the FactSet data, 87 S&P 500 companies have already provided negative earnings views—against only 21 with positive views.

The sectors with the weakest decline in earnings expectations include the materials (5.7% decline in expected earnings), information technology (down 6.3%), and the industrials (down 2.1%) sectors.

The financials sector, which I continue to like, is positive, expecting 17.7% earnings growth.

The second-quarter results could be messy for the stock market, but if stocks continue to correct, I would begin to look for some buying opportunities. If you want to take advantage, have some cash available.

See the original article >>

Lightning Crashes

by Marketanthropology

See the original article >>

Is this the next key support price for Gold?

by Chris Kimble

CLICK ON CHART TO ENLARGE

Almost two years ago the Power of the Pattern shared that Gold looked to be forming a Bearish Eiffel Tower pattern (see Gold Eiffel here) and that the Swiss Franc was suggesting Gold will be flat to down for years to come (see Franc here)

The above chart reflects that the Eiffel Tower pattern is still putting downside pressure on Gold, as it freshly breaks below an 8-year support line.

Could one of the support lines drawn above become the next important support for Gold? Which is more important, price or sentiment? I hear people are shorting Gold right now, does that matter? Could one of these support lines match up with a Fibonacci support price?

See the original article >>

Stock’s Safety Net Disappearing?

By Attain Capital

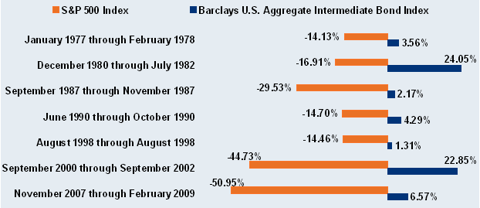
Don’t look now, bond investors, but there may be a bit of a sea change happening in how bonds react to falling stock prices (or perhaps, more correctly – how stocks react to falling bond prices). Most investors have been taught that bonds are conservative, and that you want bonds in your portfolio as a diversifier which should provide a hedge to your stock holdings in a down market.

This has generally held true over the years, as can be seen in the following chart via Charles Schwab via SeekingAlpha:

(Disclaimer: past performance is not necessarily indicative of future results.)

But the last 5 weeks  has seen a dramatic difference in this long held market axiom that bonds should go up when stocks go down, with the S&P 500 and US 10  Yr Note futures down an almost identical -4.2% and -4.3% month to date in June. What’s more, the big down days (last Wed, Thurs., Fri) all saw bonds down big as well.

Chart Courtesy: Finviz.com

(Disclaimer: past performance is not necessarily indicative of future results.)

How rare is this in the current environment?  Well, the current 5 day rolling correlation of .974 is the highest when looking at moves over 1% up or down since July of 2011, and significantly higher than the average 5 day rolling correlation of -0.63 over the past 2 years (and -0.62 during the past 12 months). We plotted the rolling 5 day rolling correlation between the cash prices of the S&P 500 and 30 Year US Govt. Bonds over the past 2.5 years to get a better look:

(Disclaimer: past performance is not necessarily indicative of future results.)

You can see the spike up in correlation, but the question is what happens to the world (and to a lesser extent managed futures performance) if this chart flips and the average correlation between stocks and bonds is more like positive 0.5 over the next 2.5 years. That would surely cause some havoc in the portfolios of investors who rely on bonds for diversification and expect them to be a flight to safety in times of a market crisis. The thing is – if the rise in interest rates causes the market crisis – then what?

That’s exactly what the Boston Globe warned their readers of a couple months ago.

“That may mean troubling times ahead for investors who have come to rely on bonds as a reliable place to hide from the risks of the stock market. If bond portfolios get hit hard, that could mark a third major setback for investors since 2001, following two dramatic stock market plunges. A serious bond market decline would not take place all at once, like a bad session in the stock market. But bond investors could face a slow, steady bleed for years, with annual losses of about 1 to 2 percent.”

How managed futures perform in a rising interest rate environment is yet to be seen, but we like our chances being able to go short interest rate futures (rates up), even though there are likely to be headwinds in terms of negative roll yield (we’ll have more on that in an upcoming newsletter…stay tuned)

See the original article >>

The Federal Reserve – A Study In Fraud

By Monty Pelerin

In a previous article entitled “Government: ‘A Seedy Circus … Perpetually In Debt’,” government was likened to Larsen E. Whipsnade, the character played by the one-of-a-kind W. C. Fields in the 1939 movie “You Can’t Cheat An Honest Man.” Characterizing Leviathan government as an individual, even one as large as Whipsnade,  was a stretch. Fields’ fans objected because he was reasonably harmless, likeable and entertaining, certainly not adjectives one would apply to our modern-day State.

Ben Bernanke as Larsen E. Whipsnade

If comparing government to Fields’ character is improper, then why not compare individuals in that institution to Whipsnade. Surely there is no shortage of characters (clowns?) that could qualify as circus employees. The commonality between the Fields’ character and most high government officials is that both are out to dupe the people.

Barack Obama doesn’t make the cut, only because he is unlikeable and a genuine fool rather than pretending. Jay Carney is bumbling enough, but only haplessly acting on the orders of others. Eric Holder is too unlikeable and probably too devious to be a carnival barker. His aspirations could not be satisfied in small circus towns. Additionally he is too easy to see through. Timmy Geithner might have qualified, but he’s gone now.That leaves Ben Bernanke.

Mr. Bernanke fits the role quite nicely. He is bumbling, likeable and reasonably harmless, at least as a person. He seems a victim of circumstances, a man out of his comfort zone. But his clinching qualification is his modus operandi which is identical to that of a “carnie.” [For those unfamiliar with the term "carnie," Wikipedia defines it as follows: "Carny or carnie is a slang term used in North America and, with showie, in Australia for a carnival (funfair) employee, and the language they use, who runs a "joint" (booth), "grab joint" (food stand), game, or ride at a carnival, boardwalk or amusement park."]

Like a carnie, everything Mr. Bernanke says and does is aimed at deception. A modern day Federal Reserve Chairman must be like a carnie. The primary difference between a carnie and a Fed Chairman is the veneer of sophistication and false omniscience. Gary Dorsch contrasts what the Fed used to do with what it has become:

It all seems so surreal. After being mesmerized by the Fed’s hallucinogenic “Quantitative Easing,” (QE) drug, and seduced by the Fed’s Zero Interest Rate Policy (ZIRP), and rescued by the Fed’s clandestine intervention in the stock index futures market, for the past 4-½-years, it’s easy to forget that there was once a time when the Fed’s main policy tool was simply adjusting the federal funds rate. It’s even harder to recall that two decades ago, the Fed’s raison d’être was combating inflation, whereas today, the Fed’s main mission is rigging the stock market, and inflating the fortunes of the wealthiest 10% of Americans.

To be Fed Chairman these days, you must be adept at charlatanism.

Like the Wizard of Oz, you must pretend you are in control of things that no one possibly can control. You must, as the Platters sung, be “The Great Pretender.” You must pretend that you know the future and can overcome it if it is not promising.

An entire industry has developed devoted to interpreting Fedspeak. Nothing the Fed says is definitive, despite being said in serious tone. The reason for that is the Fed has no better idea of what is happening in the economy than you or me. All of their messages contain wiggle-words so that they can backtrack without being declared in error. When you don’t know what to say, you say nothing but in a way that it can mean anything.

The pretense of confidence and control are your primary strategic tools, as is the ability to maintain these pretensions despite a series of embarrassing forecasts. Your operating tools — quantitative easing, ZIRP and various market interventions — are all carnie tools, designed to deceive people into doing things they otherwise wouldn’t and shouldn’t.

The Great Coordinating Mechanism

The Fed’s role today is to distort prices, a fraud on the grandest scale. Free markets and free prices are the guidance system that produce the marvelous results that Adam Smith described as an “invisible hand.” Prices encourage cooperation and harmony. They provide guides for tens of millions of economic actors. They signal when to conserve and when to splurge. Prices direct scarce resources to their best uses. They influence career choices. Prices literally provide the signals by which we lead every aspect of our lives. Every decision we make, including the emotional ones such as children, love and marriage, are influenced by prices (see Gary Becker among others).

The modern-day role of the Fed is to distort these prices, effectively to disrupt the economy’s guidance system. The purpose is to fool you into making improper decisions. This deception threatens social harmony and individual well-being. Distorting prices, especially systematically, is the equivalent of drugging a person and then having him make major life or financial decisions. Drugs and price distortions have the same effect on decision-making — the mind is unable to properly receive and process information.

Ben Bernanke is on record hoping to manipulate the following three prices:

  • Interest Rates
  • Housing Prices
  • Financial Assets

Blatant Fraud

Mr. Bernanke deliberately suppresses interest rates in order to raise home prices and stock prices. His stated purpose is to create a “wealth effect.” When people feel wealthier, it is thought they borrow and spend more. Mr. Bernanke’s program is pure deception. It is designed to produce a false and fictitious sense of security (wealth). His policies are the same as those that caused the original bubbles. They will produce another dramatic collapse. Deliberate fraud is being imposed on the American public. The fraud will ultimately end in tragedy and great personal suffering.

The rest of the government supports Bernanke’s scheme by issuing false economic statistics and claims of economic recovery. There is no recovery; nor will there be one until the massive misallocations of resources resulting from the price manipulations are corrected. That cannot happen without a massive recession/depression. As expressed by Zerohedge:

…the American economy faces a long twilight of no growth, rising taxes, and brutally intensifying fiscal conflict. These are the wages of five decades of Keynesian sin – the price of abandoning financial discipline.

That is the most optimistic case. A depression is both necessary, and probably inevitable, to break the legacy of decline that Keynesian economics has created. All government agencies act in concert to postpone this event, ensuring greater calamity when it eventually occurs.

The use of the term “fraud” is no overstatement. Fraud, in a legal sense, is defined in strict terms:

Fraud must be proved by showing that the defendant’s actions involved five separate elements: (1) a false statement of a material fact, (2) knowledge on the part of the defendant that the statement is untrue, (3) intent on the part of the defendant to deceive the alleged victim, (4) justifiable reliance by the alleged victim on the statement, and (5) injury to the alleged victim as a result.

Which one of these conditions does not fit Fed behavior? My opinion is that they meet every condition.

If a private company or individual engaged in similar actions regarding the price or misrepresentation of a single product, fines and jail sentences would be sought. The Fed, however, engages in fraud with impunity. They are encouraged to do so by the political class. Bernie Madoff appears ethical in comparison with government and its agencies. The Fed gets to call their deliberate fraud “economic policy.”  Government supports the fraud by claiming that an economic recovery is underway.

Markets are arguably the greatest “invention” of mankind. They enable social cooperation and harmony while allowing maximum increases in living standards. Markets are the very foundation of modern civilization, allowing many billions of people to survive on our planet. Distorting markets is no small matter. Doing so literally threatens peace and economic well-being.

The Fed’s behavior of distorting prices is deliberate dishonesty calculated for government advantage. The policy is designed to deceive others to behave in a manner which is ultimately harmful to these individuals. It is outright fraud!

Concluding Remarks

In hindsight, apologies are in order. There was no need to insult “carnies” by comparing them to government. Bernie Madoff’s crimes should not be compared to those of the government. He was a small fry and he could not force people to participate in his Ponzi scheme. Government is in a class by itself. The Mafia, in comparison, looks like Mother Theresa.

A government that can only survive via fraud has reached the desperate stage. It can create great harm in its death throes but its survival is unlikely.

See the original article >>

Follow Us