by Greg Harmon
Roses are red,
Violets are blue,
Sugar is sweet,
And so are you
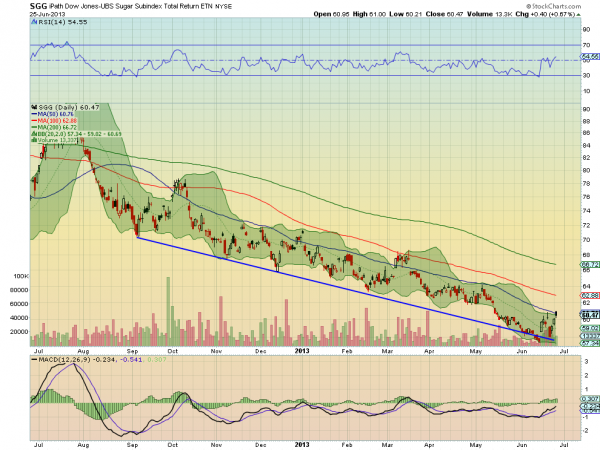
There is something wrong with this poem. It is late June and the Roses are Red and the Violets Blue. But Sugar is not sweet. It has been in the toilet for over a year. The price of Sugar that is. Take a look at the chart for the Sugar ETF, $SGG, below. A straight downtrending channel bounded by falling trend support and the 50 day Simple Moving Average (SMA) since September 2012. Yes it has tried to break the channel a couple of time only to have the 100 day SMA there to kill any rally. So what about this time? Is it different? Not really, but the same characteristics that would get you excited
about Sugar on the last two breaks over the 50 day SMA are present again. Maybe the third time is the charm. The Relative Strength Index (RSI) is rising and making a new higher high with a Moving Average Convergence Divergence indicator (MACD) that is also rising. These support further upside price action. I would wait until a sustained hold over the 100 day SMA before entering long. If you are short, congratulations and don’t take it off until the 100 day SMA is breached.

No comments:
Post a Comment