Tuesday, July 5, 2011

Corn could stem rally in feeder cattle prices

by Agrimoney.com

A further rebound in corn prices could curtail the rally in feeder cattle futures, which rose to a record high on Tuesday amid expectations of a scramble by feedlots for extra animals.
Feeder cattle - cattle ready for fattening on feedlots – touched 141.85 cents a pound in Chicago for August delivery, an all-time high for a spot contract, and extending to 13% gains over the last month.
The rally has been supercharged by expectations that weaker corn prices will encourage feedlots to take on extra animals, at a time when the pipeline of feeder cattle appears thin.
Farmers in drought-affected areas of the US South, accounting for roughly one-third of the national herd, sold cattle at lighter weights than normal because of the poor pasture conditions and, with the national herd at its smallest for decades, replacement supplies are expected to be hard to come by.
"We have a small herd anyway, and on top of that the picture has been distorted by placing cattle [on feedlots] early," Jerry Stowell, at broker Country Futures, based in Kansas state, said.
Corn factor
However, while there still looked considerable potential for feeder cattle prices to rise further, the upside could be limited by a further revival in the price of corn, a major fodder source for feedlots.
"We are bullish feeder cattle. But if corn yields come in slightly below expectations, we could see feeder cattle falter at the mid-150s [cents a pound]," Mr Stowell said.
Conversely, the prospect of a rash of fattened animals emerging from feedlots later in 2011, following the strong pace of placements of feeder cattle in the spring, has kept a lid on prices of live cattle- those ready for slaughter.
Live cattle for October shed 0.1% to 119.50 cents a pound, with those for August delivery adding 0.4% to 113.325 cents a pound, helped by stronger cash markets - and positive packer margins, of about $13.25 a head, even at these higher prices.
Regulatory data show speculators taking an increasing interest in cattle, with "managed money's " net long in Chicago feeder cattle tripling to 1,000 lots in the week to last Tuesday, and rising 4,800 lots to nearly 65,000 contracts for live cattle.

See the original article >>

Who Really Moves The Price of Oil? Saudi Arabia, IEA or The "Hidden-Hand"?

By Andrew Butter

First impressions it looks suspiciously like the bold experiment to strut the power of USA as a player in the oil-price conundrum; looks set to be about as successful as the $4.7 trillion campaign to achieve, I still didn’t figure out quite what, in Iraq and Afghanistan….err…and perhaps Libya?

The day-before IEA announced the release of two-million barrels of oil a day for a month, Brent closed at $113. A week later it closed at $112, i.e. it dropped 1% overall in a week.

That’s hardly Mission Accomplished however you spin it, particularly compared, for example, to a week after the Saudi’s said they would go the other way to OPEC ($111 compared to $119 a week earlier i.e. 7% down), and a week after God’s Workers pronounced the banana was getting over-ripe when it was $ 124 compared to $127 (4% down).

Of course, none of that comes close to the drop in the week after the Chimp pronounced on 30th April that the oil-bubble had peaked (12% down: $126 to $109), which is perhaps not surprising, given that Nassim Taleb, the author of the Black Swan, says Chimps are much better at picking numbers for the future than the Students of Econ-101.

And that proves? Well either the oil-market is more influenced by the musings of a Chimpanzee than by the combined efforts of the IEA, OPEC, Saudi Arabia and God’s Workers, put together…or the Chimp is psychic, or there is a Mysterious Hidden Hand Manipulating the price of oil, that only Chimpanzees can see?


The dashed lines are simple regressions from the day the pimple appears to have reached its zenith, that was the day that God’s Workers told their flock the news. The red line is the “best-fit” down to the day before the IEA made their pronouncement, and the green line is the best-fit to last Thursday.

So if you squint you can say that the bold action of the IEA hastened the fall in the price of oil (54% R-Squared compared to 40%), although the t-statistic is miniscule so that’s “not statistically significant”.

All I can say is that I’m sorry I suggested the idea of using the SPR as a weapon of fiscal management in early April; when I argued (somewhat sarcastically), that the Federal Reserve should be put in charge. My point was simply that the 35% rise in oil prices since January 2011 was completely due to speculation, and that speculation had been funded by the Fed’s monetary policies.

So it made sense for the Fed to manage the SPR, because their mandate, as is frequently summarized by Ben Bernanke when he desperately repeats and re-repeats his job description, like a lost soul wandering in the dark repeating a mantra, is as in:

The Federal Reserve's objectives -- its dual mandate; set by Congress -- are to promote a high level of employment and low, stable inflation stable economic conditions, keeping inflation in check, and creating jobs.

The problem of course is that the mandate did not SPECIFICALLY say the jobs should be created in USA, which is why most of the jobs the Fed helps create are in China.

Either way, speculation in oil is bad for USA because it means they pay more for oil that they cannot avoid importing, and the way their trade deficit is running, that means they have to borrow from “aliens” to pay for it. And it’s bad for the world economy too, which means the few world-class industries left in USA sell less to the “aliens”.

More important, it prevents the development of new sources of supply or alternatives because sensible finance won’t invest long-term when the short-term market for the thing they are investing in, behaves like a yo-yo.

When a geek in Exxon put’s up a forward-cash flow on his Power Point for a $500 billion project to develop deepwater oil; there are three numbers he needs to put in the Excel sheet for Year-10 to calculate his NPV. One for “base-case” one for “stretch- case” and one for “low-case”; sensible financiers (not the ones who created the credit-crunch), always look at the “low-case”, and the thing about bubbles, is that the next thing that happens, is you get a bust.

You can argue that’s the Black Swan Scenario until you are blue in the face, but when the discussion turns to how much LTV and DSCR they will let you get away with in your model, they draw a line linking up the dots of the bottoms of the troughs of the busts.

And if any of the Students-of-Econ-101 tell me that markets should be “allowed to find their own equilibrium” and that the roller coaster ride of oil from $75 to $147 and then down to $35 and back up to $90 in 2010 was a perfect example of efficient markets finding that equilibrium, I’m going to slap them.

The oil market fundamental is dictated by Parasite Economics. In that analogy, the customers (particularly USA) are the “hosts” (as in Daisy the Cow), and the parasites are the ones drinking the milk (as in Saudi and Iran). The trick, for the parasites, is to make sure Daisy doesn’t get a nasty dose of mastitis and keel over and die; the cost/benefit optimal of that is the “fundamental”; assuming of course oil is not running out in which case the “fundamental” is the cost of replacing all of the oil that was once there but now isn’t. Try looking all that up in an Econ-101 textbook.

It makes no sense to rely on the “invisible hand of the market-place” to deliver a “fair-price” when the market-place is distorted by the invisible hand of God’s Workers manipulating the market, just like they manipulated the silly indexes that were used to price toxic assets in the good-old-days, which caused the credit crunch; remember that?

My argument was that if you are in the business of manipulating the monetary base, you need to think about manipulating the price of oil too, so as to protect yourself against the unintended consequences of handing out free-money to speculators, so they can screw you.

Whether central banks should be allowed to be in that business so as to cover-up the incompetence of the legions of “democratically elected” sleazebags which is what passes for “government” these days; is something that’s been debated since the fall of Rome. But that’s another story, all I have to say about that is in a Real Democracy there would be a box on the ticket saying, “None of the above”.

But when I wrote that article, I wasn’t suggesting that President Obama should bring in the IEA to shoot him in the foot.

Yet that’s what happened, the IEA fiasco is too-little, too-late, and much too stupid. “Manage” means getting someone who knows what they are doing, to “sell-high” and “buy-low”, an ex-Goldman Sachs sleaze-bag would have been ideal to do that sort of “God’s Work”; with a mandate to (a) make a profit (naturally), and (b) to keep the commodity traders who generally serve a vital economic function but occasionally need to be slapped-down…honest. And the trick there, like in any guerrilla-war, is they will never know when you are going to sell, or when you are going to buy, until after you did.

Have no illusions, it’s a guerrilla war, because the weapons the “good-guys” got are miniscule compared to what the “opposition” has. The SPR is 270 million barrels of oil, that’s 20-days production by Saudi Arabia going flat out; at least once they get those pesky 32” pigs out of the pipe. America may have the biggest (and most expensive) army in the world, but when it comes to oil they are just a big fat cow on a feed-lot, waiting for lunch.

My best mate these days is a lunatic called Eddie who has three bullet wounds and one of his fingers is a lot shorter than the one on the other hand, on account of the IRA cut it off with a pair of garden secateurs; which is not something he would recommend you try at home. For his sins, which these days mainly relate to Jack Daniels and the girls, once he was a sergeant in the SAS; so he knows a thing or two about how to “influence” events.

One day he explained to me that it’s not so much what the SAS do when they get parachuted in somewhere, it’s the fact that the enemy know they are there, but they don’t know where they are. The message I got from that is sometimes it pays to not telegraph your punches.

Particularly if you are the Federal Reserve or a proxy for it, as in did you notice the 100ytear went down to 3% just like the Chimp said it would last December, wonder why? The recent addition to the bull in the sweet-shop is the IEA, as in the players will never “Fight the Fed (or the IEA)” but they will happily lead it around by its nose.

The correct time to have started planting mines to blow random feet off unsuspecting speculators was in February 2011 when oil peaked its nose above $100.

If that medicine had been dished out then (quietly), the word would have got around, “Don’t Fight the Fed”. And oil might well have returned to its proper, sustainable price of $90, as in the one where the parasites get free milk every day and Daisy doesn’t keel over and die.

Why $90?

Well for a start that’s what SPOOF (The Standard Pricing of Oil Formula), says it should be right now, as in, to express that in the hieroglyphics so loved by the Students-of-Econ-101:

FOOT = 3.3% TOAD/OIK.

OK, you might not buy that logic, particularly if you are a Student of Econ-101, as in “we are proud that we figured out 101 ways to shoot ourselves in the foot”, but just remember that was the same logic what said the S&P 500 would bottom at 675 (it did), and then meander up to 1,200 (it did) and then reverse by 15% (it did), and then the 10-Year Treasury would hit 3% about now (it did).

But don’t listen to the Chimpanzee, get a second-opinion. Well the Saudi’s say the “right price” now is $70 to $100; depending on their mood and they never specify if they are talking Brent or WTI, and the head of Exxon which recently discovered 700 million barrels of deepwater oil off New Orleans, told Congress that he would be happy to keep on doing that (and not spill it all over the ocean), if oil prices stayed above $75 (presumably WTI).

No definitely don’t listen to the Chimp, listen to the experts, although, here’s a thought, perhaps they been reading his mail?

What did the IEA do wrong?

1: They “telegraphed”, just like Ben telegraphed QE-2, and so he ended up paying top-dollar for laundering Tim’s short-term debt into some slightly more palatable longer-term stuff.

Then to cap it, they put a time limit which is always a mistake; just like putting a time-limit on military disengagement. First you tell the enemy you are going to attack (so he starts manufacturing road-side bombs), then you announce when you will run away with your tail between your legs shouting “Mission Accomplished” in a loud voice, so he starts manufacturing more road-side bombs.

2: They don’t have a distribution network, even a Student of Econ-101 knows that to sell anything you need distribution. Instead you got a bunch of bureaucrats setting up auctions!! The IEA or their proxies are turning up at the back-door of refiners and saying “Hey-sweetheart, you want to buy some oil…and kick your normal supplier in the teeth, the one who you have been dealing with for twenty years, and the ones who gave you an allocation?”

“That’s a great idea, patriotic too, but…Err…what about next month?” Remember the price of Brent is the price of Brent in the market, what some moron PhD from the IEA manage to sell his bucket oil for, is something else completely, as in the “right” price of oil is what you can buy it for from someone dumber than you.

They formed an “alliance” and didn’t put anyone clearly in charge apart from a bureaucrat, sounds like the EU response to Greece and the military action in Libya.

And like Libya, WMD, and Rumsfeld’s bunkers, don’t have a sensible objective. The stated objective is to “replace” oil lost to the Libyan Rambo Charlie Foxtrot. So the objective is “military”? As in why not just let the Saudi’s go in and cut a deal with Gaddafi so he goes away?

Not many people know this, but just prior to 9/11 the Saudi’s were close to agreeing a price with the Taliban to hand over Bin Laden; $28 million was the sticking point, another $5 Million and there would have been a deal.

But no, Rambo decides to go out and borrow $3.7 trillion to do it his way. Don’t under-estimate how much money it will cost, and how many innocent lives will be lost, before David Cameron’s rush for the title of “World-Statesman” like his hero Tony Blair, gets tidied away.

There are only TWO sensible reasons for selling oil from the SPR, (a) to sell high and buy low (i.e. sell at $127 when the Chimp said-so and top up at $110), (b) to pop a bubble. But the bubble is popping and in any case the Saudis got it covered, once they sort out those two little piggy’s stuck-in-a pipe.

Apart from being stupid, it was just plain rude.

Didn’t anyone NOTICE what the Saudi’s did on 8th June? Their point was a bubble in oil is bad for the world economy and a simple “thank you” for deciding to pump to bust the bubble would have been enough.

All through the 2008 bubble the Saudi’s were saying “it’s a bubble”, and its clear now, that in hindsight it was a bubble. The way you can tell is that (a) there was a bust after what looked like a bubble and (b) the square-root of the top of the bubble multiplied by the bottom of the bubble, is exactly equal to what the Saudis had been saying the right price was, all along.

This time they are saying it’s a bubble too; perhaps sometimes it might be a good idea to listen to what they are saying. But what’s weird about the Saudis is that they said, and they keep on saying, that bubbles are bad for business, and bad for the world as a whole; instead of just grabbing the money while they can.

On 8th June, they stood up to the countries in OPEC who would like the world to “suffer for its sins”, particularly America (i.e. Venezuela and Iran), and they said “stop behaving like children”.

And they committed (along with UAE and Kuwait), to pump oil that they don’t need to sell, since they have more money than they know what to do with and long-term they know that they could get more money, much more money, for that oil, if they just left it in the ground.

Are they mad?

Well perhaps they are, or perhaps they think that they must kiss the posterior of the World’s Greatest Superpower which recently spent $4.7 trillion dollars of borrowed money achieving precisely nothing in Afghanistan and Iraq. Perhaps, and perhaps the King of Saudi Arabia goes to bed every night saying a little prayer, “God Bless America, may she long keep me in power and deliver me from the Iranians”.

Or perhaps the reason that the Saudi’s and other like-minded GCC states are about the only nations in the world behaving like responsible adults these days, is because of they think it’s the right thing to do.

And perhaps that “weird” philosophy has something to do with the idea that under Islam it is considered to be dirty, to “profit from other people’s misfortune”? Bubbles are zero-sum, they rely on getting people to pay more than the intrinsic value of “things”; and they are driven by the profit that the sellers can make, selling “things”, in the words of the philosophy of God’s Worker cynics, “to someone dumber than you”.

Here’s an idea, regardless of where their philosophy came from, perhaps Saudi Arabia should get a Permanent seat on the UN Security Council?

After all
  • (a) they do represent the second biggest religion in the world, and probably the biggest if you only count people who actually practice
  • (b) when the whole world is behaving like lunatic children, they consistently behave like adults
  • (c) they control the one thing that can derail the world economy, and no, that’s not nuclear bombs or the ability to drop cluster-bombs from 10,000 feet, it’s called “OIL”.
And while we are on that subject, the way to do that would be to chuck out France and UK and give one seat to the European Union, and one to Saudi Arabia. After all, France and UK are not exactly World Powers anymore, as in how many Tornadoes did the Brits send to bomb Libya; was it nineteen or was it sixteen?

And in any case the Tornado is an aged interceptor which these-days is only good for blowing up airfields; that job took five minutes…and for an encore? Well that’s easy, call in GI Jane, she has lots of money to pay for ordinance, after all she borrowed $4.7 trillion to blow up all those WMB, there has to be more where that came from.

Perhaps next time a smooth talking “World-Statesman” with a public-school accent and a seat on the UN Security Council, eggs on Rambo to start dropping precision guided cluster bombs from 10,000 feet in the name of the New World Order, the message comes back, “Sure-thing buddy, just send us a cheque”. But don’t hold your breath.

The Mysterious Hidden-Hand

Well it’s not Saudi Arabia, obviously, nor is it the IEA fronting up for the Americans; and well God’s Workers, they are just good for blowing bubbles and persuading dumber-than-thou German and French bankers to buy Greek debt.

Blowing bubbles is one thing, popping them is something else, that’s where the mysterious Hidden-Hand comes into play.

The reality, right now, is that although medium-term there is the distinct possibility that oil will run out, short-term there is no shortage. And don’t for a moment think that Iran, Venezuela and Nigeria are going to cut back 1.5 million barrels of oil a day, just to keep the prices high so Saudi Arabia makes can make a killing selling the additional 1.5 million they are promising to pump.

No-way, their idea was that Saudi should “sell-low and buy high”, and there are much too many individuals in those countries taking a cut and squirreling the money away in Switzerland and Dubai, for them to “make the sacrifice”.


But regardless of how many of those new-fangled road-side bombs that can cut a HUMVEE in half (literally), like what happened to those three pour souls from Olive the other day; are smuggled over the border to destabilize Basra, and slow down the pipeline work; Leighton Offshore are miles ahead of schedule.

Particularly now they decided to change the pipeline route so it avoided the stash of UK-Made phosphorous bombs that were dumped in the sea; plus they figured out a way the deal with the silt. Someday soon there will be another 1.5 million barrels a day (or more) pumping through those three SBM’s. And well, Exxon says they can pull out deepwater oil and make a profit at $75, and have change over to pay to clean up the Yellowstone River.

And all the while, slowly, imperceptibly, in the background, the "Hidden-Hand of Bubble" works its magic.

New Highs in the Consumer Discretionary Sector

by Bespoke Investment Group

Despite the 'typical' consumer that is considered to be under water on his/her mortgage, out of or under-worked, and simply strapped for cash, the Consumer Discretionary sector continues to rally on. Last week, the sector became the first of the ten major sectors to make a new bull market high. In the process of making that new high on Friday, more than 20% of stocks in the sector traded to new highs as well. The last time that many stocks in the sector hit new highs on the same day was all the way back in February.


See the original article >>

You Can't Have One Without The Other


You Can't Have One Without The Other?...Oh really?  Without question probably THE key macro debate these days important not only to economic, but also financial market outcomes is the debate over inflation versus deflationary eventualities ahead.  You already know the sides are divided with a lot of strong and well reasoned opinions on both sides of the equation.  We are not about to address this specific debate for as we see it, the jury remains out.  Mother Nature and Father Time argue deflation in many an asset class is still and will continue to be a reality.  Alternatively central bankers are fighting Mother Nature and Father time with everything they've got, so to speak, praying their own inspired brand of monetary inflation can outrun embedded deflationary forces still left unresolved and unreconciled in the current cycle.  And for now we are seeing a duality of outcomes.  What remains levered (real estate) is still deflating and what is unlevered and experiencing accelerating physical demand globally (commodities) is inflating.  As per investment decision making, being accepting of this current duality has been key to successful outcomes.

Again, the purpose of this discussion is not to chime in on the macro deflation versus inflation debate.  The specific purpose is to drill down and question what we see as a bit of consensus logic of the moment pertaining to inflation.  Right to the point, and we've discussed this historical truism many a time ourselves over the years, history is clear that prior bouts of headline inflation in the US have been very rightfully accompanied by wage inflation.  We offer you the following chart as to why this perception is held so dear by so many.  We're very simply looking at the year over year change in the headline CPI set against the year over year change in average hourly service sector wages (the service sector being by far the largest employer in the US).  The directional correlation here is quite high.  But we will admit, and this we believe will be very important in just a minute, that the linkage/correlation here has become a good bit less tight starting in the late-1990's.


So again, without trying to make some definitive macro call on inflation versus deflation, we know the very strong perception exists that in an environment where US wage growth is not accelerating on a rate of change basis, as is exactly the case now, there is no way higher commodity prices can ultimately be passed through into final goods prices for any extended period of time.  Without wage growth, only a draw down of personal savings can "fund" inflationary pressures for a time.  Wildly enough, post the rise in gasoline prices we saw earlier this year, the US savings rate has indeed declined a bit to help buffer the blow for now.  You can see exactly this in the recent numbers.  In essence, history tells us that there is no way inflationary pressures can continue to grow ever larger in the US if wage growth does not ultimately show up to support and perhaps help further accelerate those higher prices.  In a wage growth deprived macro US economy, there is no way higher commodity costs can exist for a sustainable period of time.  Oh really?  As we've tried to suggest a million times over the years, we're in a changed world.  Globalization changes everything.  It's no longer a one chessboard global economy, but rather a three tiered multi-dimensional macro economic gaming environment.  As you'd guess, for now the old rules do apply...until they don't.

One more quick one from the history books and we'll move ahead.  Below is a quick snapshot of year over year rate of change in US CPI, but this go around we've broadened the comparator to total US disposable personal income (DPI).  Yes, we're looking at the year over year change in DPI.  One more time there is indeed an historical correlation here, albeit given the DPI numbers are much more volatile than wages only.  But you get the concept and idea.


Remember that disposable personal income picks up income beyond wages specifically that includes interest income, rental income, transfer payments and proprietors income (small business).  This is again why so many folks on let's call it the non-sustainable inflation side of the argument have literally planted the flag.  Their position is that there is no way inflation (as meaning really higher prices for food and energy essentials) can take hold in the current environment.  In fact we do know one specific central banker who also seems convinced higher commodity prices in the current cycle are transitory and temporary, as this history we've shown you would seem to justify.  But is he still expecting to play the global economy game on one chess board?

One last view of life in what we suggest to you is a changing world.  It's an update of one you've seen before, but again is a key relationship the "temporary and transitory inflation" crowd are banking upon conceptually to validate their non-inflationary case.  Very quickly it's the nominal dollar history of West Texas crude prices alongside the same year over year change in US service sector wages.  What we've done with the light green colored bars is look at what happened historically to the rate of change in wages when crude prices accelerated meaningfully.  Key point being, since 1974 every time crude oil prices accelerated over a certain period of time, the year over year rate of change in service sector wages was accelerating.  Every single time.  The only two exceptions to this rule were seen during the periods shaded in purple - the 2007-08 period and in the present environment.


Of course we watched oil prices rocket to the moon in 2008 while the rate of change in US wages was decelerating and what happened?  Just as history would have academically predicted the US fell into a recession.  Chalk one up for the transitory and temporary crowd, right?  But we suggest that we all think much more broadly as the prior cycle that witnessed the spike in oil was not only about the increasing importance of globalization to physical commodities, but also about unchecked speculation and the growing integration of commodities as an asset class to institutional investors globally.

So we know you get the picture.  Again, as we step back and look at the lessons of history, we can see how the temporary and transitory crowd can be so adamant in their conviction that in the absence of US wage inflation, commodity price acceleration and inflation in general are unsustainable.  But as suggested, it's time to start thinking more broadly.  Specifically, it's time to starting monitoring the character of wages alright - the character of non-US wages.  

To get us thinking in this direction and to unshackle the constraints of viewing life only within the context of US historical experience, and certainly to pay homage to the three dimensional chess board that is the global economy of the moment, let's look East for anecdotes of change.  You already know that probably a few months back, the wonderful folks at Li and Fung (Asia's largest retail supply chain management firm) told us that price increases coming from Asia would be a certainty, it is now only a matter of how much of the cost increases Li and Fung customers will be able to pass through into final goods prices to their customers served.  It was only a few weeks later that the CEO of Wal-Mart said essentially the same in telling folks to expect higher prices broadly that would stick, nothing temporary about it.  It was just recently that William Fung (the Fung of Li and Fung) revealed in the Wall Street Journal that he now expects an 80% increase in wages across the Asian community over the next five years.  You'll again remember that the FoxConn employee riots of February of 2010 resulted in approximately 30% wage increases for their employees by the summer of last year.  Rising wages in the emerging markets is a certainty.  

Specifically China has been allowing wage increases we believe for a number of key reasons.  First, in the absence of significant currency revaluation, higher wages in China addresses with some immediacy the issue of inflationary pressures most importantly seen in food prices as of late.  Secondly, higher wages in China over time should help spur accelerating domestic consumption - something China knows it needs to make happen in order to allow more internal total economic balance (export model versus internal consumption model).  The five year 80% wage increase prediction by William Fung seems like a very big number, especially compared to wage gains in the US both now and over the last five years.  But the fact is that meaningful wage gains have already been occurring in China for quite some time.  As you already know, when starting from such a very low nominal wage base a decade to a decade and one half ago, the nominal gains have been small in nominal yuan terms, but large in percentage terms.  After over a decade of compounding, the numbers start to become much more meaningful.  And now when we see 30% FoxConn related numbers appearing, this issue simply takes on heightened importance.

Directly from the Chinese National Bureau of Statistics, we've put together a few views of historical reality to hopefully get us to start thinking about wages and commodity prices/inflationary pressures in a much broader context - in a global context.  Below is the history from 1995-2009 of the average wage of employed persons in China as expressed in Yuan.


Of course the year over year rate of change numbers are important.  With the exception of 1997, every year over the period covered witnessed a double digit rise in wage gains annually.  Again, not so important when the nominal Yuan wage base was small, but very important when one now contemplates 30% wage increases on a nominal Yuan wage base almost seven times larger than it was in 1995.  We're talking real money now.  A bull market in Chinese wage gains?  If the above were a stock chart, how else would one characterize this history?

Very quickly, what we've done in the combo chart below is break apart the history of Chinese wage gains between State owned and independent (private) enterprises.


Wildly enough, at least according to historical experience, wage gains at State owned enterprises have outstripped their private sector counterparts in most years.  All in the interests of maintaining the social good?  You bet it has been.  And that's still a very big issue today.  Please remember that all of the numbers we're showing you above are current only through 2009 (China's official numbers of the moment).  It is in 2010 and really now that we are staring to get anecdotes of rate of change wage acceleration well in excess of any of the rate of change numbers you've seen across the charts above.      

So why have we dragged you through these numbers?  And why should this all of this be important in investment decision making ahead?  We have a few more items to discuss that we hope at least provoke thought and reflection.  First, as a KEY global macro, we need to very importantly remember what certainly is a truism of global macro economics of the moment (and as Larry the Cable Guy would counsel us, "we don't care who you are").  And that truism is, the low cost producer sets price.  Let's face it, costs in China have in essence become the "benchmark" for so much global production over the last half decade.  We won't go into all of the outsourcing commentary as you know all of this already.  What is very important in this period of rising wage acceleration is that increasing labor costs in China allow other Asian competitors to likewise address their own domestic wage issues under the "cover" of China's all in pricing umbrella.  Point being, rising costs and ultimately prices coming out of China may indeed allow prices influenced by Asia broadly to rise.  We expect exactly this to occur.  Isn't this the very definition and characterization of a price/wage spiral?  This is exactly why we've keyed in on Chinese wage character as being a must do monitor point, not only for China specifically, but really Asia broadly.

But of course there is another issue directly linking back to our original comments about the historical correlation between US wages and commodity prices.  Although we only have the Chinese wage data stretching back to 1995, we thought we'd look at the rhythm of rate of change in Chinese wages over time set against crude oil and food prices.  Exactly as we did in one of the charts above of US wages and West Texas crude.  We're using total annual Chinese wage rate of change data below (as opposed to State owned or private company data specifically).


Who knows, maybe we're stretching to make a point for all we know, but here's what we see.  Back in the late 1990's and early part of the last decade, in the years following meaningful rate of change growth in Chinese wages, oil prices accelerated.  We marked these periods with the green circles.  Absolutely direct and definitive causation?  Of course not.  But what we would suggest is that rising Chinese wages in those periods lent a certain amount of support to growth in the total domestic Chinese economy itself.  And with macro Chinese economic growth comes a higher demand for resources.  

Do we likewise get a taste for a bit of the same in the relationship below in looking at equity prices on the Shanghai relative to the rhythm of domestic Chinese wage growth over time?  At least in the past when Chinese economic activity accelerated (theoretically as reflected by the financial market) wage growth likewise seemed to likewise accelerate in accord, and vice versa.


We'll finish up with one last relationship.  This time it's the annual rate of change in Chinese wages along side the UN real food price index at each year end period.  Have a peek.
               

Okay, you'll remember that when we looked at the relationship of US CPI and service sector wages that was the first chart in this discussion, we stated that historical correlations between the two had been very tight up until about the late 1990's.  Well, if you look at the chart above and the prior chart of Chinese wages and crude oil, we see the directional correlation as being pretty darn high from about 2003-present.  Is this telling us that at the margin what is occurring with wages in China since that time is having a potentially greater impact on the rhythm and reality of global commodity prices?  We think this is exactly what it's saying.  In very simple terms what we believe we are "seeing" is nothing more than the evolution of the global economy. 

So again, we know you get it.  We believe declaring higher commodity prices and higher inflationary pressures a transitory or temporary phenomenon based solely on lack of meaningful US wage growth is shortsighted at best and perhaps very dangerous in investment decision making.  The reality is that we are already seeing a number of Chinese manufacturers attempt to outsource themselves in this period of higher labor costs.  Outsourcing to places like Vietnam has been done.  Unfortunately Vietnam simply is not a large enough economy to have a meaningful impact on or act to offset domestic Chinese wage trends.

Lastly, as we look ahead a number of years, we also need to remember that China is running into a demographic issue.  And they are not alone.  The long standing one child policy in China has driven two important phenomenon.  First, the population at some point will not be "replacing" itself.  Secondly the disproportionate number of men in the country speaks to the same issue - a country that will increasingly have difficulty somewhere down the road replacing its population.  Can we make the case that a worker or skilled worker shortage may appear, and have its own influence on domestic wages at some point?  We're a long way off, but headed in that general direction.  Will China drop the one child policy at some point?  We believe they will indeed.  And we can only imagine what demand for commodities and their resulting prices may look like if the Chinese birth rate were to increase.  Can you?  Indeed perhaps we can't really have inflation without wage growth.  We just suggest you be careful about to whose wages you are referring.                                                                                                                                                                                                                                         
See the original article >>

Gold: Still Bullish, but Slightly Frustrated


These are the kinds of things that frustrate me but are just a part of trading and investing.

I last looked at gold on June 1, 2011, and I wrote that I was bullish even though the metal was approaching all time highs. Buying at the highs is not my thing. I was basing this analysis in part and on the fact that my bond model was positive for higher bond prices (i.e., lower yields). The bond model still remains positive although the technical action last week in Treasury bonds may be a warning sign.

Anyway, fast forward to the set up described below for the SPDR Gold Trust (symbol: GLD). See figure 1, a daily chart. The black dots on the price chart are key pivot points. Key pivot points are the best areas of support (i.e., buying) and resistance (i.e., selling). GLD has been weak (despite the above mentioned positive fundamentals), and on Friday, GLD gapped and closed below the first level of support at 145.15. Support now becomes resistance, and this is usually a sign of further weakness. More importantly, this kind of price action also gives us a sign post for navigating future price action in GLD.

Figure 1. GLD/ daily

Sometimes and especially in bull markets, breaks below support are only meant to wash out the weak hands. A close back above new resistance/ old support would accomplishment just that. Therefore, a close back above 145.15 would be bullish.

Now comes the frustrating part and one I have little control over. GLD gapped well above our 145.15 resistance level this morning. A close above this level is bullish. However, it would be nice (and we know the market is rarely that) that the entry would be as close to the new support level as possible. For GLD, I can see the technical set up developing, but I have little control over the outcome. Nonetheless, the price action remains bullish especially in conjunction with the fundamental set up.

Grain prices revive, as buyers queue for supplies

by Agrimoney.com

The rebound in grain futures found extra legs on fresh production fears, and signs that buyers are rushing to cash in on prices which remain amongst their lowest of the year.
Early news that South Korean feed groups Nonghyup Feed and Major Feedmill Group were seeking a total of 250,000 tonnes of corn was followed up by reports that Sri Lanka had bought US winter wheat on Friday and that other Asian buyers were testing the market.
"With consumers viewing price dips as a buying opportunity, demand indicators are likely to strengthen on these lower price levels," said Sudakshina Unnikrishnan at Barclays Capital, noting talk that millers in Indonesia, Malaysia the Philippines and Thailand were also "enquiring about corn and wheat shipments after the recent price drop".
There were rumours of a fresh purchase by China too of a further 500,000 tonnes of corn over the weekend, following a buy-up of a reputed 1.6m tonnes during last week's break.
'Artificially accelerated'
Commerzbank analysts said: "Importers are evidently taking advantage of lower prices and seem to share our view that this drop in prices, following the revision of US inventory and acreage figures, will not last for long."
Corn prices, which suffered their worst sell-off in 15 years on Thursday after official data showed far higher US sowings and inventories of the grain than had been thought, revived 2.8% to $6.23 ½ a bushel, for September delivery, in Chicago's overnight electronic trading session.
Chicago wheat for the same month soared 3.5% to $6.33 ¾ a bushel, with European contracts higher too.
Paris wheat for November, the best-traded contract, stood up 2.6% at E198.00 a tonne in afternoon deals, taking its rebound in three trading sessions above 7%.
London wheat for November was 2.5% higher at £166.50 a tonne.
"There was a lot of feeling that last week's [price] collapse was artificially accelerated by fund sales, and that looks to have been borne out with what is happening today," a UK trader told Agrimoney.com.
'Issue bulls need?'
Indeed, besides demand pressures telling on prices, there were signs of supply threats too, with reports that French wheat yields were, so far, coming in 20-35% below last year's levels, and rain threatening Ukraine's harvest.
"The market has been unsettled by heavy rain impacting Ukrainian harvest forecasts," Commerzbank said.
Consultancy Agritel said: "The persistent rains over southern Russia and Ukraine continue to degrade the quality."
Furthermore, hot weather is being seen as a revived threat in the US.
"The central US weather has a high pressure ridge with above-normal temperatures for the next two weeks," US Commodities said.
"A hot and dry pattern could emerge, and may be the weather issue bulls need if rains are not produced."

See the original article >>

Euro/Dollar flag pattern

by Kimble Charting Solutions


See the original article >>

Why Only One in Four Teens is Employed

By Invictus

The Wall St. Journal’s editorial page weighed in Friday with a somewhat laughable piece (my title was their sub-hed) on how the 2009 increase in the minimum wage has decimated employment for the 16-19 year old cohort (since 2001). Except for a few inconvenient facts.
As the Journal is quick to point out:
Only 24% of teens, one in four, have jobs, compared to 42% as recently as the summer of 2001.
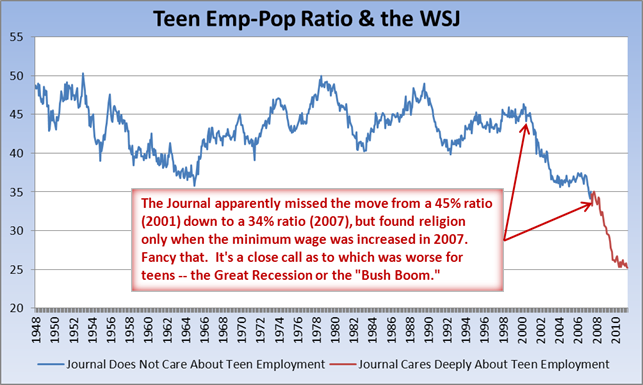
How a minimum wage increase that was enacted first in 2007 is responsible for a teen employment/population ratio that has been declining since 2001 — throughout the other guy’s entire presidency, in fact — is not addressed. Where was the Journal as the rate declined from 44.6 when Bush took office to 30.6 when he left? Where were they when it made a historic low under Bush’s watch (August 2008)?
Journal:
Back on planet Earth, the minimum wage increase has coincided with the plunge in the percentage of working teens. Before the most recent wage hikes, roughly seven million teens were working. Now there are closer to five million with a job and paycheck.
That statement is, sadly, simply false. At the time “before the recent wage hikes” (July 2007), there were 5.888 million teens employed (BLS Series LNS12000012). There are now 4.240 million employed. There have not been “seven million teens” working since the early months of the Bush administration. As for when “the plunge” actually began, see for yourselves:

Source: BLS.gov

The plunge — which began on Bush’s watch and continued through his “boom” — took place during a period when the minimum wage was $5.15/hour and was not raised until 2007. No explanation for that inconvenient fact. Or the inconvenient fact that the teen employment/population ratio rose after the Sept. 1997 increase in the minimum wage to$5.15 (where it stayed until a decade later, when it went to $5.85).
And why only gloss over the fact that teens, generally, are not eligible to make minimum wage in the first place:
Must young workers be paid the minimum wage?
A minimum wage of $4.25 per hour applies to young workers under the age of 20 during their first 90 consecutive calendar days of employment with an employer, as long as their work does not displace other workers. After 90 consecutive days of employment or the employee reaches 20 years of age, whichever comes first, the employee must receive a minimum wage of $7.25 per hour effective July 24, 2009. [Ed note: This would seem to me to cover summertime employment.]
Other programs that allow for payment of less than the full federal minimum wage apply to workers with disabilities, full-time students, and student-learners employed pursuant to sub-minimum wage certificates. These programs are not limited to the employment of young workers.
What minimum wage exceptions apply to full-time students?
The Full-time Student Program is for full-time students employed in retail or service stores, agriculture, or colleges and universities. The employer that hires students can obtain a certificate from the Department of Labor which allows the student to be paid not less than 85% of the minimum wage. The certificate also limits the hours that the student may work to 8 hours in a day and no more than 20 hours a week when school is in session and 40 hours when school is out, and requires the employer to follow all child labor laws. Once students graduate or leave school for good, they must be paid $7.25 per hour effective July 24, 2009.
Oh, and one other thing: The Emp-Pop Ratio for the 55+ cohort (which dwarfs the 16-19 cohort) was on the rise from 1993 through 2008, and has not budged much since then. Demographics do not seem to figure into the Journal’s hypothesis.

Source: BLS.gov

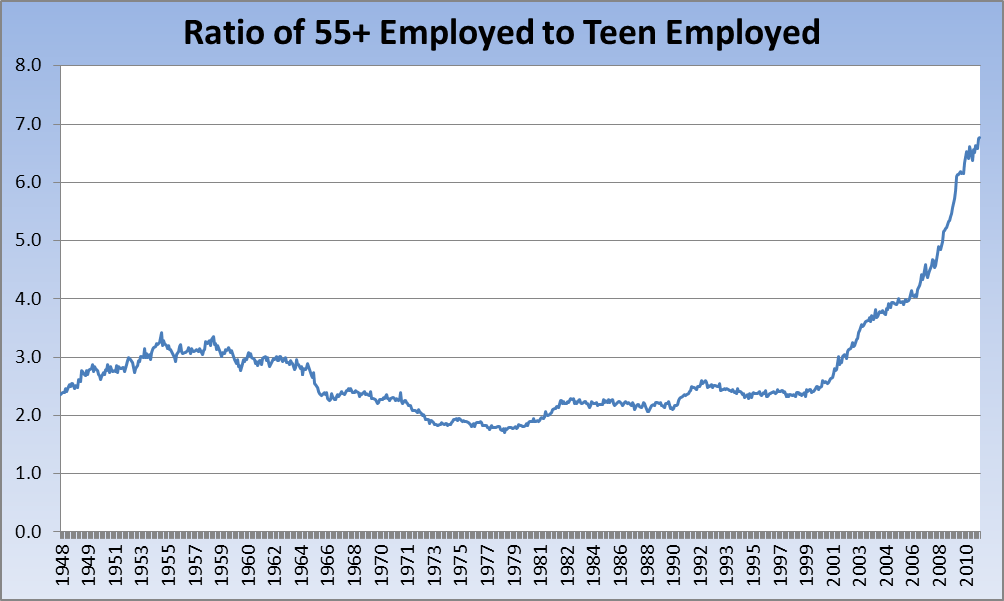
Here’s the ratio of 55+ Employed to Teen Employed. You may notice somethin’ happenin’ here, what it is is exactly clear — in 2001, the exact year referenced by the Journal, the first of the boomers (born in 1946) turned 55. The rest is history:

Source: BLS.gov, analysis

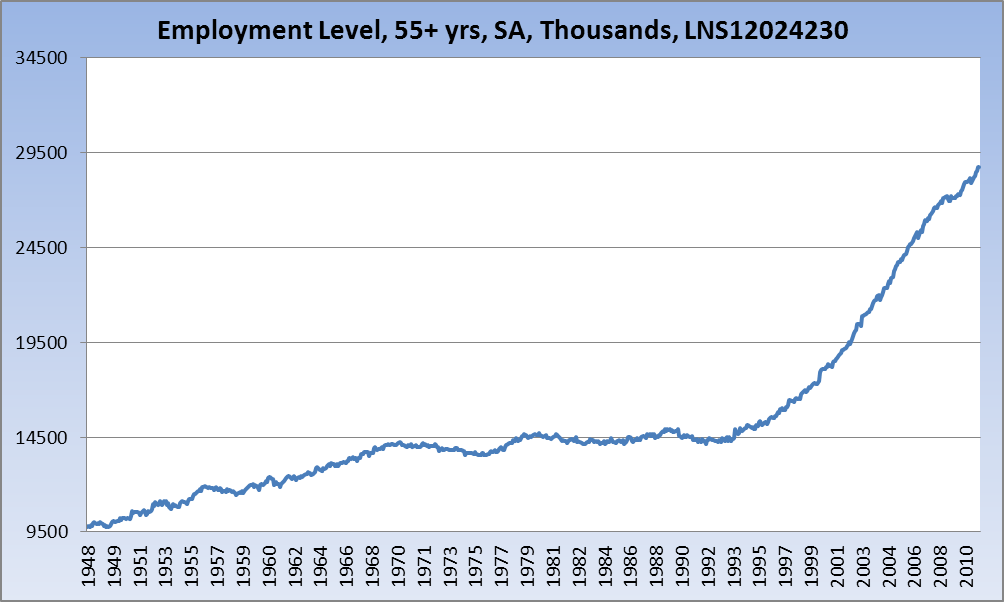
This as the 55+ Employed cohort has grown by over 10 million, from 18.5 million in 2001 to 28.7 million recently:

Shame on the Journal for trotting out this nonsense yet again. It’s embarrassing and, frankly, such hackery should be beneath them. Really, enough already. Please stop. Sigh.

I’ve written previously about this here (almost two years ago), to cite but one of my earlier critiques of this argument.

See the original article >>

Generali - Still The Best Way To Hedge For The Upcoming Italian, And European, Contagion


Back in December, when noting the first material blow out in PIIGS spreads following the first Greek bailout 6 months earlier, we touched upon Italy, and specifically looked at a way to best play the coming shift in Eurozone contagion from the periphery to the core, coming up with one unique corporate name. Back then we said: "We all know what has happened to Italian bond prices in the past weeks: as of today, Bund spreads have just hit a fresh all time high. But all this is irrelevant since the bank must have a capital buffer to accommodate the losses. After all, what idiot would run a company with almost €300 billion in Euro-facing bond exposure and not factor for deterioration in risk after the events of May... Well the ASSGEN CEO may be just such an idiot. The company's balance sheet as of 9/30 discloses that the firm had a mere €10 billion in tangible capital (excluding €10.7 billion in intangible assets). So let's recap: €262 billion in Euro bonds on.... €10 billion in tangible equity! A 26x leverage on what is promptly becoming the most impaired asset class in the world." In a nutshell, Assecurazioni Generali, one of Italy's largest insurers, is a highly levered windsock for Italian and other PIIGS stress, and better yet, can be played in either equity or CDS. Now that the European bond vigilantes are once again looking beyond Greece and focusing particularly on Italy (especially based on recent Sigma X trading), none other than JP Morgan (which just cut its estimates on GASI.MI, a very appropriate equity ticker) validates the thesis that Generali (or ASSGEN per its memorable corporate/CDS ticker) is the best proxy for contagion: "Generali is one of the most sensitive stocks to both the sovereign debt crisis and the implications for the financial sector through both its government, corporate and equity investment portfolios...Generali’s sovereign exposure is mainly concentrated in Europe with Italy accounting for the largest share (37%; home market bias)."

The chart that confirms that GASI is nothing but an inverse bet on Italian viability:


A reminder of ASSGEN's sovereign exposure:


The same data in tabular format:


Some points from JPM's Andreas de Groot van Embden:
Generali’s main risk exposure to sovereign debt outside of Italy include Greece, Portugal, Ireland and Spain. The sovereign bonds are valued at market (accounted as Available For Sale). In aggregate, Generali has €12bn of gross exposure to troubled sovereign debt (excl Italy) and €2.1bn of net exposure (post tax and policyholder participation) accounting for c.14% of TNAV. We have assumed in our analysis that Generali would be able to share the impact of any potential impairments on its sovereign and financial (eg bank) exposures with policyholders given the decline in the minimum guarantees we have seen over the past few years (avg guarantee 2.3% in 2010). In practice the actual allocation will depend on the location of the bonds, the local country profit sharing rules and the level of buffer capital available in those entities (such as the free RfB buffer in Germany).

The Greek exposure is €3.0bn on a gross basis (per year end 2010) and €500m after policyholder participation and tax (based on amortized cost). This accounts for 20% and 3% of 2011e tangible book value on a gross and net basis respectively. We estimate Greek bonds will be valued at an estimated c50% of par based on a 6 year duration at end of 2011 Q2 with an estimated €160m unrealized loss included in shareholders’ equity after policyholder participation and tax. Should the debt rollover discussions be judged a credit event by either the rating agencies or auditors, we estimate that a €160m impairment would be realized through the P&L - assuming the haircut is in line with the market value of the bond. The overall impact on shareholders’ equity would be neutral (as it is already included).

Only if there is an additional haircut on the sovereign exposure that shareholders’ equity would be affected by additional impairments. In solvency terms, Generali includes unrealized gains and losses in its Solvency I and Solvency II calculations and the impairment of Greek debt should already be largely incorporated in our Q2 shareholders’ equity assumptions. Aggregating the main sovereign credit risk exposures outside Italy we estimate this factors in an unrealized loss of €3.2bn gross and €343m net unrealized losses in shareholders’ equity per end of 2011Q2 (see table below). The gap between the gross and net is material but is equivalent to 74bp of traditional life technical reserves. Substantially higher gross losses than those described below might belong more to shareholders than policyholders.
The bottom line, with appropriate sugarcoating:
Overall, a write down in line with current marks on the Greek sovereign debt exposure will not have any incremental impact on the solvency ratio of the group as the debt is already included at market value. However, further swings in the value of sovereign debt, Spanish and Italian in particular will continue to affect TNAV and solvency until the situation stabilizes.
There is much more in the full JP Morgan report but this is the gist: anyone who wishes to play the developing contagion and awakening bond vigilantism via either equity or CDS, this is without doubt the best proxy.
And for those curious how ASSGEN correlates with Italy CDS, here it is:


See the original article >>

Fears grow for Brazil corn as further freeze looms

by Agrimoney.com

Farmers in Brazil are bracing for more frosts which are already believed to have caused losses of up to 30% in corn, "halted" exports, and led to warnings that official crop forecasts may be 5m tonnes too large.
A fresh cold snap, while expected to spare coffee-growing areas freezing temperatures, will tonight bring further frosts to the southern corn-farming states of Parana and Rio Grande do Sul, meteorologists said.
The states have already suffered, last week, frost billed in western Parana as the worst since 2000, and which struck as when 75% of the state's second crop or "safrinha" corn was in the susceptible pollinating or grain-filling stages, according to state farm officials.
Corn in the Maringa region in northern Parana, hit in the flower period, "did not make it", Brazil-based agricultural consultant Kory Melby said.
Downgrades ahead?
The frost has added to the problems facing Brazil's safrinha corn crop, which typically accounts for about 40% of total production of the grain, but has been hurt further north, in Mato Grosso, by the early onset of the dry season – a blow to farmers who were forced, by a delayed soybean harvest, to plant late.
"[Frost] is just the latest problem for the safrinha corn crop, coming on the heels of continued problems in Mato Grosso caused by dry weather," Michael Cordonnier at Soybean and Corn Advisor said.
"Parana had been expected to produce a record safrinha corn crop of 7.4m tonnes, but that is now in doubt and the total production may not even match last year's production of 6.8m tonnes."
Dr Cordonnier said he was preparing to cut by up to 2m tonnes his 53.0m-tonne forecast for Brazil's total corn crop in 2010-11, a downgrade which would leave it well below the official estimate of 56.7m tonnes.
Mr Melby forecast production would be "in the 52m-tonne area".
'Difficult year ahead'
The crop fears have already been reflected in Brazilian corn prices which, unlike those in Chicago, held firm last week.
Furthermore, the prospect of a disappointing safrinha harvest has meant "all corn exports have come to a halt", while potentially presenting a problem for Brazil's livestock farmers in finding sufficient feed to meet needs of well over 40m tonnes a year, Mr Melby said.
There looks to be "a difficult year ahead for chicken and hog producers", he said.

Will Brazil’s Good Times Roll On?


These are the best of times for Brazil. The country has emerged as Latin America’s clear leader and a key global player. Its economy was among the first to rebound strongly from the recent financial crisis, and has since maintained impressive growth. Poverty has been drastically reduced, and income inequality is declining, as the middle class swells. And, thanks to the discovery of vast offshore oil reserves, Brazil not only has become energy-sufficient, but is poised to become a major oil exporter.

Yet, despite all the good news, Brazilians should be worried, because the good times will last only if Brazil addresses a host of mounting economic-policy challenges. Some concern short-term issues; most are of a medium-term nature.

In the short term, it is essential to prevent economic overheating: annual real GDP growth exceeded 10% in 2010, owing to expansionary fiscal and monetary policies and favorable terms of trade. Ensuring that domestic demand decelerates to a more sustainable pace is necessary to moderate the upward pressure on prices that threatens the credibility of the inflation-targeting monetary-policy framework – indeed, in April, the 12-month consumer inflation rate breached the upper limit of the central bank’s tolerance band. Likewise, Brazil must cool its overheated labor market and stem the deterioration in the external balance (which has swung from a small surplus to a deficit of more than 2% of GDP over the last three years, despite a large gain in the terms of trade).

Moderating domestic demand requires, first and foremost, fiscal tightening, because further increases in interest rates, which are already relatively high, would only fuel further capital inflows and put even more upward pressure on the real, which is already over-valued. The authorities have taken initial steps to tighten fiscal policy by announcing significant cuts in the approved budget, but it is estimated that even then, central-government spending will rise by about 4% in real terms in 2011 from its historically high level in 2010. The authorities are complementing moderate fiscal tightening with macro-prudential credit-restraining measures and an array of (mostly tax-based) capital controls.

In the longer term, Brazil faces a range of fiscal-reform challenges. Addressing them successfully would allow the country to generate the savings needed to meet its huge looming public-investment requirements: expansion of productive infrastructure (roads, ports, and airports) in order to remove severe bottlenecks to faster non-inflationary growth; unprecedentedly large planned investment in oil exploration and electricity generation; and forthcoming international sporting events (the World Cup and the Olympic Games) that Brazil will host in the next few years.

Brazil also needs budgetary space to accommodate needed investment in social infrastructure, especially sanitation and basic health-care facilities, in order to reduce the incidence of infectious diseases. It also needs to fund well-targeted programs to reduce poverty further and ensure universal access to basic education; to improve secondary education, with a view to improving the technical skills of the labor force; and to support efficient research and innovation.

Finally, Brazil’s policymakers should aim to remove, or at least significantly reduce, existing tax obstacles to efficiency and competitiveness.

So, what fiscal reforms are needed to meet these objectives?

First, Brazil should adopt a medium-term fiscal framework that targets a gradually declining path for public debt, including a commitment to adjusting the target for the primary budget surplus accordingly. Systematic calculation and publication of cyclically adjusted fiscal indicators would help maintain discipline by promoting accountability, as would other improvements in transparency, especially regarding quasi-fiscal operations and the contingent liabilities of the government and public enterprises. The creation of an independent fiscal council to vet official budgetary projections would also help in meeting fiscal targets.

On the revenue front, Brazil should replace the current state-level value-added tax (VAT), which is riddled with major distortions, and the federal cascading turnover taxes with a modern dual (federal and state) consumption-type VAT, with a common base and a very small number of rates. It should also gradually reduce the plethora of payroll levies that currently add about 50% on average to labor costs, hindering competitiveness and creating a significant incentive to informal employment.

On the expenditure side, Brazil needs a new round of pension reform – clearly a priority, given the rapid aging of the population. Reforms will need to include both increases in the retirement age and changes in benefits, especially the de-linking of the minimum pension from the minimum wage. In addition, a range of civil-service reforms are needed to improve flexibility and increase productivity, while health and education programs require greater cost effectiveness.

In short, despite rosy appearances, Brazil clearly faces a complex and, in some respects, daunting agenda, which newly elected President Dilma Roussef cannot be expected to accomplish within her current mandate. But, it is important that the government make a determined start by picking some “quick wins” to gain credibility with Brazilians and global markets alike.

Brazil is currently benefiting from a favorable external environment, strong international credibility, and unprecedented prosperity for ever-larger segments of the population. But this window of opportunity must not be wasted if Brazil is to consolidate and build upon its current successes.

Follow Us