Friday, June 21, 2013

Live Cattle Futures Surge Higher

By Rick Kment

GENERAL COMMENTS:
Strong gains have developed through the live cattle futures market. This has
overshadowed the pressure in lean hog markets and outside commodity markets.
Corn futures are lower at midday. July corn futures are holding 6 cent losses
at midday. Stock markets are lower in active trade. The Dow Jones is 62 points
lower while Nasdaq is down 32 points.


LIVE CATTLE:
Sharp triple-digit gains have quickly developed across the live cattle
futures market. With aggressive pressure in outside markets over the last
couple trading sessions, there is more and more interest developing into the
live cattle futures market. With markets potentially oversold, buyers are
willing to aggressively push prices higher at the end of the week. Cash cattle
activity remains quiet Friday morning, although bids have quickly developed
through the morning, it may be later in the day before active trade is seen.
Prices have a good chance of ending steady as packers are extremely short
bought at the end of the week. Beef cut-outs at midday are higher, $0.53 per
cwt higher (select) and up $0.24 per cwt (choice) with light movement of 79
total loads reported (28 loads of choice cuts, 30 loads of select cuts, eight
loads of trimmings, 13 loads of ground beef).


FEEDER CATTLE:
Triple-digit gains have quickly developed through the morning with August
futures holding a $2 per cwt rally at midday. This support is developing
following the strong move in live cattle futures as well as additional pressure
through the grain complex. Trade volume is expected to remain light through the
end of the week.


LEAN HOGS:
Moderate to strong pressure has held through the lean hog futures market
Friday morning. The focus on eroding cash markets and the potential that
seasonal tops have been set is starting to limit buyer interest. This could
allow for further pressure to be seen through the end of the session. Cash
prices are lower on the National Daily Direct morning cash hog report. The
weighted average price fell $1.61 per cwt to $98.05 per cwt with the range from
$90.00 to $99.00 per cwt on 2,699 head reported sold. The National Pork Plant
Report reported 176 loads with prices gaining $1.54 per cwt. Lean hog index for
6/18 is at $103.87 up 0.59 with a projected two-day index of $104.19 up 0.32.

See the original article >>

5 Reasons Why Now Is The Time To Buy Bonds

by Lance Roberts

The recent one month spike in interest rates, along with the mind numbing chatter about the end of the "bond bull market," has sent investors scurrying from from the bond market right into the waiting arms of a stock market correction.  Besides being suckered into stocks at the market peak; individuals continue to overlook the significance of fixed income to an overall, long term, portfolio allocation model.   Fixed income reduces portfolio volatility, protects principal (bonds mature at face value) and generates an income stream that contributes to portfolio performance.  The most important reason to own a bond is that when it is purchased the exact rate of return can be immediately calculated to maturity.  This rate of return can be very efficiently modeled into the expected rate of return a portfolio should generate over time.  This is absolutely something that can not be done with a portfolio of other investments that are subject to the volatility of the stock market.

However, the recent spike in interest rates has certainly caught everyone's attention and begs the question is whether the 30-year bond bull market has indeed seen its inevitable end.  The following is 5 reasons why I do not think this is the case and, from a portfolio management perspective, I believe this is a prime opportunity to increase fixed income holdings in portfolios.

International Intrigue

Money hides in U.S. Treasuries for safety when global risks are rising.  As I discussed recently in "Is The Euro-zone Crisis Set To Flare Up?" there are currently many promises that have been made to the financial system by the ECB.  The question is whether or not they can ultimately "cash the check."   I said then that:

"While I do not have certain answers as to the where, the who or the when - I am fairly confident that it will be sooner than we currently imagine."

With yields spiking in the Euro-zone, China showing cracks on its financial front and Greece funding being threatened by the IMF it is likely that we will begin to see a rotation of excess reserves and investment dollars back into the "safe haven" of U.S. bonds to reduce default risks.

Economic Weakness

Another positive for U.S. bonds, which coincides with the international front, is domestic economic weakness.  Weaker economic growth will weigh on the stock market as earnings growth continues to deteriorate which, in turn, will likely make the relative safety of bonds much more attractive.  Despite much commentary to the contrary history shows that interest rates tend to follow the strength, or weakness of the broad economy.  The chart below shows the annual rate of change for 10-year treasury rates and real GDP.

Interest-Rate-GDP-062213

Dis-Inflation

While the Fed currently has a target of 2% on inflation, so does Japan, it doesn't mean that the have any real control over inflationary pressures in the market.  Inflation is ultimately a function of economic activity, employment and production and wages.  As I discussed just recently in "Deflation: The Fed's Real Worry" the Fed's biggest fear is the negative economic impact of deflation.  The headwinds facing the economy currently are structural in nature and are not something that continued rounds of liquidity injections have been able to fix.

Interest-Rate-Inflation-062113-2 As shown in the chart above interest rates tend to follow inflation.  While interest rates have spiked in the last month, a move that has the Fed "more than a little baffled", the decline in both current inflation, as well as future expectations, will likely keep a lid on interest rates through the remainder of this year.

Political Showdowns

Coming soon to a "kabuki" theater near you will be the second annual revival of the "debt ceiling debate." While I am not suggesting that we will have an exact repeat of the 2011 debacle - it is quite likely that IF the threat of "debt default" begins to surface, once again, interest rates will fall as money seeks a "safe haven" against political turmoil.  The chart below shows what happened to interest rates in the summer of 2011.

Interest-Rate-2011-062113

The recent surge, while it has been quite dramatic, has only returned interest rates back to where they were just two short years ago.  With the debt ceiling debate once again looming, the Euro-crisis simmering, Japan faltering and China showing cracks in their financial armor there is only one real place left for the world to store their excess reserves in "safety."

Technically Opportunistic

Lastly, despite all of the other commentary and rhetoric in the market as of the last month, interest rates are pushing extreme overbought levels.  The chart below shows a weekly chart of interest as compared to its long term moving average.   Currently, at more than 3-standard deviations overbought, the level of interest rates is unsustainable and a correction is in order.  In the chart I have noted (vertical blue lines) every time that the 10-year interest rate has touched 3-standard deviations above the long term mean.  In every single case, over the last 10-years, that was the absolute peak of the move higher.  It is unlikely to be "different this time."

Interest-Rate-Overbought-062113

With a downside target of 1.8% currently, which is simply a retracement to the mean, there is a fairly low risk entry point for bonds at the current time.  Furthermore, if the recent market "sell signal" is validated it is likely that interest rates could fall as low as 1.5%.

Bonds Look Cheap

For all of these reasons I am bullish on the bond market through the end of this year.   Furthermore, with market volatility rising, economic weakness creeping in and plenty of catalysts to send stocks lower - bonds will continue to hedge long only portfolios against meaningful market declines while providing an income stream.

Will the "bond bull" market eventually come to an end?  Yes, it will, eventually.  However, the catalysts needed to create the type of economic growth required to drive interest rates substantially higher, as we saw previous to the 1980's, are simply not available currently.  This will likely be the case for many years to come as the Fed, and the administration, come to the inevitable conclusion that we are now in a "liquidity trap" along with the bulk of developed countries.  While there is certainly not a tremendous amount of downside left for interest rates to fall in the current environment - there is also not a tremendous amount of room for them to rise until they begin to negatively impact consumption, housing and investment.  It is likely that we will remain trapped within the current trading range for quite a while longer as the economy continues to "muddle" along.

See the original article >>

Coffee price to stay low bringing growers more woe

by Agrimoney.com

Arabica coffee prices are to remain weak despite falling below the cost of production for most growers, Macquarie said, warning that government efforts to support growers may be encouraging surplus output.

The plunge of more than 60% in arabica coffee futures from their 2011 highs has left prices "below costs of production in most of the key producer regions", the bank said, estimating that beans in Brazil costs some 126 cents a pound to grow, and in Colombia more than 160 cents a pound.

"Costs have been steadily increasing over the past 10 years in Brazil, in line with wage and land inflation, rising input costs and the stronger - up until recently, that is – Brazilian real," Macquarie analyst Kona Haque said.

"Colombia, the world's second-largest arabica producer, has suffered from even higher costs, due to an expensive renovation programme, adverse weather and a strong peso."

'Prices to stay low'

Normally, a fall in prices - which on Thursday hit 116.90 cents a pound in New York for the spot July contract, a four-year low for a spot contract, while the better-traded September lot touched 117.10 cents a pound – below output costs would choke off supplies by making producing uneconomic.

But for coffee, Macquarie warned investors: "Don't export support" for prices.

"Being a perennial crop, production response can be slow," Ms Haque said.

Furthermore, thanks to government support programmes in the likes of Brazil, which this week unveiled a R$3.16bn ($1.4bn) support package for growers, "we continue to see large supplies next season too".

Prices look set "to remain below costs of production for a while longer, until such time that world consumption absorbs the surplus".

'Another huge crop'

Even if producers save costs by cutting back on fertilizers, the legacy of expanded plantings in time of strong prices will support output.

"Coffee trees will continue to yield cherries even with minimal care, so long as weather is benign, particularly as producers are often loath to skimp on nutrient application, as generating a good harvest is part of their DNA," Ms Haque said.

Brazil, the top arabica grower, could be on for "another huge crop" of 55m bags in 2013-14, a rise of 2m bags year on year, simply because of it being an "on" year in the two-year cycle of higher and lower producing years.

"There are murmurings that today's low prices are encouraging some [Brazilian] producers to consider moving some of their coffee land into cattle - though interestingly not sugar cane or oranges, both of which compete for land, but where prices are equally negative," she said.

However, the prospect of government support "is another argument why we do not see a drop in [arabica] production next season, despite prices falling through Brazilian costs of production."

Arabica coffee for September stood 2.0% higher at 120.70 cents a pound in lunchtime deals in New York.

See the original article >>

Bullard says Fed may need to boost QE if inflation slows further

By Steve Matthews

Federal Reserve Bank of St. Louis President James Bullard said the central bank may need to increase monthly asset purchases above the current $85 billion pace if inflation slows further below its 2% goal.

The Federal Open Market Committee “will face a decision if inflation continues to decline,” Bullard said today in a telephone interview from Washington. “Then the committee will have to make a decision about how to provide more accommodation.”

Bullard, 52, dissented from the FOMC’s June 19 decision to maintain the pace of asset purchases, saying the panel should “signal more strongly its willingness to defend its inflation goal.” In a statement earlier today, he said the Fed “inappropriately timed” a plan to start trimming bond purchases later this year, saying it should have waited for signs the economy is gaining strength and inflation is picking up.

The FOMC should have highlighted low inflation in its statement and indicated that “we can be more accommodative than we otherwise would have been,” he said in the interview.

Chairman Ben S. Bernanke, at a June 19 press conference following the statement, said the Fed may start “to moderate the monthly pace of purchases later this year” and end the program around mid-2014 if the economy performs as forecast. The bond buying will be cut by $20 billion at the Sept. 17-18 policy meeting, according to 44% of economists, a plurality, in a Bloomberg News survey released yesterday.

Prices as measured by the personal consumption expenditures index, a gage watched by the Fed, rose 0.7% for the year ending April. Excluding food and energy, the index rose 1.1%, matching the lowest in the 53 years of record-keeping.

While Bernanke called the decline in inflation “transitory,” Bullard said policy makers’ forecasts released this week show inflation won’t return to target until 2015 or later.

Food Costs

Commodities prices, which influence the cost of food and energy, have moved lower on reduced worldwide demand, Bullard said.

“The committee’s forecasts make it look like it is not” transitory, he said. “Europe is in recession -- one of the biggest economies in the world. China has been slower than expected.” Identifying what will cause prices to move higher as the FOMC expects is a “great question,” he said.

Rising U.S. Treasury yields partly reflect signs of stronger growth, as well as investors’ expectations of a sooner- than-expected pulling-back of bond buying, Bullard said. Rising inflation-adjusted interest rates represent a tightening of financial conditions that could slow economic growth, he said.

“I do think it is a risk,” Bullard said.

Too Focused

Bullard said the FOMC is too focused on unemployment, which is largely affected by elements outside of its control and has fallen faster than the Fed expected.

The St. Louis Fed president lowered his forecasts for this year’s pace of economic growth to 2.8% from 3%. He predicted the jobless rate would fall to 7.1% at the end of the year from 7.6% in May.

“We should get back to focusing on what we can do in the medium term, which is keep inflation close to target, and put less weight on labor-market outcomes,” he said.

The U.S. central bank began its third round of large-scale asset purchases in September by buying $40 billion a month of mortgage-backed securities. It added $45 billion of Treasury purchases in December. The FOMC has said since September that it will buy bonds until seeing signs of substantial labor-market improvement.

See the original article >>

As social unrest escalates, Brazil investors flee

by SoberLook

The wide-spread social unrest across Brazil continues.

The Guardian: - Brazil's president, Dilma Rousseff, and key ministers are to hold an emergency
meeting on Friday following a night of protests that saw Rio de Janeiro and dozens of other cities echo with percussion grenades and swirl with teargas as riot police scattered the biggest demonstrations in more than two decades.
The protests were sparked last week by opposition to rising bus fares, but they have spread rapidly to encompass a range of grievances, as was evident from the placards. "Stop corruption. Change Brazil"; "Halt evictions"; "Come to the street. It's the only place we don't pay taxes"; "Government failure to understand education will lead to revolution". Rousseff's office said she had cancelled a trip to Japan next week.
Many are asking how is it that this "economic miracle" has generated so much anger. As discussed earlier (see post), Brazil's tremendous growth combined with the wealth of natural resources masked a number of problems. Taxes and corruption are of course a big part of the issue. Allocation of certain resources to high profile projects at the expense of healthcare and education is another. But as has been the case throughout history, social unrest is often triggered by rising prices - particularly on items that the average citizen cares about.

Source: The NY Times

Active investors have become increasingly jittery (both foreign and domestic). The real has dropped to 2.25 per dollar and the stock market continues to tank (down 22% year-to-date). What's particularly alarming however is the sell-off in government bonds. Even the short end of the curve has not been spared. The one-year note yield just rose above 10%. The concerns seem to be less about the government's ability to repay as they are about currency devaluation. Whatever the case, this is a troubling development that has the potential of spreading across other economies. The global capital markets are now even more susceptible to contagion than they were in 1997 during the Asian financial crisis.

Source: Investing.com

See the original article >>

Did You Summer-Proof Your Portfolio?

by Tom Aspray

As markets around the world dropped sharply in reaction to Fed Chairman Ben Bernanke’s statement many are wondering how long this pullback might last and what it means for the long-term market trend.

There was no place hide on Thursday as all ten S&P 500 sectors had sizable losses and gold dropped $90 per ounce, closing below $1300. It was clearly a rush for the exits as there was certainly some panic selling as we have seen several times since the 2009 market lows.

This was the correction I have been expecting for a couple of months, and at the end May, I recommended that you summer-proof your portfolio. If you did, you should have been better prepared to weather the current storm.

The important thing to remember is that the major trend for the stock market is still positive, which means that there will be great buying opportunities before the fall. The media is noting that this was the worst decline since November 2011 but fail to mention that the market completed its bottom just a few weeks later.

I do not expect this correction to be over that quickly. The severity and timing of the drop in the past two days was a surprise to me as there was technical improvement early in the week, which turned out to be a fake out.

The main question is what’s likely to happen next? The extremely negative market internals Thursday makes a strong rebound likely by next week. This rebound however is likely to fail and the next downside targets for the S&P 500 are at 1550-1650 or $155-$156 in the Spyder Trust (SPY).

Some of the financial “talking heads” that did not believe the rally until February or March are already starting to turn bearish. This is a positive sign for the intermediate term as a higher level of fear is needed before the current correction can end.

This decline will eventually set up a good buying opportunity as the NYSE Advance/Decline did confirm the May highs, so the major trend remains positive. Let’s examine the technical evidence.

chart
Click to Enlarge

Chart Analysis: The daily chart of the NYSE Composite shows the sharply lower opening Thursday and the close at the daily starc- band.

  • The near-term uptrend, line a, was broken with the 38.2% Fibonacci retracement support at 8757, which is 2.6% below current levels.
  • This is calculated just from the November lows with the 50% support at 8464.
  • The McClellan oscillator dropped down to -234 after testing the zero line.
  • It is still well above the prior lows at -283 and -311.
  • The NYSE A/D line was the weakest early in the week, and as it turns out, was giving a more accurate reading of the market’s health.
  • The A/D line support at line c, was broken in early June, and it has now resumed the downtrend after slightly surpassing its declining WMA.
  • There is strong resistance now in the 9180-9300 area.

The Spyder Trust (SPY) closed just below the April high at $159.80 as the near-term uptrend, line d, was broken.

  • The 38.2% support is at $155.94, which is just over 2% below Thursday’s close.
  • For next week, the starc- band is at $155.74 with the 50% retracement support at $151.89.
  • The on-balance volume (OBV) did close below its support at line e, which had held on the last correction.
  • The S&P 500 A/D line was one of the strongest early in the week as it broke its short-term downtrend and closed above initial resistance.
  • The reversal in the A/D line reaffirms the break of support (line f) but the A/D line is still above its previous two lows.
  • The longer-term support for the A/D line is now at line g.
  • There is first resistance now at $161.30 with the monthly pivot at $163.24.

chart
Click to Enlarge

The PowerShares QQQ Trust (QQQ) also gapped lower Thursday but closed above the September high at $70.84 line a. The monthly pivot support is at $70.68.

  • The 38.2% Fibonacci support is at $69.72, which also corresponds to more important chart support.
  • The uptrend, line b, is at $68.85 with the 50% retracement support at $68.11.
  • The A/D Line moved through its short-term downtrend, line c, before it reversed. It is now close to its recent lows and support from the September highs.
  • The A/D is still well above the more important support, line d, from the late 2012 lows.
  • There is initial resistance now at $72 to $72.80 with more important in the $74 area.
  • The volume Thursday was heavy but did not exceed the levels seen in early June.

The iShares Russell 2000 Index (IWM) was the strongest early in the week as it closed above the resistance at $99.20, which was a fake out like what was seen recently in crude oil.

  • IWM is now back to the March highs at $95.10 and closed just above the daily starc- band at $74.63.
  • For next week, the weekly starc- band will be around $91.46 with the 38.2% support level at $91.12.
  • The OBV has dropped back below its WMA and the previous lows but is still well above the daily support at line f.
  • The Russell 2000 A/D line shows a similar formation as the OBV, and it has also reversed to the downside.
  • There is more important support for the A/D line at the uptrend, line g.
  • There is a first band of resistance now in the $97.90 to $98.32 area.

What It Means: The focus is likely to be on the downside for the next several weeks and possibly longer. For those who are still uncomfortably long stocks, the recent action reaffirms the benefits of taking partial profits on strength and having a clear game plan for your portfolio.

I would expect a good bounce from the $155-$156 area in the Spyder Trust (SPY), but it could eventually drop down to the $148 to $152 area.

With well over 80% in cash in the Charts In Play Portfolio, I did some light buying Wednesday, which was like stepping in front of a speeding train. The focus on risk and entry levels will minimize the damage on these new positions, and I will be looking at the monthly charts to find stocks that are bottoming ahead of the market.

If you sold some of your long positions in the past two days, I hope it was part of your plan and not selling based on fear. If you are uncomfortable with your current equity exposure, reduce it on the expected sharp rebound.

How to Profit: No new recommendation.

Portfolio Update: For Wal-Mart Stores Inc. (WMT), I went 50% long at $75.51 and 50% long at $75.12, which was stopped out at $73.14 for an approximate 2.9% loss.

For PowerShares QQQ Trust (QQQ), I am now 50% long at $72.84 and 50% long at $71.88, with a stop at $69.28.

For Intuit Inc. (INTU), I am now 50% long at $58.43 and 50% long at $57.78 (the low Thursday was $57.78). with a stop at $55.31.

See the original article >>

Has the Great Crisis Finally Arrived?

by Graham Summers

The technical damage from yesterday’s bloodbath was severe.

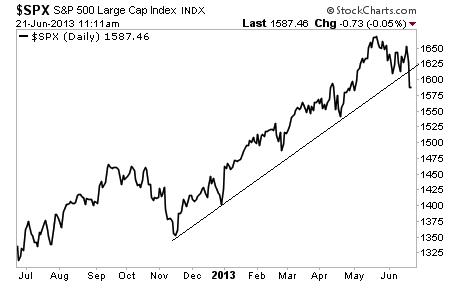
Spain, which lead the “Europe is saved” party from the lows last year has just taken out its trendline. So much for the “crisis is over” proclamations. We’re heading back down in a big way.

The S&P 500 has also taken out its trendline. QE Forever is dead and buried. What will hold the market up now?

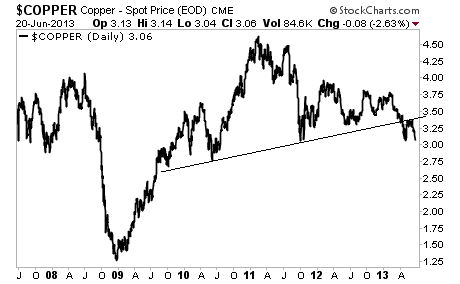
Copper is indicating that the entire post-2009 “recovery” is ending. We’re moving back into the 2008-collapse.

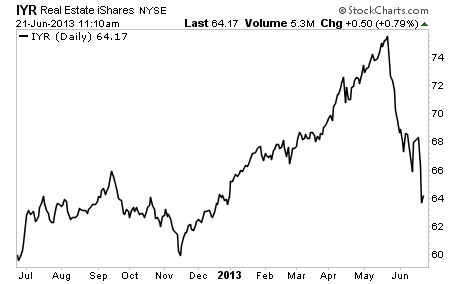
Real estate is totally imploding. Yesterday’s drop saw a very nasty return to “reality.”

See the original article >>

Why Spain And Italy Are Like Cyprus, Slovenia, And Greece

by Tyler Durden

The "XXXXX is not YYYYY" jokes aside, Europe's union of nations is beginning to separate increasingly between the haves and the have-nots. The sad truth, as Bloomberg's Niraj Shah notes, is that recession/depression has pushed Spanish and Italian GDP-per-capita below the EU average in purchasing power terms - just like Cyprus, Slovenia, and Greece. Irish GDP per capita was 29% above the average, while Greek and Portuguese per capita output were 25% below. Output per head for the EU ranged between 47% (Bulgaria) and 271% (Luxembourg) of the average. With today's news that retroactive ESM recaps are unlikely, the banking-sovereign symbiosis of Spain and Italy will increasingly come under pressure and with productivity so dismal, there is little hope for now.

See the original article >>

Managing gold volatility with option spreads

By James Ramelli

Spot gold and gold futures markets have been thrown into disarray following Ben Bernanke’s appearance at Wednesday’s Federal Reserve Q&A session. Gold and gold derivatives prices were maintained by the central bank’s stimulus program, as many investors see the precious metal and its counterparts as being the most effective possible inflationary hedges. In the market conditions that the Federal Reserve’s implied intentions would generate, inflation would no longer be a pressing concern, and demand for gold as a protective instrument would theoretically unwind.

Price action in gold has followed a trend that an adherent to the aforementioned belief system would expect; spot and futures markets have both tumbled as far as 7% following the announcement. This trend has, however, been interrupted by Chinese buyers this morning, who paired with Indian markets were able to pull gold out of its most recent slump during April of this year. The efforts of these and other overnight buyers the world over lifted the price of spot gold by 1.51%, and August gold futures were boosted by 0.80%.  This time, however, it doesn’t appear that demand from China or India, the latter of which having been hobbled by government controls on imported gold, will be enough to save the value of gold. To compare, bullion futures slid down 6.4% in the day’s trading in New York to reach $1,268.70/ounce, the lowest level it has reached since mid-2010. The yellow metal will likely show further downward action in the near term, as a significant round number has been broken in $1,300 and fearful gold hoarders are pressured into selling off their deteriorating fortunes.

So how can a trader speculate on movements in the gold markets?

  1. Trade physical gold. Although this would offer the best exposure to the price of gold it is extremely capital intensive.
  2. Trade the ETF’s. There are several ETF products to choose from that offer exposure to the spot price of gold and double and triple ETF’s can offer some leverage to investors. However, all ETF’s have expense ratios built in so they can never track their underlying 100%.
  3. Gold futures and options. Using gold futures and options offers the inherent leverage and capital efficiency that make them an attractive alternative to physical gold or ETFs. Using futures and options is the most efficient way to speculate on gold in the short term.

If we want to take a trade in gold we first must calculate upside and downside targets. With August gold futures trading around $1,295.00 we can use the August 1295 straddle to derive targets. With the straddle trading at $76.00 this implies an upward or downward move of $76.00 by August expiration. This gives us an upside target of $1,371.00 and a downside target of $1,219.00. We can now use these targets to set up a bullish or bearish strategy.

Bearish Strategy

Trade: Buying the /GC Aug 1240-1220 Put Spread for $5.00
Risk: $500 per 1 lot
Reward: $1,500 per 1 lot
Breakeven: $1,235.00

This trade sets up for a 3-to-1 return on invested capital if gold futures trade below the downside target on expiration.

Click to enlarge.

Bullish Strategy

Trade: Buying the /GC Aug. 1350-1370 Call Spread for $4.90
Risk: $490 per 1 lot
Reward: $1,510 per 1 lot
Breakeven: $1,354.90

This trade also sets up for a better than 3-to-1 return on invested capital if gold futures trade above the August upside target on expiration.

With increased volatility in gold markets after the Fed announcement, it is especially important for traders to look for setups with good reward-to-risk ratios.

Click to enlarge.

See the original article >>

Cocoa, cotton fall as U.S. dollar rally sends commodities scurrying

By Jack Scoville

COCOA 

General Comments: Futures closed lower as the U.S. dollar rallied. Fears of an economic slowdown created by Fed tapering of the QE program created selling in all commodities yesterday. There was not a lot of news for the market, and price action reflected this. Ideas of weak demand after the recent big rally kept some selling interest around. The weather is good in West Africa, with more moderate temperatures and some rains. The mid-crop harvest is about over, and less than expected production along with smaller beans is reported. Malaysia and Indonesia crops appear to be in good condition and weather is called favorable.

Overnight News: Scattered showers are expected in West Africa. Temperatures will average near to above normal. Malaysia and Indonesia should see episodes of isolated showers. Temperatures should average near normal. Brazil will get mostly dry conditions and warm temperatures. ICE certified stocks are lower today at 5.033 million bags. ICE said that 0 delivery notices were posted today and that total deliveries for the month are 120 contracts.

Chart Trends: Trends in New York are down with no objectives. Support is at 2140, 2105, and 2080 September, with resistance at 2200, 2230, and 2250 September. Trends in London are down with objectives of 1380 and 1270 September. Support is at 1430, 1360, and 1320 September, with resistance at 1450, 1470, and 1490 September.

COTTON

General Comments: Futures were lower again on what appeared to be long liquidation from speculators and perhaps some farm selling. The Sharp rally in the US Dollar and disappointing economic news from China caused the selling interest to develop. Export sales were less, adding to selling interest. Ideas of better weather in US production areas were once again negative for prices. Some storms are moving through western Texas and conditions there are improving. Good weather is being reported in the Delta and Southeast as well. The weather has improved, and looks to improve conditions generally through the rest of the week. Scattered showers are forecast for the Delta and Southeast, and wetter and warm weather is expected in Texas. Weather for Cotton appears good in India, Pakistan, and China. It is possible that futures made at least a short term high on Friday.

Overnight News: The Delta and Southeast will see some showers this weekend. Temperatures will average above normal. Texas will get showers today, then dry weather. Temperatures will average above normal. The USDA spot price is now 81.34 ct/lb. ICE said that certified Cotton stocks are now 0.562 million bales, from 0.550 million yesterday.

Chart Trends: Trends in Cotton are down with no objectives. Support is at 85.15, 84.75, and 84.55 October, with resistance of 87.10, 88.20, and 89.60 October.

FCOJ

General Comments: Futures closed slightly lower, but held support near 1540.00 in the nearby contract. Futures have been working generally lower as showers have been seen and conditions are said to have improved in almost the entire state. Ideas are that the better precipitation will help trees fight the greening disease. Traders are wrestling with more reports of losses from greening disease on the one side and beneficial rains that have hit the state on the other. Greening disease and what it might mean to production prospects continues to be a primary support item and will be for several years. Temperatures are warm in the state, but there are showers reported somewhere in the state every day now. The Valencia harvest is continuing. Brazil is seeing near to above normal temperatures and mostly dry weather, but showers are possible next week.

Overnight News: Florida weather forecasts call for showers. Temperatures will average near to above normal.

Chart Trends: Trends in FCOJ are down with objectives of 141.00, 133.00, and 130.00 July. Support is at 142.00, 139.00, and 137.50 July, with resistance at 145.00, 146.50, and 150.00 July.

COFFEE

General Comments: Futures were sharply lower as the Real fell and the US Dollar rallied on the Fed announcements and some weak economic data from China. It was a bad day as trends in all three markets turned back down. However, futures also got to or closet o the final down side objectives for the down trend, so it is possible that the market can rally going into the weekend. Arabica cash markets remain quiet right now and Robusta selling interest has become less, as well. Most sellers, including Brazil, are quiet and are waiting for futures to move higher. Buyers are interested on cheap differentials, and might start to force the issue if prices hold and start to move higher in the short term. Brazil weather is forecast to show dry conditions, but no cold weather. There are some forecasts for cold weather to develop in Brazil early next week, but so far the market is not concerned. Current crop development is still good this year in Brazil. Central America crops are seeing good rains now. Colombia is reported to have good conditions.

Overnight News: Certified stocks are little changed today and are about 2.748 million bags. The ICO composite price is now 113.37 ct/lb. Brazil should get dry weather except for some showers in the southwest on Sunday. All areas could get showers early next week. Temperatures will average near to above normal. Colombia should get scattered showers, and Central America and Mexico should get showers, with some big rains possible in central and southern Mexico and northern Central America. Temperatures should average near to above normal. ICE said that 132 delivery notices were posted against July today and that total deliveries for the month are now 666 contracts.

Chart Trends: Trends in New York are down with no objectives. Support is at 116.00, 113.00, and 110.00 September, and resistance is at 122.00, 123.50, and 125.00 September. Trends in London are mixed to down with objectives of 1670 and 1580 September. Support is at 1705, 1680, and 1650 September, and resistance is at 1755, 1775, and 1800 September. Trends in Sao Paulo are down with no objectives. Support is at 140.00, 137.00, and 134.00 September, and resistance is at 148.00, 151.00, and 155.00 September.

SUGAR 

General Comments: Futures closed sharply lower on strength in the US Dollar and weakness in the Brazilian Real, combined with disappointing economic news from China. Trends flipped to down with the price action yesterday, and some follow through selling is possible on Friday or early next week. Traders remain bearish on ideas of big supplies, especially from Brazil. Traders in Brazil expect big production as the weather is good. Demand is said to be strong from North Africa and the Middle East. ICE said that a Sugar storage facility in Paranagua, Brazil, was damaged by fire this week and that deliveries could be affected.

Overnight News: Showers are expected in Brazil, mostly in the south and southwest late this weekend and in all areas next week. Temperatures should average near to above normal.

Chart Trends: Trends in New York are mixed to down with objectives of 1640 and 1580 October. Support is at 1665, 1650, and 1620 October, and resistance is at 1700, 1720, and 1730 October. Trends in London are mixed to down with objectives of 458.00 and 441.00 October. Support is at 469.00, 466.00, and 463.00 October, and resistance is at 475.00, 480.00, and 484.00 October.

See the original article >>

China: Financial Crisis or Controlled Steam Release?

by John Lounsbury

Econintersect:  While many focused on the announcement (repeated from many previous meetings) that the U.S. Federal Reserve would start ending the latest QE (quantitative easing) program sometime in the future as the cause for massive global stock sell-offs Wednesday afternoon and Thursday, some feel that China had a role in the debacle.  Some think that China is a bigger deal in this event than is the Fed.  One of those is Lee Adler.  See GEI Investing.

Follow up:

Short-term interbank interest rates in China continued to soar Thursday (20 June 2013), with the SHIBOR (Shanghai Interbank Offered Rate) overnight rate listed at 13.4% and the 1-month rate at 9.4% as this is written.  How rapidly the situation has escalated is illustrated in the following two graphics.

shibor-overnight-2013-June-19-20

shibor-1-month-2013-June-19-20
Click on either graphic for larger image.

It is clear that the PBOC (People's Bank of China) was not engaged in a 0ne-day warning shot earlier in the week when they did not supply the added liquidity the financial system had expected. If this continues through Friday it must be considered that this is where the PBOC has drawn a line in the sand and will try to hold the course until enough steam is released by the overheated banking (and shadow banking) system to bring the growth of credit down to a lower rate.

As reported by GEI News yesterday, in 2013 the rate of credit growth had picked up to a rate of 22-23% for the first five months of the year, compared to 20% growth in 2012.  The high rate of growth of credit is needed by a high rate of investment and that is counter to the government's rebalancing strategy to shift more of the economy away from investment and towards consumption.  This is considered essential for China to have a sustainable economic future.  The result of this government induced "crisis" could well be some seriously bruised financial interests along with a slower rate of growth necessary for the long-term.

GEI contributor Michael Pettis has suggested that China needs to get down to a 3% GDP growth rate to have a sustainable economy and expects that to happen over the next few years.  The Economist disagrees with Pettis and they have made a public bet on whether China's GDP will slow as much as Pettis suggests.  See GEI Opinion.

Macro Business has offered a nice summary of possible outcomes for the current liquidity squeeze in China:

So what happens next? There are four categories of outcome. The first is that Chinese leaders back off on the credit crunch and nothing happens, in which case they’ll probably just try the strategy again later. The second is that they press on and it works miraculously, cleaning out the financial system without causing too much pain. The third is that this spirals out of control, maybe because Beijing underestimated the risk or acted too late, potentially sending the global economy lurching once more. The fourth, and probably most likely, is that this works but is painful, averting catastrophe but slowing the Chinese economy after 20 years of miraculous growth.

Another factor that may be influencing the PBIC action is the build-up of a carry trade which has increased the flow into China of lower interest currencies such as the U.S. dollar and euro.  This has been surging in recent months and could create a big "unwinding problem" for China if the flows were to be reversed.  A significant source of these flows through international banking flows has come from the Fed's QE.  If that does start to taper, the flows into China could slow and then reverse if foreign interest rates began to rise.

China may simply be trying to get ahead of the curve and slow down the inflows now to reduce the size of flow reversals later.

See a detailed discussion of the carry trade situation at Macro Business.

Note added at 2:00am EST: Bloomberg reports that rates were falling in the early morning in Shanghai as the PBOC was said to have made funds available to ease the liquidity squeeze.

See the original article >>

Thursday Stock Market Thump – Bernanke Blows His Chance

By: PhilStockWorld

NOW it's getting interesting.

We got our big Wheee! on oil overnight to $96.37 (/CL) with the old contract (/CLN3) at $96.11. If it weren't a scam, then why would the August contract fall just because July is expiring today. In fact, wouldn't the Aug contract be more in demand from rolling while the July is selling off? But no, they go down together to make sure the NYMEX boys can do those rolls as cheaply as possible to keep the scam going another month.

Sorry to go on about this but I've decided to make more people aware of what's going in in the hopes that, someday, one of you will happen to talk to someone who matters and something actually gets done about this stuff. In fact, my article yesterday was refused by a syndicator yesterday (who shall remain nameless for the moment only). That has only happened once before and also when I was critical of the oil scam. They're owned by VCs now and who knows what their agenda is. Just another example of the top 1% taking control of the media while the sheeple have the illusion that they're reading a "free" press.

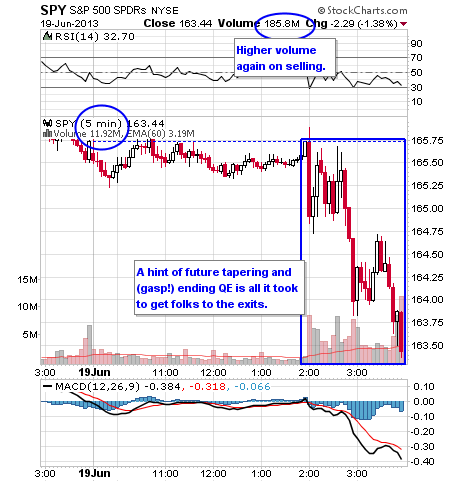
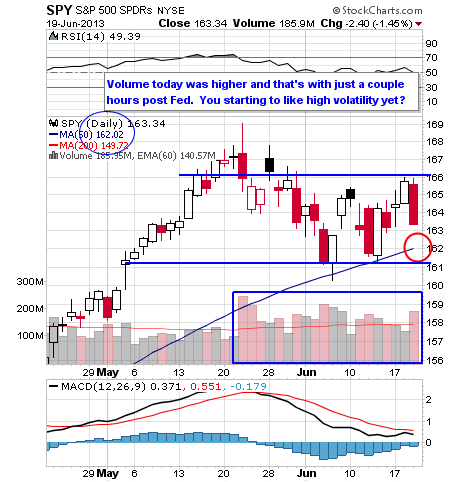
After being down around 1.5% yesterday, the Futures are down 0.75% this morning (7:30) and a decelerating decline is not so bad so we'll see if we can escape with this minor correction but I'm pretty confident in my Dow 15,000 prediction for today – the Futures have already failed it at 14,940. 14,900 should be some support, as should 1,600 on the S&P and 966 on the RUT but the Nas has already failed to hold 2,937(/NQ), which was S1 in the Futures. If they don't get it together by the open, that could indicate another 1.5% drop today. I already sent out an Alert to our Members with levels we can play to the upside (and Tweeted here) but, so far, all we're doing is weak bouncing off the big drop.

Asia, which we were already concerned about, is down 2.5% across the board. Keep in mind, that's the 5% Rule as it's very hard for major indexes to fall more than that in a day and they were, generally, saved by the bell.

Europe's majors are all down 2% at the open and any time you have lock-synch moves…

See the original article >>

Batten Down the Tatches for a Perfect Stock Market Storm!

By: Anthony_Cherniawski

Good Morning!

Yesterday was quite a day. I took a crew down to Wabash, IN to help “dig out” a friend who suffered a direct hit by a tornado. Fortunately, the city of Wabash has a wood recycling operation, so we only had to move the limbs and more than a few mature trees to the street for pickup. When we were done, the stack of logs and branches was nearly a block long by about 4 feet high!

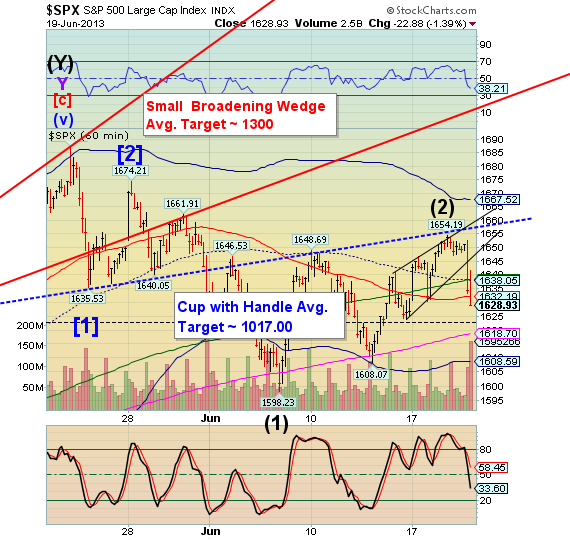
The SPX futures declined to 1605.95 last night and are experiencing a mild bounce (still beneath the 50-day m.a.) prior to a busy economic announcement schedule this morning. These include;

o *Unemployment claims 8:30am

o * PMI Manufacturing Index 8:58am

o *Existing Home Sales 10am

o *Philadelphia Fed Index 10am

o *Leading Economic Indicators 10am

Here is a summary of the first report, “In the week ending June 15, the advance figure for seasonally adjusted initial claims was 354,000, an increase of 18,000 from the previous week's revised figure of 336,000. The 4-week moving average was 348,250, an increase of 2,500 from the previous week's revised average of 345,750.

Futures are coming down again and there’s no telling where they will end. Chances are that the 50-day moving average was already retested in the futures, so while still a possibility, we may see an open beneath the hourly Cycle Bottom support/resistance at 1608.59. What a time for a sell-off!

Tomorrow is quadruple witching and the volatility will likely go through the roof! This is the setup for the perfect storm, notwithstanding problem in other markets as well!

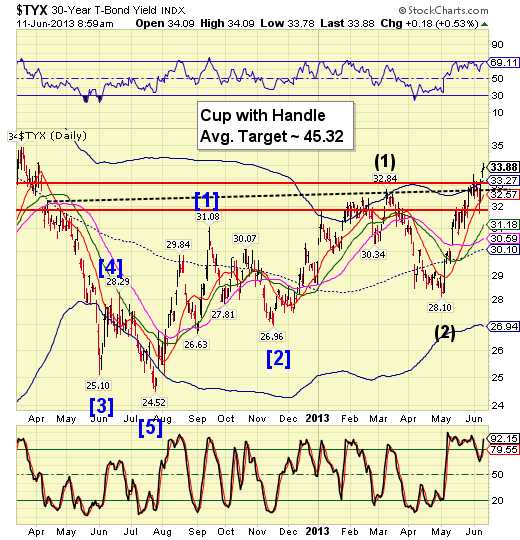
TYS has broken out above the Lip of its Cup with Handle formation, which is extremely bullish for yields. In a recent study released by the Fed, the authors had a rise in interest rates to 4.5% would cripple the Fed and leave it impotent to continue its bond purchases. The study further suggested that interest rates might rise to that level no sooner than 2015.

Well, the future is now. Their forecasting model, if they even have one, is broken. Unfortunately, Obama doesn’t want the Fed to stop buying treasuries. Thus we see Bernanke’s fall from favor. Bernanke knows what is happening to the markets and wants to avoid it, but he may be being set up as the fall guy for the market crash.

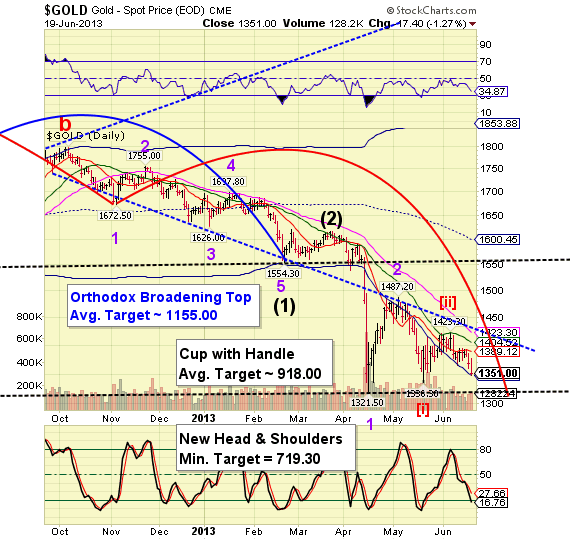
Gold futures dropped to 1293.00 in the overnight markets. It is clearly broken and is now in a potential free-fall.

There is no place to hide in risk assets, including treasuries.

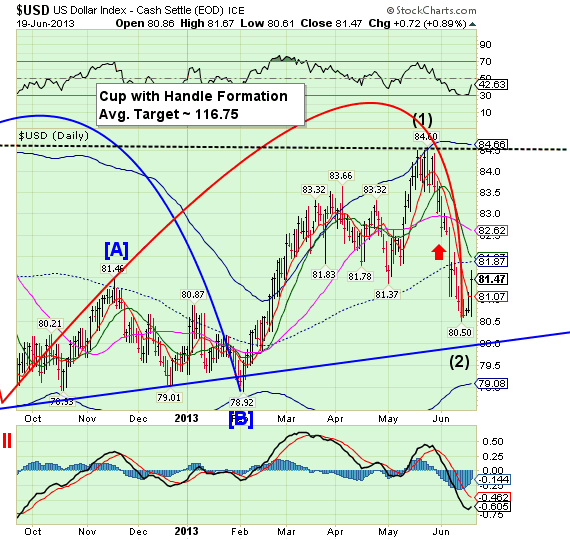
USD surged to 82.20 in the overnight markets and is currently hovering near 82.04. It has risen above both mid-Cycle resistance and Intermediate-term resistance, which will now provide support for the rally. The last bastion of resistance is the 50-day moving average at 82.62, which may be challenged or broken today, IMO.

This will be one of the best long plays for the summer.

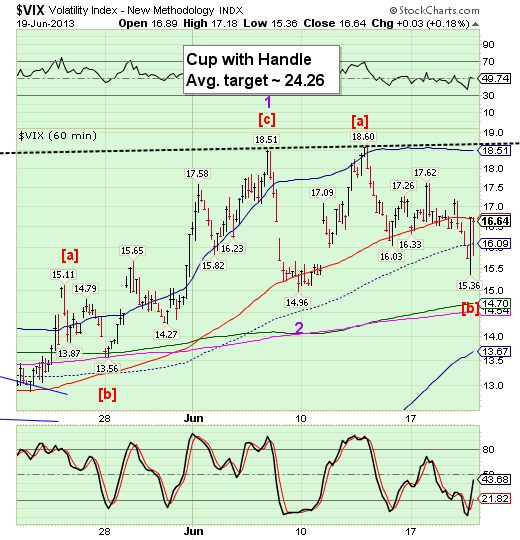
Despite VIX’s relatively poor performance yesterday, the VIX futures are at 18.38. VIX futures are somewhat higher than the cash market shown in the chart. We think that the poor performan=ce may be due to paired trades, where long positions are linked with a hedge. In this case it would be either VIX futures or a derivative (ETF) of VIX. I think that this is something that Wall Street “cooked up” to suppress the VIX while the market is being sold. It shouldn’t last long, though.

All the best!

See the original article >>

Will Rising Interest Rates Ruin the Economic Recovery?

By: Clif_Droke

Sometimes words speak louder than actions. That has certainly been the case lately with the Fed hinting that it may taper off asset purchases by the end of this year.
On Wednesday, Fed Chairman Bernanke said the Federal Reserve would keep monetary policy loose a while longer but hinted that the days of easing may be numbered. Bernanke said that the Fed may wind down its quantitative easing (QE) program if the economy continues to improve.

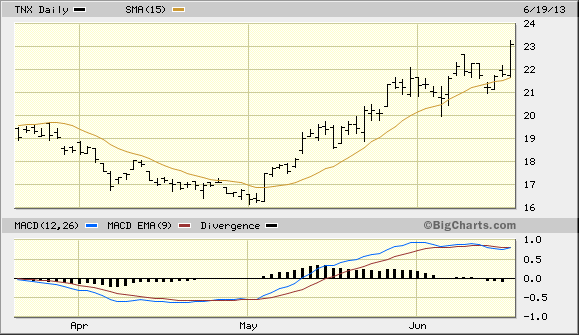
Stock investors weren’t happy with the news and the major averages were down by more than 1% at the close on Wednesday. Tellingly, the 10-year Treasury Yield Index (TNX) was up nearly 6% after the Fed’s announcement – its highest level since March 2012.

The mere hint that the Fed may back off from QE has been enough to send bond yields the world over to their highest levels in over a year. Bond prices in emerging countries have fallen as investors have pulled their money out of global bonds. The spillover impact of this rise in bond yields was felt immediately in several financial sectors. Global stock prices were down, with Japan’s Nikkei index falling 20% into nominal bear market territory in just a few weeks. The Nikkei’s decline was also partly in response to the Bank of Japan’s recent refusal to accelerate its recent efforts at monetary easing.
Global stock markets clearly don’t like the idea of rising interest rates, nor do they like the idea of a slowdown in central bank money printing. This remains a very interest rate-sensitive financial market, and rightfully so: we’re still almost a year-and-a-half away from the bottom of the 120-year Kress deflationary cycle and markets today are predicated on the idea of low interest rates. That why an increase in interest rates is bound to upset the apple cart and lead to a sell-off in equities and other assets.
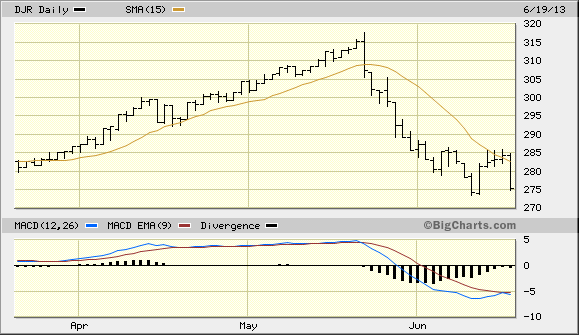
There is a school of thought among some economists that rising bond yields are actually a sign of economic strength. One noted economist has gone so far as to state: “Higher rates normally accompany a healthier economy; they only rarely weaken an economy. This is all very good news.” I respectfully disagree. Higher rates in an economy that is still weakened by deflationary undercurrents can only be bad news. This is especially true when one of the leading sectors of growth within the economy, namely real estate, has come to rely on low rates. Indeed, we’ve already seen in just a few short weeks the destruction that rising rates can do to rate-sensitive industries such as real estate. Witness the sharp decline in the Dow Jones REIT Index (DJR), which fell nearly 15% in just over two weeks.

I would also point out that while the rising interest rate trend isn’t sufficiently established enough to be a major threat to the stock market or the economy, it has the potential to create problems down the road if it continues. In many ways the rising rates (and falling bond prices) are beginning to resemble what happened in 1994 when a bond market sell-off added to the pressure of the S&L crisis to hit equities hard. Not coincidentally the 20-year Kress cycle, a component of the 120-year cycle, bottomed in late 1994 and is now entering its final “hard down” phase into 2014.
The celebrated recovery in real estate in the last couple of years has been almost exclusively based on low mortgage rates. Much of the recovery in consumer retail spending is a direct result of the real estate bounce back. One could almost say, “As goes real estate, so goes the economy,” so it behooves us to carefully consider the question posed in the above headline.

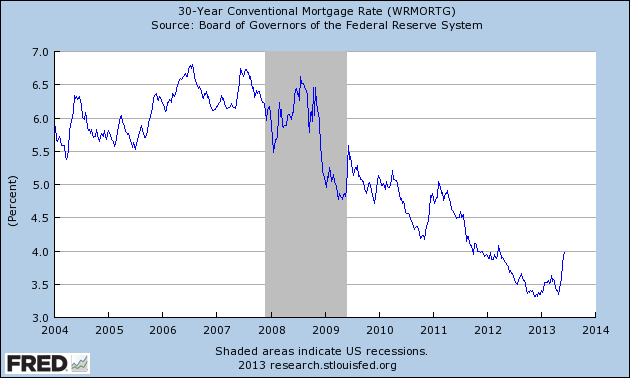
It’s worth pointing out that mortgage rates, like all other types of rates, are on the rise. The average rate for 30-year fixed rate mortgages 4.12% as of June 19, according to Freddie Mac. One year ago the average 30-year FRM was 3.84%. After falling for eight consecutive weeks earlier this spring and nearly hitting an all-time low, rates have risen the past few weeks on the back of the rally in Treasury yields. The Mortgage Bankers Association (MBA), which represents the real estate finance industry, predicts 30-year mortgage rates will rise to 4.4% by the end of this year. Does anyone dare suggest the housing market will simply shrug off even a minor increase in rates over the next several months?
The dominant longer-term trend for interest rates is clearly down, however, as you can see in the following graph. The trend for the 30-year conventional mortgage rate is defined by the chart pattern of lower highs and lower lows which has been established since 2006. As Robert Campbell said in a recent issue of his Real Estate Timing Letter, “Until the actions of the Fed speak otherwise, Fed policy is currently working to push mortgage rates down.”

The bottom line is that while the longer-term rate trend is down, as long as the intermediate-term interest rate trend is up it can still create significant volatility for both equity and real estate markets. And as we learned from the lesson of 1994, even a temporary rate increase is nothing to scoff at.
Gold
A growing number of asset managers from high profile investment banks foresee a gold breakdown, however. Could they be correct in their dire prediction? Ordinarily we could answer that question in the negative. After all, fund managers have a historical tendency to be wrong at major inflection points. But this isn’t an inflection point for gold, at least not yet. What we’re dealing with here is a possible continuation of a well-established trend that has been in place for almost two years. The crowd (and by “crowd” we can include fund managers) can be right during the final “hard down” portion of a major bear market, much like they were during the final months of the 2008 credit crisis.
Also worth pointing out is that downside momentum and negative investor sentiment both tend to feed on itself during the last stages of a major decline. With so many hedge funds responsible for the short-term moves in commodities like gold, all it takes is for a herd mentality to develop and the next thing you know there can be a self-fulfilling sell-off underway.
Just how bearish has the crowd become on the yellow metal? Based on a Bloomberg survey, the number of traders expressing bearish views on gold increased to its highest level this year. Confirming this widespread bearish sentiment, gold-backed ETP holdings fell to a two-year low of 2,117 metric tons last week. While some investors looked for the Chinese to lend support to the physical gold market with continued purchases of physical bullion, the cards appear to be stacked against gold in the short term.

2014: America's Date With Destiny

Take a journey into the future with me as we discover what the future may unfold in the fateful period leading up to - and following - the 120-year cycle bottom in late 2014.

Picking up where I left off in my previous work, The Stock Market Cycles, I expand on the Kress cycle narrative and explain how the 120-year Mega cycle influences the market, the economy and other aspects of American life and culture. My latest book, 2014: America's Date With Destiny, examines the most vital issues facing America and the global economy in the 2-3 years ahead.

The new book explains that the credit crisis of 2008 was merely the prelude in an intensifying global credit storm. If the basis for my prediction continue true to form - namely the long-term Kress cycles - the worst part of the crisis lies ahead in the year 2014. The book is now available for sale at: http://www.clifdroke.com/books/destiny.html

Order today to receive your autographed copy and a FREE 1-month trial subscription to the Gold & Silver Stock Report newsletter.

See the original article >>

European DisasterZone

By tothetick

Europe looks like a disaster-zone right now.

There are days when you wake up and you know something is going to hit the fan in untimely fashion. That’s when you are more than likely to want to roll over and go back to sleep, but the nagging little voice tells you to get up and face it like a man. Today is the longest day of the year, and today more than any other day, it looks like some chimp (just have to work out who the chimp is!) has been launching missiles in your direction as you stand in front of the fan.

Europe is a disaster-zone. Here’s the round-up of what’s going wrong right now. The longest day? It would have been a long day, whatever happened, so you might as well enjoy it.

Greece

Eurozone: Greece

Eurozone: Greece

Greece announced this morning that the Greek Democratic Left Party, headed by Fotis Kouvelis, has taken the drastic decision to tell its ministers to withdraw from the coalition government in the kafuffle over the halting of all broadcasting for the national television and radio stations. A strong majority have decided to back Kouvelis (without official numbers being released as of yet).

Confirmation has just this very minute been published after a press conference meaning that the withdrawal will result in a mandatory reshuffle of the cabinet. It might still continue as a minority administration, but the ministers and secretaries of state will leave.

The trouble just adds fuel to the fire that means that there is market volatility and International Monetary Fund statements being issued that they will pull the plug unless the Eurozone finds the money that Greece is lacking. Ten-year Greek bonds rose to their highest since April, at 11.41%.

France

Eurozone: France

Eurozone: France

French President, François Hollande, is in for a tough ride today too. He recently stated on a state visit to Japan that the recession was over. He also stated yesterday in a press conference that he was on target to reduce unemployment by the end of the year. The INSEE (national statistics office of France) issued a report today stating that he should think and then think again about the improving situation. It isn’t likely to happen this year at all.

Unemployment is set, according to their forecasts, to increase until well into December. Hollande spoke of the difference between those that make ‘forecasts’ and those that are ‘willing’ to make change. Mind over matter? The INSEE sees unemployment increasing by 113 thousand this year (but admits that this will be at a slower rate than in 2012). It will reach 10.7% by December 2013.

Luxembourg

Eurozone

Eurozone

Finance Ministers are meeting today, and probably for the rest of tonight to slog it out in what looks like a slanging match of the year over the one-size-fits-all financial policies regarding the failing banks and how they should be propped up in EU-member states. Britain and France will be aiming for individuality, whereas others want across-the-board decisions that will be the same for everyone. Who will get to pull the blanket furthest to their side of the bed?

Germany

Eurozone: Germany and Turkey

Eurozone: Germany and Turkey

Germany and Turkey are in for a rough ride. The Chancellor of Germany, Angela Merkel made a comment during a press conference about Turkey’s way of dealing with protestors. It’s the word chosen that has aroused Turkish delights. She said the crackdown was “appalling”. In a tit-for-tat reply, Egemen Bagis, the Turkish Minister for EU Relations said that Merkel was only trying to block their entry into the EU and notch up a few points for her forthcoming election bid in September. Does anybody actually still want to stay in the EU? There are a good few that are actually trying to scramble out of the Union, but Turkey is still harping on about getting in. Who would want to go to a party that has finished?

The Turkish ambassador has been summoned for a ticking off and a wrap over his knuckles. Analysts are saying that the already-cooler-than-cold relations between the EU and Turkey will now hit freezing point. Turkey will be out in the cold for quite a while by the looks of things.

Conclusions?

If the worst comes to the worst, close the curtains, draw the blinds, pull the shutters; let the world implode. At least, you will get a good night’s rest. The innocent and the honest always sleep soundly. But there are the ones that understand that the stuff hitting the fan is just like dust on the sideboard and the bookshelf: it will just keep coming back if you try to get rid of it. The dust will be there tomorrow. If you understand that, you will sleep even more soundly. I can hear them snoring at the Federal Reserve and the European Central Bank and the Bank of England and the Bank of Japan and the Bank of…it’s the sound of the printing presses, soothing music to your ears, just like the gentle jolt of an intercity train, chugging along. Sends you off to sleep. Sweet dreams?

See the original article >>

You decide the title …

Market Tops Form "At The Margin"

by Tyler Durden

Yesterday, Federal Reserve Chairman Ben Bernanke likened monetary policy to landing a jet on an aircraft carrier which reminded ConvergEx's Nick Colas of a few choice 'Top Gun' quotes...  "Son, your ego is writing checks your body can’t cash" seems most appropriate. But Colas' review of a recent academic paper on the social dynamics of how long people applaud - and why they stop - is perhaps useful in comprehending the market's reaction.  The funny thing about the work is that the distribution of ‘Clapping duration’ looks pretty much exactly like the P/E ratio of the U.S. equity market going back to the 1800s.  Why do people start and stop their applause or buy into a stock market?  It all happens "at the margin" in both cases, and just a few people putting their hands in their pockets is enough to get the rest to stopWe still can’t get “Highway to the Danger Zone” out of our head.

Via ConvergEx's Nick Colas:

One of the most entertaining features of the 1980s is that the entire decade is neatly summed up by just 2 movies: “Top Gun” and “Wall Street”. The first glamorized the defense industry, one of the big industrial winners of the day, and the other codified the public’s perception of modern finance.  Who can forget “Greed is good” or Maverick buzzing the tower?  Good times…

I had an 80s flashback today when Federal Reserve Chairman Ben Bernanke likened the challenges of managing monetary policy to landing a jet on an aircraft carrier. Now, the Chairman bears very little resemblance to Tom Cruise, to be sure.  But in my mind’s eye there was Dr. Bernanke in a flight suit trash talking his fellow naval aviators in the ready room.  The thought didn’t really get as far as figuring out who might play the doomed “Goose” character, but I suppose the current chatter about San Francisco President Janet Yellen taking the reins next year makes her the logical choice.  Since her job isn’t as dangerous as the #2 on an F-18, I expect she will be fine.

As tempting as it would be – and consistent with the spirit of these notes  - to find some similarities between dog fighting and monetary policy, that’s not where we are going today.  If you need to take a moment and put on Kenny Loggins’ “Highway to the Danger Zone”, I understand.

I recently read a novel study by some European researchers about how long people applaud.  They taped a variety of audiences at college lectures and then parsed out when and how long individuals gave the requisite round of clapping after a lecture.  The goal of the work was to understand how “Social” issues – the manner in which individuals response to the actions of others – change human behavior and how long an impact they might have.  This is a hot topic at the moment, given the valuations given to social networking companies.  If there are discernible clues to how people join groups and how long they stay, leveraging these observations would be the veritable pot of gold at the end of the rainbow.

What struck me about the study, however, was distribution graph of how often the population being studied actually clapped. There is a link to the study at the end of this note, but here is a brief description:

  • The distribution of claps is a typical “Bell curve, anchored at zero (no clapping) on the left and with a longish tail on the right.  A few people clap a lot, evidently.
  • The average number of times someone claps at a lecture was about 10.  The fat part of the distribution is 5-15 claps.
  • No one clap-count had more than 10% of the observations.  It is unusual for people to clap exactly the same amount repeatedly, which also makes sense.

The bit that surprised me was that the clap-count graph looks pretty much like the typical market P/E ratio histogram we’re all used to seeing.

Yes, there are plenty of ways to value the stock market, but the Price/Earnings ratio is still the most widely quoted.  The relevant data from this graph is:

  • The most common P/E ratio based on current earnings is 14 times.
  • The “Chunky middle” of the distribution is 12-18 times (remember this data goes back to 1871).
  • There are a handful of long-tail high multiple periods (north of 30) and a few (10 years) at or below a 10 P/E.

Now, there are plenty of naturally occurring data sets which exhibit the same kind of sloppy “Normal” distributions, but this comparison makes some intuitive sense to me. Stock valuation is essentially a form of ‘Approval’ that investors are confidence in the fundamental underpinnings of the equity market.  And, of course, clapping is a sign of approval from an audience about a just-witnessed performance.  Consider that the U.S. stock market currently trades for 15x current year earnings, and you’ve got a pretty typical level of “Approval” that fundamentals are reasonably robust.   At least as strong as the average of the last 130 years or so.  Not bad.

So what gets a group of people to stop clapping, and are there any lessons for those of us who look at capital markets? Here is what the researchers found on this point:

  • Applause starts with just a few people in an audience and gathers steam.  The end of the clapping starts in much the same way, with a few participants putting their hands down.  It’s not like everyone stops at the same time, followed by eerie silence.
  • Humans are social animals, and once people see that others in the crowd have stopped applauding, they quickly cease as well.
  • You don’t need to be near a just-stopped-clapping person to be aware that the number of people applauding has diminished. Just hearing the level of noise created diminish slightly is enough to get the rest of the group to stop quickly.

Put in Wall Street parlance, applause happens “At the margin” with a few people starting up and others joining in. The analogy to capital markets activity is clear.  Bottoms form when investors begin to value potential investments more highly than the previous day or week or month.  The resultant price action entices others to “Join in” and the perceived value of the assets in question rise further.  One set of hands clapping becomes many, then all...

The reverse process is how markets form tops. When everyone is clapping there’s no one left to add to the noise.  Then someone stops, and someone else sees that.  They stop.  The noise begins to fade, just a little at first.  But as it becomes perceptible to everyone, human nature kicks in.  Who wants to be the last guy or gal clapping?  Everyone will stare… The applause stops quickly at that point.

In the end, this is a simple analysis, but one which speaks to capital markets as essentially large “Social networks”, and that is an intuitively appealing construct.  Attention and engagement ebb and flow based on macro confidence, micro financial results, and other fundamental inputs.  Valuation becomes an analysis of whether more or fewer investors will be clapping next month or next quarter.  But one thing is for sure – you want to be among the first people to clap and quit when the noise is the loudest.

Getting that bit right is the hard part.

See the original article >>
The Technical Argument to Buy Treasuries

by Greg Harmon

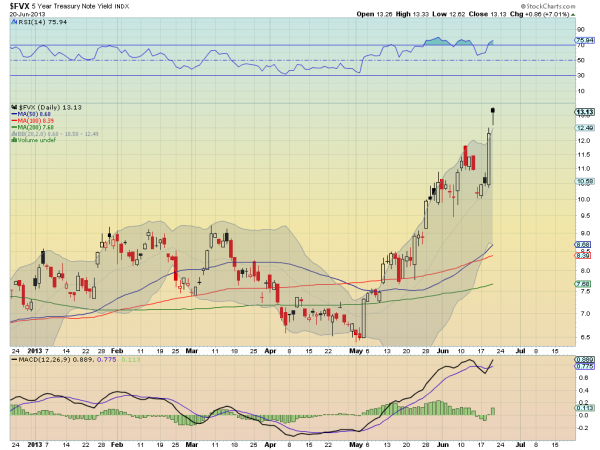
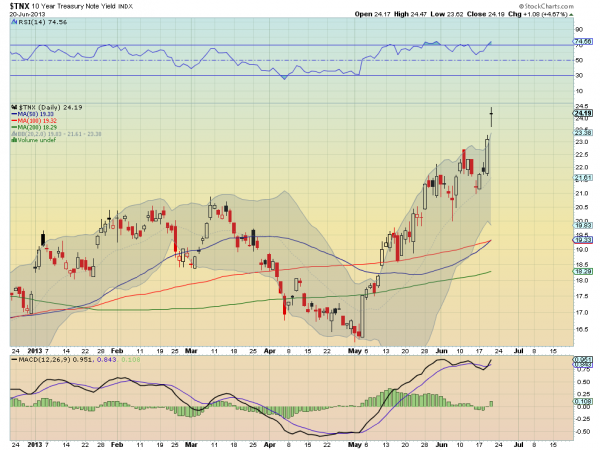
If only for a short term bounce. The charts of the yield of 5-, 10- and 30-year Treasuries have all had tremendous moves higher out of a base from early May. On a short term basis they all look overbought and ready for a a pullback. This could be a one or two day move or a longer travel back to the base. Here is what to look for.

5-Year Treasury Note Yield
fvx

The 5-Year Treasury has moved from a yield of 75-90 basis points (bp) up to over 130bp. In doing so it has broken out of the top of the Bollinger bands, and Thursday printed a Hanging Man candle. Confirming lower Friday would signal a reversal with a target of a 38.3% retracement at least to 107bp. The Relative Strength Index is also in technically overbought territory, where it has triggered minor falls in yield previously. This is closest approximated by the ETF $SHY.

10-Year Treasury Note Yield
tnx

The 10-Year Treasury has moved from a yield of 1.63% in early May to a peak at 2.45% Thursday. The Shooting Star Doji print would also signal a reversal to lower yields if confirmed Friday. Out of the Bollinger bands as well, it too is technically overbought on the RSI. A 38.2% pullback on this targets the 2.14% area. The closet ETF to this is the $IEF.

30-Year Treasury Bond Yield
tyx

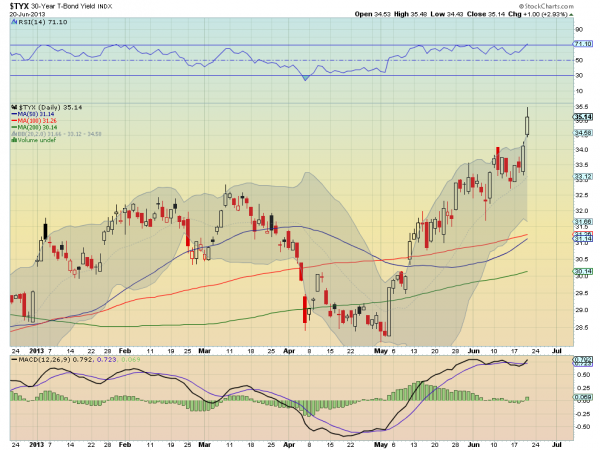
Finally the 30-Year Treasury has moved from 281bp up to a high of 355bp. This 74bp move has resulted the the yield moving out of the Bollinger bands and into technically overbought territory as well. A 38.2% retracement on the 30-year would take it back to 327bp. This is closest to the ETF $TLT.

Each of these instruments has a Moving Average Convergence Divergence indicator (MACD) that is leveled but trying to move higher. This is a reminder that they do not need to correct this time. They could continue and become more overbought. The confirmation lower is what is needed to turn the analysis into a trade. Remember that Treasury prices trade inversely to yields so to trade these corrections in the ETF’s you will need to buy them.

See the original article >>
Joe Friday…Most index’s above support after 350 point Dow decline!

by Chris Kimble


CLICK ON CHART TO ENLARGE

The Dow declined 353 points yesterday, wiping out 6 weeks worth of gains. The decline has become a major focus of the media.  Did the decline break support levels from where the rally started in the fall of 2012?

Joe Friday....Despite the large decline yesterday and the softness over the past month, support from last falls lows is still in place!

For the market to be in trouble, support first has to go and so far, it has NOT...

See the original article >>
Eurozone Banks: Confidence Gone!

By tothetick

As if the Greeks don’t have enough to deal with right now with their country cut off from the benefits of a national television and radio station. What is it they say in the UK? Something like ‘when it rains it pours’. You might as well get your brollies out boys and girls, as this one looks like it is going to come down in torrents. You might also, with just a hint of imagery and poetic license, say that Europe has decided to pile it on with a shovel in heapfulls right now. Talk about kick a man while he is down.

Eurozone

Eurozone

The European Union prided itself on their motto of ‘United in Diversity’. That was chosen back in 2000, when the Euro was nothing more than a twinkle in the eye of the founding fathers. It still had two years of gestation before it would see the light of day on that historic 1st January 2002.

United in diversity, cultural diversity and ethnic origins, ideas and ways of thinking. The modern-day melting-pot-come-salad-bowl, with the French as the tangy onions and the Brits as the squashed tomatoes of the EU, with just a dash of sharp vinegar from the Germans to keep everybody smarting as it got tossed in the air. Literally, the diversity-unity conundrum did get tossed somewhere. Somewhere out of reach, it seems.

Eurozone: Diveristy

Eurozone: Diveristy

Today, the motto should be changed. It’s more like ‘Disunity with Adversity’. Now, the Eurozone banks have started refusing to lend to each other, spreading the word that confidence has ebbed yet lower in the stakes, in the wake of the bailouts that have taken place.

Data from the European Central Bank shows that interbank lending is back to what it was at the start of the Euro, when everybody had cold feet and nobody knew if Bank A was telling the truth to Bank B and if Country C was telling fibs over the state of its economy. Then, things picked up and lending went wild. But, the white lies are the worst ones to swallow. They leave a bitter taste. Insidious little baskets (of olives)! Some might say that they were right to have cold feet.

Cross-border lending between banks in the Eurozone dropped to 22.5% in April. It stood at 34.5% before the financial crisis put the dampers on all that. European banks have closed in upon themselves and gone into hiding like jack-rabbits. They are more interested and more confident in their domestic markets. Although, is that surprising? Get your own house into order before you can start helping somebody else out, right? Analysts have shown that German interbank funding fell by 11.2% compared with March 2012. That means that there has been the equivalent of €29.5 billion withdrawn from the German economy alone. Greece has suffered a loss of €18 billion being withdrawn from the banking system. Germany might be able to stand that sort of withdrawal, but the question as to whether or not Greece can is definitely not hard to answer. Portugal has had a reduction of 25%, on average.

The European Central Bank issued a statement saying that it had nothing to do with confidence or mistrust.

But, if the banks aren’t lending to each other, it means that there isn’t the money entering the economy. No money means the real economy isn’t getting its hands on the credit. Banks are wary about extending credit to other members of the EU when they look back at the bail-out that was necessary in Cyprus when one of its major banks had to close, making creditors put up with the losses incurred.

European Union Finance Ministers are meeting today in Luxemburg to discuss resolutions regarding how banks are wound up in order to create some sort of uniformity across the EU (member states do not have the same laws regarding which creditors are to be paid out in the event of a bank going bankrupt). The objective is to put the onus on the private creditors rather than making the taxpayer foot the bill. At last! If they do come to an agreement we won’t be talking of a bail-out, but a bail-in in the future.

However, those decisions might look good to the taxpayer, but they are eating away at confidence in the banking sector. Large deposit holders look like they are worrying about the fact that private creditors may not be able to bail-in the banks that fail in the future, simply because they too will be failing, crushed under the losses. Nervousness means that they might decide to withdraw deposits and nobody needs anyone to draw a picture of what will happen then.

All of this comes at the same time (remember: it never rains, but pours?) as the International Monetary Fund’s decision was announced that it will suspend payments that are aiding Greece in July if the Eurozone does not patch up the shortfall (roughly €3 billion-€4 billion) in the rescue plan (worth €172 billion). International-Monetary Fund regulations stipulate that governments must prove that they have financing that is 12 months ahead in order to receive disbursement. Funding will be interrupted (if they stick to the book) since Greece only has financing covered until this time 2014. Given the current mistrust of the finances of other economies in the Eurozone, it looks doubtful if pulling that one off is going to be an easy task.

Mistrust is viral. Once it has set in and it cankers away at the banking system, it will take a hell of a change to bring it back and make it swing the other way.

See the original article >>

Chinese Banks Ready to Go Bust

By tothetick

Dive! Take cover! Or, at least, hold on to your pants in the scramble. The Chines bubble has just burst. It looks like the world is going to have egg on its face and elsewhere as Chinese banks are scrambling to get the hands on cash.

Chinese cash rates didn’t just increase they shot through the roof today, Friday June 21st. This is not hyperbole. This is not exaggeration. They reached 25% when they were at their peak, and the only thing that calmed them down was the talk of a possible cash injection from the Chinese central bank. Rates dropped to 10%.

Some analysts are saying that the People’s Bank of China is trying to make a point to smaller banks that are using short-term funding for trading rather than lending that money out. That’s dicing with death some analysts reckon as some of the smaller banks are nearing collapse.

Overnight bond purchase rates are the measure of the cost of liquidity and the rates are double what they are expected to be at the present time (8.4920% today, which is lower than Thursday’s 11.62%, but still higher than they should be).

Two banks have refused to acknowledge that they received emergency loans from the People’s Bank of China last night to bail them out of trouble. Others say that they are strapped for cash. To boot, they are not just the small fish in the financial banking sector. The world’s largest bank in terms of assets was mentioned as being one of those banks (The Industrial and Commercial Bank of China). If the biggest banks in the world are currently strapped for cash, because they have been trading with that cash, then we may be preparing for another financial meltdown around the world. This time the question is: will it be bigger than the 2008 one? By the looks of it, yes. In 2008, China suffered also from the financial crisis around the world, but managed to maintain some sort of economic growth. Have the financial crisis and poor banking practices trickled through to the Chinese banks today leaving them without a cent available?

People's Bank of China

People's Bank of China

However, rates have not, according to analysts affected the economy as of yet. State-owned enterprises have enough cash for the moment to be able to get through a credit squeeze if there is one, although small companies are suffering already, apparently.  Some are saying that the credit crisis is like nothing that we have ever had to go through yet.

All eyes are fixed on the Shibor (Shanghai Interbank Offered Rate), which is calculated by averaging all the interbank lending rates. There are 18 commercial banks included in the price quotation and it is the barometer of Chinese credit liquidity. The two charts show the worrying progression of the Shibor.

China: O/N Shibor

China: O/N Shibor

China: Shibor 21st June 2013

China: Shibor 21st June 2013

The Libor surge prior to the Lehman Brother’s bankruptcy and the ensuing spiraling fall to hell recall the somber times of the financial crisis in 2008. Are we in store for the same?

But, the economies of China and the western world back in 2008 are not identical. Mature economies would be begging the central bank to act and double quick. Such high rates of interbank lending in the western world would scare the banks out of their living daylights. China often sees banks strapped for cash in particular just before holiday seasons when people tend to withdraw greater quantities of cash. Deposits dry up regularly before Dragon Boat Festival, so that’s nothing new. What is new, however, is that the People’s Bank of China has done little to ease that situation. In fact, it has made it worse, by withdrawing liquidity by selling three-month bills.   China sold CNY2 billion in bills on Tuesday (at a yield of 2.9089%). This was the starting gun for the message that was winging its way to the banks in China telling them that they had to start lending, as the People’s Bank of China would not come to their aid. With liquidity being withdrawn, banks decided to hoard cash and stop lending. The credit squeeze was on and liquidity became scarcer. The Shibor has shot through the roof because there is a fall in trust regarding the creditworthiness of Chinese banks right now.

Some might well criticize China’s madness regarding the flirting with the Shibor. But is there a method in their madness? Will banks have to maintain credit availability and also keep sufficient deposits on hand in case there is a run on the banks. Up until now, the banks have been slowing down their availability of loans which is causing damage to the Chinese economy, resulting in a slow-down in economic activity. But, now that the message has been given loud and clear that the People’s Bank of China is not prepared (at least, not immediately) to give a helping hand if they go under, they will have to stand on their own two feet. Trouble is, it seems a bit of a blast from the fire-eating dragon.

See the original article >>

Follow Us