Wednesday, May 29, 2013

Consumer Confidence - Was It Really That Good?

by Lance Roberts

It is interesting to watch mainstream analysts, and journalists, grab for headlines to support the bullish rhetoric without actually doing some underlying research.  As we discussed in "5 Questions Every Market Bull Should Answer" the drive by the markets higher is not being driven by fundamental improvements but almost solely by the Federal Reserve interventions.  Of course, in the famous words of Jerry Seinfeld, "...not that there is nothing wrong with that" as long as you understand the inherent risks with trying to justify your position by grabbing at half-truths to provide "confirmation."

The release of the consumer confidence report yesterday speaks directly to the issue of "confirmation bias."   The following is the front page of USA Today for Wednesday, May 29, 2013.

USAToday-BullMarket-052913

The paper attributes the markets rise to the release of better than expected consumer confidence and housing reports.  However, if the journalist had taken just a few minutes to look at an intraday price chart of the S&P 500 index they would have seen that it was not the case.

SP500-Intraday-052913

As you can see in the chart above the market spiked at the open.  What drove that spike was the purchase of bonds by the Federal Reserve of $1.25-1.75 billion which injected liquidity into the markets.  The consumer confidence report was not released until 30-minutes later.

More importantly, while the markets did finish positive for the day, they actually finished 50% lower than its early morning peak.  This is hardly the sign of strength one should be looking for.  Had the economic reports been the driver for the rally - stocks should have finished higher than when the report was released.

Consumers - Sort Of Confident

The consumer confidence report was a good report nonetheless with it rising from 69 in April to 76.2 in May.  However, there are still some concerns with the report that should be addressed rather than just dismissed.

As has already been established, by USA Today and many others, consumer confidence has reached its highest level of the past 5-years.  Unfortunately, that level is still lower than where recessions are normally setting in.

Consumer-Confidence-052913

One of the more important components of the consumer confidence survey is the "expectations index" which speaks to consumers outlook.  While that component did improve in the most recent survey - it is still at levels lower than where they stood in 2011.  Coincidently, there is a very high correlation between the expectations index and the annual percentage change in economic activity.  As shown in the chart below economic activity also peaked in early 2011.

Consumer-Expectations-GDP-052913

One of the primary goals of the Federal Reserve, as noted by Bernanke in 2010, was to inflate asset prices in order to boost consumer confidence.  The theory is that by inflating asset prices consumers will feel more confident about their current situation and will boost economic growth by purchasing more goods and services.  The chart below shows that the Fed was indeed able to achieve stronger consumer confidence by inflating asset prices.

Consumer-Confidence-SP500-052913

The problem is that it is not translating into stronger personal consumption.  The chart below shows the improvement in consumer confidence as compared to the annual rate of change in real retail sales.

Consumer-Confidence-RetailSales-052913

So, while consumer confidence has indeed improved from the recessionary lows - it is has been weak when compared to historical recoveries.  This should not be a surprise when one considers the record number of indiviudals on food stamps and disability claims, quality employment remains elusive, businesses remain on the defensive and wage growth stagnant.

Another reason is that while the Fed focuses on inflating asset prices - the stock market "wealth effect" is primarily located at the top end of wage earners.  For the rest of "Main Street" there remains a disconnect between their personal financial situation and "Wall Street."

The next few months will be very important for a "revival" from the current "soft patch" in the economic data.  The question, however, remains sustainability.

With the Fed already talking about "tapering" their current program, interest rates on the rise and market risk at extremes there seems to be little more that the Fed can do currently.  The question is now whether the consumer is really ready to pick up the slack?  The problem is that I am not sure that they actually can.

See the original article >>

U.S. stocks retreat amid concern Fed will taper bond buying

By Inyoung Hwang

U.S. stocks fell, with the Dow Jones Industrial Average retreating from a record, amid concern that the Federal Reserve could begin to taper its debt-buying program as the economy continues to improve.

Eight out of 10 groups in the Standard & Poor’s 500 Index declined, as defensive sectors such as health-care, utility and consumer-staple stocks fell the most. Johnson & Johnson and Procter & Gamble Co. slumped more than 2.3%, pacing losses among the biggest U.S. companies. Lennar Corp. and PulteGroup Inc. fell at least 3.3% as investors sold shares of homebuilders.

The S&P 500 dropped 0.5% to 1,651.32 at 3:23 p.m. in New York. The Dow retreated 89.20 points, or 0.6%, to 15,320.19. Trading in S&P 500 companies was 4.7% lower than the 30-day average at this time of day.

“When yields do move higher, you’ll see some of those more defensive sectors take a hit,” Peter Jankovskis, who helps oversee $3.5 billion as co-chief investment officer of Lisle, Illinois-based Oakbrook Investments LLC, said by telephone. “The big question is how sustainable is the growth that we’re having now.”

U.S. equities retreated as much as 1.2% today after the yield on the country’s benchmark 10-year debt surged late yesterday to a 13-month high of 2.17% as a two-year sale drew the fewest bids since February 2011. Yields fell five basis points today to 2.12% as the government auctioned $35 billion of five-year notes at a lower-than-forecast yield.

Stimulus, Data

The S&P 500 dropped 1.1% last week as Fed Chairman Ben S. Bernanke said the central bank could reduce monetary stimulus if officials see signs of sustained improvement in growth. The index rose 0.6% yesterday and the Dow returned to a record after data showed consumer confidence climbed to the highest level since 2008 and house prices jumped the most in seven years, indicating growth in the world’s largest economy is picking up.

“We’ll have days when people are focusing on the positive economic story and days when people are focusing more on the issue that the Fed has in terms of slowing down their asset purchases and eventually moving interest rates,” Dan Curtin, the Boston-based global investment specialist at J.P. Morgan Private Bank, which oversees about $900 billion, said by telephone.

‘Significant Accommodation’

Equities pared losses today after Fed Bank of Boston President Eric Rosengren said “significant accommodation remains appropriate at this time.” Rosengren, who is a voter this year on monetary policy, also said it would make sense to consider a “modest” reduction in bond purchases after a few more months of improvement in the labor market and economy.

The Chicago Board Options Exchange Volatility Index, or VIX, rose 1.9% to 14.75. The equity volatility gauge, which moves in the opposite direction as the S&P 500 about 80% of the time, is down 18% for the year after jumping 12% last week.

Concern that slower Fed bond-buying will push Treasury yields higher prompted investors to sell shares of companies that have the highest dividend yields. Utility stocks fell 1.4% as a group, while telephone companies lost 1.3%. The two industries yield the most in the S&P 500.

While yield-seeking investors drove defensive stocks to among the biggest gains in the S&P 500 in the first quarter, they’ve been lagging other industries quarter-to-date, with utilities, phone companies and consumer-staple stocks the worst performers.

Utilities Slump

Utilities, which yield 4.1%, fell for the fifth straight day today, the longest losing streak of the year. Consolidated Edison Inc., the supplier of power to New York City, slumped 1.6% to $57.63.

Phone companies, which yield 4.4%, dropped for a third straight day. Verizon Communications Inc. lost 2.2% to $49.71 and AT&T Inc. retreated 0.5% to $35.99.

Consumer-staple stocks fell 1.8%. The group’s dividend yield is 2.8%. Procter & Gamble, the world’s largest maker of consumer products, slumped 2.4% to $78.94. Johnson & Johnson, the health-care products maker, slid 2.3% to $85.60.

McDonald’s Corp. retreated 2% to $99.25. The world’s largest restaurant chain’s global comparable sales were down 0.9% through April this year, according to Chief Executive Officer Don Thompson at an investor conference today. David Palmer, an analyst at UBS AG in New York, lowered his full-year profit forecast for McDonald’s because of a “modestly worse” European consumer environment and greater foreign currency headwinds.

Homebuilders Fall

The S&P Supercomposite Homebuilding Index tumbled 4% as all 11 companies in the gauge retreated. Lennar sank 4.5% to $40.33, and PulteGroup fell 3.3% to $22.03.

SLM Corp. rallied 2.1% to $23.47. The student lender known as Sallie Mae is seeking to separate its education loan management and consumer banking businesses into two publicly traded entities.

Smithfield Foods Inc. jumped 30% to $33.63 after Shuanghui International Holdings Ltd. agreed to acquire the pork processor for $4.72 billion. Shuanghui will pay $34 a share for Smithfield, a 31% premium over yesterday’s closing share price.

Tyson Foods Inc. also rose, increasing 2% to $25.35.

See the original article >>

Are We There Yet?

By Vitaliy Katsenelson

I started writing my first book, Active Value Investing: Making Money in Range-Bound Markets, in 2005; finished it in 2007; and published the second, an abridged version of the first (The Little Book of Sideways Markets), in 2010. In both books I made the case that there is a very high probability that we are in the midst of a secular sideways market – a market that goes up and down, with a lot of cyclical volatility, but ends up going nowhere for a long time.

Sideways markets happen not because stock market gods play an unkind joke on gullible humans but because of human emotions. Historically, sideways markets have always followed secular bull markets. At the end of secular bull markets stocks become very expensive – their valuations (P/Es) get very high. Sideways markets are just a payback for all the fun and returns stock investors received during secular bull markets.

In 1999, after 17 years of incredible returns, the mother of all secular bull markets ended at valuations we’d never seen before. For this reason, in my first book I argued that the present sideways market, which started then, might last longer than past ones. In the Little Book I want a step farther with the benefit of hindsight – it was written post-Great Recession. I argued that the economic growth rate going forward will be lower than it was in the past, and thus this sideways market may even last longer than I originally suspected.

Every so often I get an email from a reader with the question, “Are we there yet?” Are we still in the grip of a treacherous sideways market, or we are now entering into a secular bull market? I will try to answer that question as best I can in this writeup.

The Sideways View of The World

In early May I had the pleasure of attending and speaking at the Value Investing Congress in Las Vegas. The last time I spoke there it was May 2008 and the market was just coming off its top. (Here is a PDF of the ’08 presentation, and the new presentation is here.) The S&P was at 18x trailing earnings. Profit margins were at a modern-day high. They subsequently collapsed but came back to set an even higher high.

The market was not cheap in 2008. It is not cheap now, either.

Before I dive into my argument I need to introduce you to a very simple calculation that is at the core of my sideways argument:

E + Change in P/E + Dividends = Total Return

Stock price movements are driven by two variables: earnings growth and changes in the price-to-earnings ratio. Add dividends, and you have total stock returns.  The dividend yield of an average stock today is 2% – it is all yours to keep, so my discussion here will focus on the direction of “E” and “P/E.”

If you were to normalize profits for high margins and look at 10-year trailing earnings, in 2008 stocks were trading 66% above their historical average. They were at 30 times 10-year trailing earnings (see next chart).

In all honesty, I could make the same presentation today as I did five years ago (in fact I borrowed and updated a few slides from that presentation – see next chart). Market valuation is not dramatically different now from what it was then. A cyclical bear and a cyclical bull market later, the S&P 500 is still at the same 18 times trailing earnings and 26 times 10-year trailing P/E, or 41% above average. (It was 60% above average in 2008.)

(See footnote at end for a detailed explanation of the above chart.)

Investors who were on the sidelines over the last few years and who are now pouring money into stocks, expecting that we are in the midst of a secular bull market, will likely be disappointed.

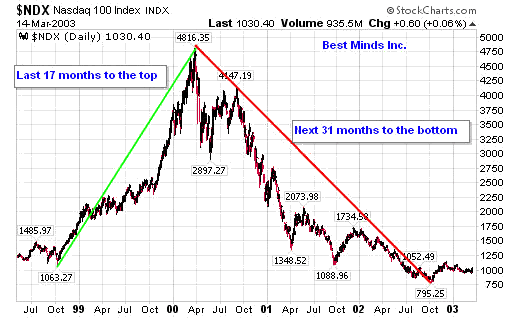
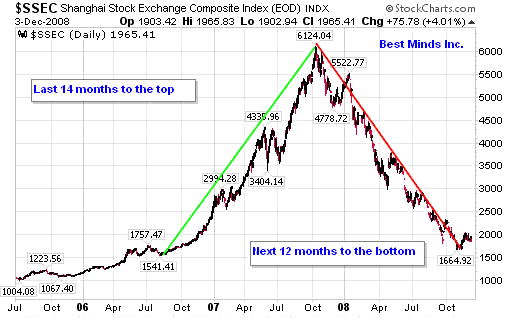
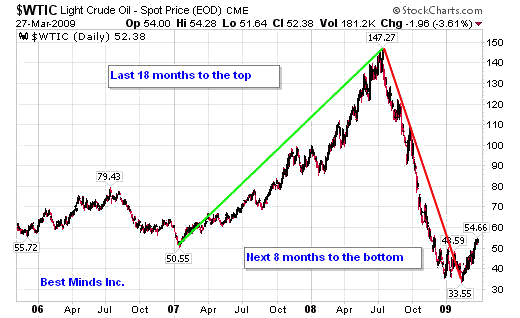
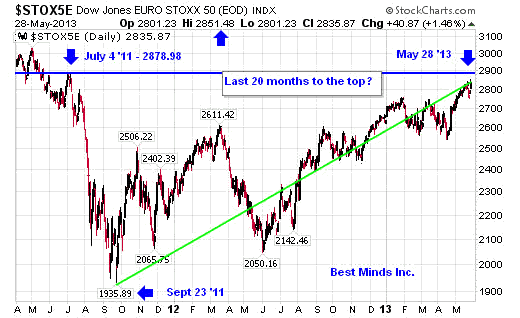
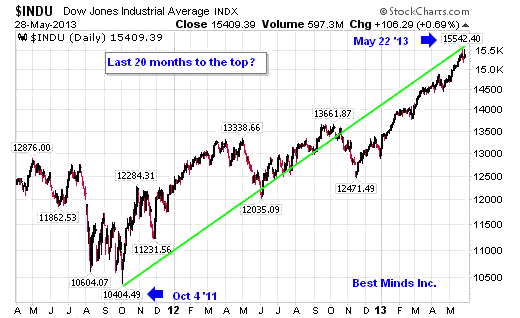
The previous sideways market of 1966-1982 had four cyclical bull markets and five cyclical bear markets packed inside it. From 1970 to 1973 the Dow went from 700 to 1,000, just to drop again, this time to 600. Four times, investors thought that a cyclical bull market had turned into a secular (long-term, 1982-1999 type of ) bull market, but their hopes were dashed as they discovered that these were just head fakes toward the next cyclical bear market (see next chart).

It is when nobody wants to own stocks ever again, when valuations are below their historical average, that a secular sideways market finally dies (actually more like goes into hibernation) and the next secular bull market is born.

But even that is not enough: stocks need to spend some time at below-average valuations. In the 1966-1982 secular sideways market, stocks spent half their time at below-average valuations. During the recent crisis we tiptoed into below-average valuations, but we danced right back out. Sideways markets are there to destroy hope and tarnish memories of the last secular bull market.

If you believe we are in the midst of a secular bull market, you have to be very comfortable with three things:

First, profit margins. Today, corporate profit margins are hitting all-time highs.

Historically, profit margins have been very mean-reverting – high margins were never sustained by corporations over a prolonged period of time because, as Jeremy Grantham puts it, “capitalism works.” When a company, Apple for example, starts earning very high margins, its competitors (like Samsung) come in and try to undercut it with lower prices. In response, Apple must lower its margins or dispense with a lot more features in its products.

If margins decline even as the economy grows, earnings growth will be very benign or negative. Suddenly, stocks that were seemingly cheap will not be cheap any longer.

Since we’re on the subject, let me dispel the myth that earnings can grow at a faster rate than the economy for prolonged period of time – they cannot and they have not. For this to happen profit margins would have to continuously expand, and as we have discussed above, they don’t.

But don’t just take my word for it. In the chart below I’ve plotted corporate earnings (yellow line) against GDP (red line) from 1957 to 2011. There were periods of time when earnings grew at a faster rate than GDP (profit margins expanded), and then they werealways followed by periods of time when earnings lagged GDP (profit margins contracted). But in the long run earnings growth equaled GDP growth. (This is a large and very important topic: I suggest you read this article.)

To be fair to the “earnings bulls,” earnings per share can outpace both earnings growth and GDP in the long run through share buybacks. When corporations repurchase their own shares the earnings pie is divided among fewer investors, and thus earnings per share will rise at a faster rate than net income. Share buybacks helped the S&P 500 to accelerated earnings per share growth by about 3% a year over the last two years.

Management can create enormous value for shareholders through smart capital allocation (share repurchases and issuance – and, at the right time, dividends and acquisitions). Henry Singleton at Teledyne created one of the most successful companies in the second half of the last century by being a very smart capital allocator.

Unfortunately, in general, corporations have not been good capital allocators; they’ve been buying their stock back high rather than buying (or issuing) it low. In the third quarter of 2007, S&P 500 companies spent $172 billion on buying their own stock – and of course that marked the highest point for the stock market. Fast-forward a few years, and in the first quarter of 2009, when market capitalization of the index declined almost by half, their own stocks should have been unbelievable bargains for companies, right? Yet stock purchases by S&P 500 companies dwindled by 80% from their highs to only $31 billion. (See S&P report and chart below.)

Unlike dividends, which when reduced or cancelled may end up costing management their jobs and are thus very sticky, corporate buybacks are announced and often not followed through on, or are followed through at the wrong time. Don’t count on buybacks to be a significant accelerator of earnings per share growth in the long run.

Second, the global economy. Even if you are comfortable with high profit margins, you have to make an assumption that economic (revenue) growth will be robust going forward; and given how many headwinds we are facing from every corner of the globe, that is far from a given:

Europe. Massive QE has temporarily papered over the Eurozone’s problems, but the structural issues that gave rise to the current crisis have not been resolved.

China is in the midst of residential and commercial real estate and infrastructure bubble that is further supersized by a pile of bad debt that will make our subprime crisis seem insignificant. I’ve written a lot about China (link) and given a lengthy presentation about it (link – also covers Japan). Also, problems in China will not stay in China; they’ll spill over to the ABCs (Australia, Brazil, Canada – I think I just coined a new acronym), which are some of the biggest beneficiaries of China’s insatiable demand for commodities.

A side note: Command-control economies like China’s offer certain advantages over messy democracies in the short run (and only in the short run!). For instance, they can pull even a large economy out of recession very fast by forcing banks to lend and corporations to spend; and since property rights are just a minor inconvenience, they can build fast, too. But in the long run, especially once you add corruption into the mix, you have massive misallocation of capital (hence ghost towns) and a banking system that will be crippled once the bubble does what bubbles always do: bursts.

Japan, the most indebted developed country in the world, with debt-to-GDP over 211%, has been stuck in deflation for two decades. Despite its indebtedness, it is paying less on its 10-year bonds (0.86%) than Norway (2.17%), which has debt-to-GDP of 28%. Japan also has one of oldest populations in the world, a population that was a net saver and thus a buyer (financier) of Japanese government debt. Japanese seniors and financial institutions (which hold the bulk of the debt) are about to turn into net spenders and will be selling bonds. Therefore the government will have to either shop its debt outside of Japan and suddenly compete with the Norways of the world for investor capital (and pay skyrocketing interest expenses that will quickly burst its debt bubble), or it will print a lot of money and its central bank will become a connoisseur of its fine debt. So far it has chosen the latter course. Either scenario sets in motion its own ugly chain of consequences.

The US. Oh, our dear US. We are living through one of the most grandiose and untested lab experiments ever conducted by a central bank: QE Infinity. QE 1, which was implemented during the financial crisis, was an attempt by the Fed to prevent a run on the banks. It was the right thing to do, and the Fed did a brilliant job executing it. However, with QEs that followed the Fed has turned our economy into a Lance Armstrong economy. We’ve consumed so many performance-enhancing drugs in the form of endless QEs that it is hard to know how well the economy is really doing. Just as we don’t know whether Lance would have won seven Tour de France titles if it were not for steroids, we don’t know how our economy will fare when QE is withdrawn. Unfortunately, our Lance Armstrong economy will at some point have its Oprah Winfrey moment, when it will have to fess up.

It is very easy to be negative about the global macro picture, and the saying comes to mind here that “You’re not paranoid if they really are after you.”

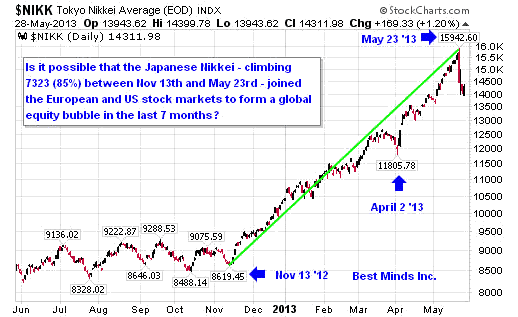
All the aforementioned problems are very complex in isolation, but the complexity of analysis increases exponentially once you start thinking about how problems in one region impact another. For instance, the monster QE in Japan, which will make Bernanke look like an amateur (it is relatively much larger than his) is driving the yen down, a lot. This will make Japanese goods cheaper and more competitive against those of the Chinese and Koreans, et al. Will this be the final straw that pricks the bubble of the Chinese economy? Will it lead to currency wars? In all honesty, nobody knows. The unknowns remain unknown.

In fact, the great Charlie Munger comes to mind. At the Berkshire Hathaway annual meeting this year he said, “If you are not confused about the economy, you don’t understand it very well.” I am sure this applies not just to the US but to the global economy as well. This is not a prediction of global demise, not at all; but if you are betting on high or even average global growth going forward, you’re putting your money on a very low-probability scenario.

And finally, P/E expansion. If you are comfortable with high profit margins and global growth, you have to believe that P/Es can expand higher from this level. I have news for you: in the past, sideways markets started (bull markets ended) when valuations were at current levels. Secular bull markets start at low P/E levels, because prolonged P/E expansion is like a rocket booster that helps the rocket to overcome the gravity of the earth and sends it into stratosphere. Prolonged P/E expansion converts stock market nonbelievers into believers.

P/E compression is a very likely outcome from where we are today, and therefore markets will do what they did over the last thirteen years, go sideways with lots of cyclical volatility and no returns. In case P/E stagnates – a much lower-probability outcome, the market will very mildly appreciate.

What about QE and low interest rates? Could they take P/E to a new high?

The interest rate environment today is quite different than it was in the ’70s and ’80s. Then, during the last sideways market, interest rates were much, much higher. Stocks may deserve higher valuations than they did then; however, higher valuations would likely prove to be a short-lived phenomenon, since the direction of interest rates matters as much as their absolute level.

The Fed’s unprecedented intervention in the economy has increased the possible range and severity of negative outcomes, from runaway inflation to deflation or a freaky combination of the two (freakflation).

If the Fed succeeds and real growth resumes, this good news will be negated by rising interest rates. I know that the last five years have lowered our economic growth standards, and we’ll be excited if the global economy returns to average (unsteroided, thus sustainable) growth. However, normal economic growth in a rising interest-rate environment would not justify valuations much above average.

If interest rates remain at the present low level for a long time, it will mean we have a different problem: deflation (or freakflation) is not good for stocks or their valuations. Just look at Japan: over the last twenty years, stock valuations declined despite interest rates being at incredibly low levels. Expensive stocks (as I’ve mentioned, stocks in general are very expensive) discount earnings growth. If growth fails to materialize, these P/Es will decline.

So if you believe the future will bring average or even above-average economic growth and that interest rates will remain at this historic level, then I will be proven wrong.

Knowing what we know today, earnings growth for the next five to ten years is unlikely to be exciting and may not even be positive, and price-to-earnings is likely to change for the worse, not the better.

So what?

As I write this, one line from Charles Prince, infamous CEO of Citigroup, is stuck in my head: “As long as the music is playing, you’ve got to get up and dance.” That was Prince’s explanation for why Citi continued to originate loans even though risks were starting to outweigh returns, and when it should have been obvious to an astute observer that the situation would not end well. We know how that story played out.

Today investors are dancing because Fed is QEing. Right or wrong, the thinking is that as long as the Fed is QEing, stocks will keep going up. Everyone feels they can get out before the music stops –we heard this before, in the late ’90s. Few got out. “Dancing” is not investing, it is speculating. One of the problems with QE is that the Fed is forcing people to buy riskier investments than they otherwise would have. The immorality of their actions aside, they create a significant psychological mismatch between assets and their holders. Stocks are in weak hands, insuring one great stampede for the chairs when the music stops.

Despite how it may sound, I am not issuing a market timing call. I have no idea when this market will turn; nobody does, and if they tell you they do they are liars. Market timing is a loser’s game. It is impossible to put market timing into a repeatable process, because on top of getting a plethora of global events right you have to time human emotions.

When the market is making all-time highs it is easy to become complacent, let down your guard, and let euphoric media headlines go to your head. A joke that Warren Buffett told a long time ago comes to mind here:

A very successful oilman dies. He faces Saint Peter, who says, “You’ve been a good man, and normally I’d send you to heaven, but heaven is full. We only have a place for you in hell.” The oilman asks, “Any chance I could talk to other oilmen who are in heaven? Maybe I can convince someone to switch places with me.” Saint Peter says, “It’s never happened before, but sure, I don’t see any harm in it.” The oilman goes to heaven, finds an oilmen convention, and yells, “They found a huge, cheap oil discovery in hell!” So oilmen are stampeding out of heaven straight to hell, and our oilman is running with them; he’s leading the pack. Saint Peter shouts to him, “Why are you going to hell with them? I have a spot here in heaven for you now!” The oilman shouts back, “Are you kidding, what if it’s true?”

The moral of the story: don’t drink your own Kool-Aid. Don’t pour money into stocks for the sake of being fully invested or to “participate” in the stock market, sacrificing on quality or valuations. Don’t dance, invest. Look at your portfolio and ask yourself a question: “If I didn’t know what the Dow is doing today, would I still want to own these stocks?” If after re-examining your portfolio you find that you own a lot of overvalued stocks, do the painful but correct thing – sell.

I promise you it will be a very painful decision, because those stocks will go higher … until they don’t. Cash is a four-letter word today because it earns nothing (thanks to the Fed) and because it drags down the returns of your portfolio in an appreciating market; but cash is king when no one else has enough of it and when investors who could not get enough of stocks are stampeding for the exits.

Footnote: Revisionist’s Earnings

The best way to normalize earnings for short-term profit-margin volatility is to compute 10-year trailing earnings for the S&P 500 and compare them to the average 10-year trailing P/E, which over the last 100-plus years was at about 18. This approach does a great job of normalizing earnings for profit-margin volatility, except when your look-back time period includes the recent Great Recession, when S&P 500 earnings collapsed from $85 to $7. You can argue that the $85 number in 2007 was inflated by exuberant earnings in financial stocks, and you’d be right, but it is also important to remember that in first quarter of 2009 AIG suffered the largest loss in corporate history, $61.7 billion. 2009 was not a great vintage year for Citi, Bank of America, and others, either.

Since the Great Recession distorts earnings power of the S&P 500, I decided to normalize it. I went back and revised history: I turned the mother of all recessions into a garden-variety one. I assumed that earnings had bottomed at $50 a share (see chart below) – a nice round number, a decline of 41% from their peak. (During the 2001 recession S&P 500 earnings declined from $53 to $25, a 54% decline.) Then I computed the “revised history” 10-year trailing “E”, and to my mild surprise, “E” went up only $4, from $61 to $65. In other words, the average stock was trading not at 26 times but at 25 times 10-year trailing earnings, and not at 41% above average valuations but only at 38%.

See the original article >>

Stock Market Bubble - Not So Sweet Sixteen

By: Doug_Wakefield

"In the spring of 1720, Isaac Newton stated, "I can calculate the motions of the heavenly bodies, but not the madness of people." On April 20, accordingly, he sold out his shares in the South Sea Company at a solid 100 percent profit of £7,000. Unhappily, a further impulse later seized him, an infection from the mania gripping the world that spring and summer. He reentered the market at the top for a larger amount and ended up losing £20,000. In the irrational habit of so many of us who experience disaster, he put it out of his mind and never, for the rest of his life, could he bear to hear the name South Sea." [Manias, Panics, and Crashes: A History of Financial Crises, Fourth Edition (2000), Charles P. Kindleberger, pg 31]

When we read the story above, do we think of bubbles we have lived through in the last 15 years? Have investors and advisors come to accept the fact that these bubbles have ended badly, and are always looking for the END of the most recent bubble?

Does the acceleration of prices bring out more comments of "get out", or "we have much higher to go"? Does the topic of risk become front and center the higher prices leap, or do our senses get dulled by the idea that "'they' have saved us from a serious decline repeatedly since 2009"?

The month of May 2013 is almost over. In the last few weeks, and especially the last 6 months, we have watched world markets produce numbers that resemble a gamblers addiction to hitting a lucky streak. With every "ALL TIME HIGH", less fear and more complacency seems to set in. Since we have been groomed to forget the pain, and focus on the gain, "ALL TIME HIGH" has been used like a drug to convince us that only fools don't want a part of these easy winnings. I mean, with the state guaranteeing to do whatever it takes to keep the party going, what could go wrong?

Yet, ALL investors, traders, managers, and advisors have lived through recent periods of massive losses. We do not have to return to the 1700s to find examples of how speculating on "unlimited" higher prices have ended.

NASDAQ 1999-2003 Chart

Shanghai Compsoite Index 2006-2008 Chart

Light Crude Oil 2006-2009 Chart

Now I ask you, what political or financial leader cannot understand that problems come from wild periods of short-term price speculation? Is there not a major financial network that cannot see the value of producing educational charts like these for their viewers? Would it not be of value for those training for professional advisory designations like the CFP and CFA to examine the history behind these bubbles and their subsequent collapse, thus warning their clients as risk rises along with price?

Clearly, the world of buy and hold did not work in these major bubbles.

It has been almost 20 months since US equity markets bottomed in October 2011. At the time, frightening headlines like these appeared frequently in our daily news:

BBC Does It Again: "In the Absence of a Credible Plan We Will Have a Global Financial Meltdown In Two or Three Weeks" - IMF Advisor, Zero Hedge, Oct 6, 2011

G20 Tells Eurozone to Fix Debt Crisis in Eight Days, China Daily, Oct 16, 2011

Europe has Six Weeks to Find Debt Crisis Solution, Warns Chancellor George Osborne, The Telegraph, Sept 23, 2011

Today, everyone knows that prices have change enormously since October 2011. Based on this fact, and the charts above, would we not expect that NOW would be a good time for our illustrious leaders, the financial industry, the mainstream financial media, etc, etc, to be issuing warnings about the increasing likelihood of another bubble or series of bubbles bursting in the global financial markets?

Bank of Japan Unleashes World's Biggest Burst of Stimulus in $1.4 Trillion Shock Therapy, Financial Post, April 4, 2013

Fed Chairman Ben Bernanke: Stimulus Programme not Creating 'Bubbles', The Guardian, May 22, 2013

And yet, to be fair to central bankers, there does seem to be some concern from those watching for signs of a bubble due to their "monetary easing" actions (otherwise known as debts pouring into the system from the global banks as the majority of speculators seek to leverage up on the belief that more high prices are in store, or at least a quick sell when the turn comes).

IMF Says Monetary Easing Could Drive Asset Bubble, Yahoo Finance, May 10, 2013

If you will return to the chart above of the NASDAQ 100, the Shanghai Stock Exchange Composite, and the West Texas Intermediate Crude, you will notice that the final run to the top lasted approximately a year and a half. Using a highly affordable charting service (less that what millions spend on their cell phones and cable), anyone could have been watching the creation of bubbles for months. Maybe central bankers should have spent a pittance of the trillions they have created since 2009 on a basic charting service?

Dow Jones Euro Stoxx 50 Chart

Dow Jones Chart

Tokyo Nikkei Average Chart

Can We Just Cross One More Thousand Marker

The last 8 years of writing The Investor's Mind has convinced me of how extremely hard it is to convince others that they are accepting deception. I say deception, because there has to be an element of accepting the deception in order to deny that we keep repeating the same mistakes over and over again. In order for us to believe that our world will never change, we must accept the lie that "if we can only reach the next thousand marker", somehow, that is a sign of even higher and higher prices. Yet, how many are accepting the other side of this story; higher prices lead to higher debt levels by which to speculate on higher prices.

If this sounds too dramatic - which frankly, I have found that anyone reading my writings has long ago accepted the fact that we were watching a constant creation of the next financial bubble for the public's deception of "recovery" - then consider the following thousand level markets this May.

  • The Russell 2,000 (RUT) broke above 1,000 on May 20th, two days later hitting 1,008. Today, May 28th, is only the 4th day on record above this level.

  • The Australian Composite (AORD) crossed 5,000 - a level it barely crossed before falling back through it in 2010 and 2011 - on April 23rd. 22 trading days later it broke back under this level.

  • The French CAC 40 (CAC) crossed 4,000 on May 17th. Its highest level since 2008 was 4169 in February 2011, and the last time it closed above 4,000 before May 17, 2013 was May 31, 2011.

  • The Dow (DJIA) crossed 15,000 on May 3rd, the 14,000 level being broken only 63 trading days earlier. As I write this article, the Dow's 15,542 on May 22, 2013 is its highest price on record.

  • The Nikkei (NIKK) crossed 14,000 on May 3rd, and 12 trading days came within inches of the 16,000 level (15,942) on May 23rd, before swinging down almost 2,000 points to bounce at 13,981 the next day, May 24th.

In 2000, I had bought into the idea that we were living through a paradigm shift, caused by the Internet and explosion of new technologies. By 2004, after attending one of the Ludwig Von Mises Institute's summer workshops, and cleaning the cobwebs of my own delusion that "debt does not matter", I began reading more and more history and trading commentary.

It is now 2013, and I am still amazed at what I can only call fear of being awaken. Through the use of powerful high frequency trading and short squeezes, direct manipulation of currencies, the soothing public rhetoric that you don't need to worry about this "complex financial world" since central bankers are on watch, and the public's almost subconscious belief that real world risk can be removed as long as you are not trading markets, and choose to ignore negative real world events, ... we have created the perfect "surprise" bursting of various global bubbles.

Will 16,000 on the Nikkei and Dow be reached? Is that really something any INVESTOR (not speculator/day trader/ high frequency trader) should even be focused on as a sign of their prosperity? Even if these levels are reached, hasn't the acceleration of world markets toward the next, "1000 marker" in May, and the 20 months since the October 2011 bottom already set up global equity markets for the bursting of the wildest speculative bubble we have seen yet?

Only time, and less and less of it seems to be required, will tell.

But one thing is for certain. If we don't understand that when the short term loans for speculation are called once again that the borrower will be slave to the demands of the lender, we have refused to learn lessons that span three millennium, not just three hundred years.

"The rich rules over the poor, and the borrower is the lenders slave", Proverbs 22: 7

The Gods of the Marketplace, Zero Hedge, 5/25/13

"Investors borrowed $384.4 billion in April, a 1.3% gain from the previous month and a 29% rise from the same month last year. This is an all-time record for margin debt and it exceeds the previous high mark set in June 2007....

...The Great Depression was caused, in large part, by massive leverage utilized in the equity markets..." [bold, the authors]

See the original article >>

Why the Market is Doomed

by Dave Skarica

I consider myself a total and utter contrarian. I think I have taken even more of a role as a contrarian and value investor in the past 4 years since the bottom of the financial crisis. I love what others hate.

It is important to see pessimism and embrace it. To as my mentor Sir John Templeton said "Buy at the point of maximum pessimism". This has saved us in the past year. I realize many of my subscribers are gold bulls and many did not follow me into my European trades of Hellenic Telecom (HLTOY) and Portugal Telecom (PT) last year, both of which are up. I also realize most didn't by my tech turn around plays of Sharp, Nokia and RIMM again all which are up. Most did not buy my solar turnaround plays LDK and STP again both of which are up. Or not to mention our Japanese trades which have also done well. These bailed out our falling gold stock trades.

However, I was much more comfortable trading these turnaround stories rather than chasing returns in the S and P 500.

I now think the American markets are in very dangerous territory. I know the call right now is thinking we have broken out and are in a new major bull market. That the market is not cheap trading at 17 times earnings, especially with zero interest rates.

However, what I want to see is real fundamentals follow this rally. We still have the labor participation rate at near 30-year low with stagnant wages and huge consumer debt. Nothing has change nothing is better. This is a bubble fueled on cheap money which is in turn inflating earnings.

Let me show you what I am talking about. Below is a chart of corporate profit margins. Note that they are now at all time highs at over 10 percent. The only times they have been even remotely this close were at the 2000 and 2007 top in stocks. Whenever margins have gotten this high they have never stayed this high.

What is helping is low rates. Just like the government large corporations with AAA and AA ratings can sell bonds at low rates. For example there were many examples of these companies selling 1-2 year short term bonds at 1-2 percent yields in past years. Where in the past they could sell at 5 to 7 percent. So that yield gap of 4-5 percent helps the bottom line. When rates turn up that is gone.

In addition, these low yields are causing people to chase yield. Below are charts of Wal-Mart, Johnson and Johnson and McDonalds and Verizon. Note how crazy they have all gone, straight to the upside. These stocks have yields higher than 10 year bonds, so investors in a desperate attempt are trying to lunge at those yields. What is interesting is it seems we have a bubble in these sorts of stocks rather than high growth stocks. We bought McDonald's at 54 dollars in 2009 and it is now over 100. Even with a 6 percent yield on our buying price, I am considering selling it as I think it is due for a 40 percent market tumble in the next bear market.

Click to View
Click for a larger image

Click to View
Click for a larger image

Click to View
Click for a larger image

Click to View
Click for a larger image

Sentiment

It has been a while since I talked about Investor's Intelligence. This is a poll of investment advisers and newsletter writers. Basically When things get interesting in this sentiment pool is when there is more than 2.5 times bulls to bears. Right now we are at 2.7 times. At our peaks in 2011 and 2010 we saw such readings as we did in 2007.

Another ratio I watch is the Rydex Ratio this is run by the rydex group of mutual funds. They also have a ratio of bull to bear funds. This shows how much assets are flowing into bullish instruments compared to bearish. Usually that ratio is about .40 or so meaning about 2.5 times amount of money is going into bull market instruments. When this ratio gets over .70 and especially over 1 to 1 it means investors are getting too bearish.

Right now the ratio is 0.26, meaning more than 3 times as much money is going into bull market funds. This is actually the lowest reading since 2000 when the market was making its monster bubble top.

Then we have the VIX the market volatility index . When the VIX is low it means investors are complacent, We have seen the VIX hovering in the 11 to 15 range for most of the past year. This reminds me of 2006-2007 when it does this right before the market topped then broke.

Click to View
Click for a larger image

Bloomberg also reported a recent poll of Bloomberg participants results are in the graphics below. As you again see the participants are bullish on Japan and the U.S. by a more than 2-to-1 margin and they are negative on gold by more than a 2-to-1 margin.

In addition, a few months ago David Stockman, Reagan's former budget adviser, came out with some very negative thoughts on the market. Stockman stated the following.

"We're in a monetary fantasyland," Stockman said.
Stockman, the author of "The Great Deformation: The Corruption of Capitalism in America," says the market will suffer a major downturn when the Fed, which is buying $85 billion worth of securities a month as part of quantitative easing, indicates it will stop printing money.
"The minute the Fed hints that it's going to normalize interest rates in some way, that trade will be unwound," Stockman said. "The fast money will sell the bond and then the slower money will sell the bond and then pretty soon, the mutual fund managers will panic.
"And where is the bid? Right now, the Fed is the bid. The Fed is propping up the price of the bond and the Fed is shoveling free money into Wall Street to speculate."
Stockman said the real growth rate of the economy for the past 13 years has been the lowest since the Civil War and median income of the average family is down 8% since 2000.
"What we have is massive fiscal stimulus; what we have is a Fed that creates serial bubbles," Stockman said. "All of this creates kind of the appearance of prosperity temporarily and then the day of reckoning comes, the bubbles break. Then we have disaster in its wake and then they come back and say let's do more of the same so that we can get out of the mess that we're in."   [see Fox video]

What I find interesting is that stockman was attacked in the press for speaking this, which I feel is basically the truth. It reminded me of when naysayers such as Roubini and Schiff were attacking the housing bubble saying it was going to blow up. They were attacked.

Finally, we have just the straight up action in the market. If you look at the last bull market the markets moved choppily up until mid 2006 then went straight up into mid 2007 for about a year. From the bottom of the correction in 2006 to the top in 2007 the S and P went up about 25 percent . This time it has been even more step from the correction in late 2012 to the present the market is up over 33 percent. In addition, it is up nearly 150 percent from the 2009 lows and nearly 60 percent from just the 2011 lows. This is way too hot .

In addition, if you really think the market is breaking out, let me show you otherwise. Enclosed is a chart of the S and P in the 1970s. Note that the S and P broke its 1966 high in 1970, 1974, and 1980 yet the secular bull market did not really start until 1982. The 1980 top was over nearly 50 percent higher than the 1966 high. Therefore, there is no reason the S and P can not rally to 1800, 1900 or even 2000 and still be in a long term secular bear market. Actually, the Dow is trading a lot like the S and P did in the seventies. Again no reason to think we won't go to 16000 or something. However, I think we are closer to the top of this rally than the bottom.

One thing that has helped the market is the internals, the advance/decline line has stayed very positive during the entire market upturn. We need to see some sort of weakness in the internals before we see the market roll over and die.

So what does this mean for gold? Very positive. What I like about gold is it is now trading opposite to the market, which is its traditional role. I think if the market trades down we can trade more like 2000-2002 or the seventies or 2007-mid 2008 and trade up as the market trades down. An interesting ETF too look at is FSG a leveraged ETF that shorts the S and P 500 and goes long gold.

I really think this bull market is doomed. It has been caused by cheap money and delusional thinking. They are just reflating old bubbles like consumer debt and housing. It is going to blow again. However, what is interesting is this time around gold and commodities are not participating in the rally. This could be a sign that they could go counter to the market, once it and probably the dollar blow.

See the original article >>

Coffee sellers pulling bids as prices fall

By Jack Scoville

COFFEE

General Comments: Futures were lower on speculative selling tied to ideas of big production coming from Brazil. Traders note that there are showers in the forecast but doubt there will be any big delay to the harvest or any loss of quality. Most sellers, including Brazil, withdrew offers after futures broke down on Wednesday and remain hard to get offers from so far this week. Or, they offer at higher differentials. Buyers are waiting for prices to drop even more, but need coffee and will buy if the differentials offered are good. Brazil weather is forecast to show some showers for this week, but no cold weather. Trends are down due to the expected large production in Brazil. It is speculators who keep pushing the futures lower as they anticipate ever increasing supplies. Current crop development is still good this year in Brazil, but it has been dry. Central America crops are mostly harvested and is too dry for good new crop flowering. Colombia is reported to have good conditions.

Overnight News: Certified stocks are near unchanged today and are about 2.755 million bags. The ICO composite price is now 120.37 ct/lb. Brazil should get showers. Temperatures will average near to above normal. Colombia should get scattered showers, and Central America and Mexico should get mostly dry conditions away from some showers in Eastern Mexico and northern Central America. Temperatures should average near to above normal.

Chart Trends: Trends in New York are down with objectives of 126.00 and 116.00 July. Support is at 125.00, 122.00, and 119.00 July, and resistance is at 133.00, 135.00, and 138.00 July. Trends in London are down with no objectives. Support is at 1910, 1890, and 1880 July, and resistance is at 1950, 1970, and 1980 July. Trends in Sao Paulo are down with no objectives. Support is at 156.00, 153.00, and 150.00 September, and resistance is at 161.50, 166.00, and 170.00 September.

COTTON

General Comments: Futures were lower again in July, but a little higher in the other months. The market has been trying to turn trends down, but bulls have been fighting to hold the market and send it higher again. US economic data has been improving, implying that demand might be so bad this year after all, especially with Cotton prices relatively low right now. The weather has improved in all areas with some precipitation in Texas areas and drier weather in the forecast for the next few days for the Delta and Southeast. Big rains are expected in the Delta and Southeast over the weekend, and some areas of the Delta got big rains last weekend to slow down the planting pace. Traders also were looking for new signs of demand, but are not finding much new. Ideas are that the demand can continue for now as China moves to increase its stocks. Planting conditions for the next crop remain a problem in the US. Dry weather is forecast for the Delta and Southeast, and warm weather is expected in Texas this week. Ideas are that farmers can get a lot of planting done with dry and warm conditions.

Overnight News: The Delta and Southeast will see dry conditions or afternoon showers. Temperatures will average near to above normal. Texas will get mostly dry weather, but showers are possible on Saturday. Temperatures will average mostly above normal. The USDA spot price is now 76.98 ct/lb. ICE said that certified Cotton stocks are now 0.509 million bales, from 0.509 million yesterday.

Chart Trends: Trends in Cotton are down with objectives of 80.90 July. Support is at 81.00, 80.10, and 79.00 July, with resistance of 82.90, 83.60, and 85.00 July.

FCOJ

General Comments: Futures closed higher on follow through buying from last week. The move came even though Neilsen reported less demand in the latest four week survey. Traders are wrestling with more reports of losses from greening disease on the one side and beneficial rains that have hit the state on the other. Greening disease and what it might mean to production prospects continues to be a primary support item and will be for several years. Irrigation is widespread, even with recent rains. Temperatures are warm in the state. The Valencia harvest is continuing. Brazil is seeing near to above normal temperatures and dry weather, but some showers are possible late this week.

Overnight News: Florida weather forecasts call for scattered afternoon showers through the weekend. Temperatures will average near to above normal this week and near normal this weekend.

Chart Trends: Trends in FCOJ are mixed to up with objectives of 160.00 and 177.00 July. Support is at 145.00, 144.00, and 139.00 July, with resistance at 150.00, 153.00, and 156.00 July.

SUGAR

General Comments: Futures closed slightly lower in consolidation trading. News of another big production period in the first half of May in Brazil was negative. Also negative was news that USDA is asking sellers of world Sugar to look for other places to sell besides the US due to big supplies here already. USDA might have to buy the surplus here and dump i ton the market, mostly to ethanol processors if possible. The price action overall was weak and implies that further losses are coming due to coming Brazil supplies. However, the market is trying top ut together a bottom for now as demand has surfaced and rain in Brazil has delayed the harvest. There were some reports of shipments getting booked ahead of the Ramadan holiday to give some demand to the market. Traders remain bearish on ideas of big supplies, especially from Brazil. Traders in Brazil expect big production as the weather is good. Demand is said to be strong from North Africa and the Middle East as buyers get stocks in hand for Ramadan in July. Chart patterns are weak.

Overnight News: Showers are expected in Brazil. Temperatures should average near to above normal. UNICA in Brazil said that the center south first half of May Sugar crush was 39.95 million tons, up 90% from last year. Sugar production was 2.06 million tons, twice as much as last year. Ethanol production was 1.6 billion liters, more tan doublé last year.

Chart Trends: Trends in New York are mixed to down with objectives of 1610 and 1600 July. Support is at 1650, 1620, and 1600 July, and resistance is at 1700, 1720, and 1740 July. Trends in London are mixed. Support is at 470.00, 467.00, and 464.00 August, and resistance is at 481.00, 487.00, and 491.00 August.

COCOA 

General Comments: Futures closed lower on good weather in Africa and weak demand ideas. The market is accelerating down and could son find a support área. Ideas are that processors are not active in the market right now and are hoping for lower prices before buying again. Soime processors have large stocks to work down as well as many bought early due to the new marketing program in Ivory Coast. The weather is good in West Africa, with more moderate temperaturas and some rains. Ideas are that production in West Africa could be less next crop year as well despite the improved weather as farmers have not liked offered prices. The mid crop harvest is moving to completion, and less than expected production along with smaller beans is reported. Malaysia and Indonesia crops appear to be in good condition and weather is called favorable.

Overnight News: Scattered showers are expected in West Africa. Temperatures will average near to above normal. Malaysia and Indonesia should see episodes of isolated showers. Temperatures should average near normal. Brazil will get mostly dry conditions and warm temperatures. ICE certified stocks are lower today at 5.011 million bags.

Chart Trends: Trends in New York are down with objectives of 2170 July. Support is at 2200, 2185, and 2170 July, with resistance at 2250, 2275, and 2285 July. Trends in London are down with objectives of 1500 and 1405 July. Support is at 1490, 1470, and 1440 July, with resistance at 1515, 1520, and 1535 July.

See the original article >>

These high flying yield plays are breaking support of these bearish patterns!

by Chris Kimble

CLICK ON CHART TO ENLARGE

These high flying yield plays formed bearish rising wedge, which two-thirds of the time suggest lower prices are ahead. Reit ETF (IYR) and Utilities ETF (XLU) are breaking down from these bearish patterns.

See the original article >>

Is Oil Cheap?

by Charles Hugh Smith

Gasoline is expensive at the pump, but by one measure oil is cheap, and poised to go higher.


I recently posed this question to longtime contributor Harun I.: could global hot money flow into the crude oil market, driving the price up even if demand declines? The basic idea here is that if equities, bond and housing markets soften or roll over (please see What If Stocks, Bonds and Housing All Go Down Together? May 24, 2013), global hot money will seek speculative gains elsewhere.

In an era of rising geopolitical tensions (see Syria), what better place to notch a speculative gain than oil and gold?

Put another way: Is oil cheap? Harun offered a chart of the crude oil/gold ratio (in effect, crude oil priced in gold rather than nominal U.S. dollars) and the following insightful commentary:

Very good question. I suggest we not make the error of just considering nominal price. For example, below is a chart I marked up about a week ago, the Crude Oil/Gold ratio. I like relative-strength charts because they are a better indication of high and low prices and they tend to oscillate within a range. Here we see a history going back to the 1970s.
At the highs and lows consider what this meant to the economy at that time. What I find rather interesting is that, currently the chart is indicating crude oil is relatively inexpensive. However, one trip to the pump says something entirely different. In fact, prices at the pump are not far off their peak from when this ratio was at its height.

Now imagine what would happen to prices if this ratio returns to its high. Remember this is relative, there could be a demand collapse and this ratio could still go to its historic high. What would that look like in the economy? Well much like the Great Depression, plenty of stuff but no money to buy it. Commodities are real and the effects of hot money are felt almost immediately causing demand to collapse quickly because the real people that make up the economy don't eat paper. If hot money flows into crude oil driving pump prices to $8.00/gallon it would devastate the economy even further.
The Fed is trapped. There were no good answers in 2000, 2008, or now. But the room has gotten a lot smaller.
The reflationary bubble in equities has acted as a hedge but it has not increased purchasing power. No wealth has been created for the middle class. This is why the Fed cannot lift off the accelerator. Therein lies the problem. How does the Fed square the divergence of the equity markets and its monetary stance? How can it continue to claim that they are not the cause of inflation or bubbles?
Where will money flow? It may foment mini-bubbles in all things tangible, classic cars, precious metals, art, etc., as the wealthy scramble to get out of cash. But there will be no place to hide. This will get messy, but the revealing of really big lies always is.
The chart above is cause for grave concern. The fact that it is indicating that energy prices are cheap and have no place to go but up is sounding an alarm. It is my opinion that the average person is in no place (in terms of purchasing power) to absorb a return to the relative highs on this chart.

Thank you, Harun, for the chart and the commentary. You see what happens when oil becomes expensive: the economy sinks into recession.

The conventional wisdom is that oil should decline in nominal price as global demand weakens along with the global economy.

In the hot-money-seeks-a-new-home scenario outlined above, demand could decline on the margins but speculative inflows--demand for oil contracts by speculators--push prices higher, potentially a lot higher in a geopolitical crisis.

The central banks that are creating all the "free money" that is available to large speculators fulminate against oil speculators, as if all the free money is only supposed to go to "approved" speculations in equities and bonds.

Unfortunately for the central bankers, they only create the money, they don't control what the financiers who get the free money do with it.

Despite the endless MSM hype about U.S. energy independence and U.S. exporting energy abroad, the U.S. still imports over 3 billion barrels of crude oil every year: U.S. Imports of Crude Oil (U.S. Energy Information Administration).

Demand for imported crude oil fell 4.9% from 2011 to 2012, tracking lower gasoline consumption and miles driven. But that's still a figurative drop in the bucket of oil imports. Anyone who believes the U.S. is impervious to geopolitical oil shocks is on a Fantasyland ride with an abrupt stop in terribly inconvenient reality.

See the original article >>

Has the commodities supercycle run its course?

By Paul Hodges

The commodities boom of the past decade is starting to look its age. Abundant liquidity and the perception that commodities could be a ‘store of value’ pushed prices to record levels in many markets. But today, investors are rightly becoming nervous about the likely fall-out, once the Federal Reserve starts to wind down its stimulus programs. Markets may therefore start to reconnect with the fundamentals of supply and demand. And this could provide an unpleasant shock for unprepared investors.

Oil markets provide a good example of what may be in store. As Chart 1 shows, there were just four years in 1900-2003 when oil traded above $30/bbl. These were during the 1979-82 Iran crisis when OPEC operated a fixed low production ceiling.

Even in real terms ($2012) oil has similarly been below this level for 78% of the period (23 years). Only since 2004 has the $30/bbl level become a floor rather than a ceiling, as policymakers:

  • Held interest rates below market levels in the run-up to the financial crisis of 2008, in an effort to support growth in housing and other markets
  • After 2008, initiated successive waves of stimulus and liquidity programmes in an effort to support growth in the wider economy, when the promised swift rebound failed to materialise

This period has clearly been unique in history. Yet investors and companies are now dangerously complacent about the risks they will face once central bank liquidity ceases to be the key market driver and prices begin to revert to historic levels:

  • Investors have ignored evidence of slow demand and low operating rates, and have instead come to assume that today’s unprecedentedly high levels have somehow become normal
  • Companies have come to assume that oil prices can never fall, and so have failed to develop the necessary scenario analysis to help them survive a period of potentially extreme turbulence

Yet inventory levels in the U.S. recently have been at 80-year highs, whilst supply is back at 20-year highs and increasing rapidly thanks to the application of fracking techniques to potential oil reserves. Equally, demand growth is slowing fast under the influence of today’s high prices. Even more critical for the medium term is that populations in many major economies are now aging. So demand growth is set to slow for decades to come, and even may go negative.

The reason is that aging populations represent a replacement economy. People in their 50s and older already have most of what they need. Equally, they can postpone purchases if money is tight. And with 10,000 Americans now retiring every day until 2030, many people’s spending power is set to reduce quite sharply as they start to depend on pension income for the basic necessities of life.

Chart 2 highlights the issue for the G-20 group of countries, who account for nearly 80% of global GDP. This shows each country in terms of GDP/capita and median population age, with the economy’s size depicted by the bubble.

Its membership comprises three quite distinct groups:

  • Rich but Old. These are wealthy western countries, whose median ages are already around 40 years
  • Poor but Young. These are poor emerging economies, with median ages of 25-30 years
  • Poor and Ageing. This group contains just China and Russia, whose median ages are also approaching 40 years

The Poor but Young countries are too poor with GDP/capita only around $10k to drive major growth in commodity demand on their own. Equally, China is most unlikely to maintain its historical economic growth because of the impact of its one child policy. This began back in 1978, and is now leading to increased labor shortages. And at the same time, the new leadership is already refocusing the economy away from high-value export demand toward low-cost domestic consumption.

Against this background, savvy investors will be relearning the techniques of supply/demand analysis that guided markets until 2003. Demographics drive demand, and so the aging of the Western and Chinese populations means the chances of a new commodities supercycle are reducing by the day.

See the original article >>

Random Length Lumber Is Not Random

by Greg Harmon

One commodity that not many people trade is random length Lumber ($LB_F). In fact yesterday there were a less than 300 contracts that trade hands in the futures market in total. Contrast that to 24,000 for Copper, 11,000 for Silver and 73,000 for Gold, just in the near month. But it has a story to tell and it is an important one. In October the commodity was on fire, breaking a 4 year ascending triangle higher. This pattern suggested that it could go as high as 500 or 56% higher. It did have a great run up to over 400 but has been pulling back since early March and just last week broke below a significant 4 year rising trend support line. The current week started lower still and it is now below the 100 week Simple

lumber

Moving Average (SMA). The commodity is set up now for even more downside. There is support lower at 265 and 230 followed by 197, 163 and 140. The 3-box reversal Point and Figure chart has a price objective at 176. But since nobody is trading it this does not really matter. What is important is that the price of lumber is going down and looks to continue. For an economy built to a significant extent on housing this is good news. Think about what it means for the housing sector and all the add-ons.

See the original article >>

Gold is Different. What Next?


Gold Is Different. David Evans. by BullionBaron

The European economic crisis has coincided with a decline in press freedom in the EU

By Jennifer Dunham and Zselyke Csaky

In the half decade since the beginning of the economic crisis, global press freedom has declined, and the EU has been no exception to this trend. Reporting on a new survey on press freedom, the authors find that Greece and Hungary have experienced large declines in press freedom in recent years, with Lithuania, Latvia and Spain also seeing falls. They write that the economic crisis has exacerbated deep-rooted problems across Europe’s media environments leading to a decline in print media circulation and diversity, as well as a greater concentration of media ownership.

Image source: UK National Commission for UNESCO

Each year in May, Freedom House, a Washington, D.C.–based institute that specializes in research on global democracy, issues a report on the condition of press freedom around the world. The most significant—and disturbing—finding of Freedom of the Press 2013: A Global Survey of Media Independence was that the proportion of the global population that enjoys a free press continued to decline in 2012, falling to less than one in six, its lowest level in over a decade. The press freedom score in the European Union (EU), traditionally one of the world’s best-performing regions, also fell victim to this negative trend, with a further drop in the regional average and declines in both the old member states and those that joined the bloc in 2004 or later.

The year 2012 featured a notable deterioration in Greece and more moderate declines in Spain and other nations. This comes on the heels of a steep decline in Hungary’s score in recent years, and ongoing problems in Italy, Latvia, and Lithuania. As governments and media sectors felt the impact of the economic crisis that began in 2008, the state-run and private media suffered staff and salary cuts, declines in advertising revenue, and even the closure of outlets. This in turn had the effect of exacerbating existing problems, such as declining print circulation, the concentration of media ownership, decreasing print media diversity, and expanding influence on content by political or business interests.

Figure One – Average Press Freedom Scores in the EU, 2008–12

Media Freedom Fig 1

Scores are on a scale of 0–100, with 0 as best and 100 as worst. Categories: Free (0-30), Partly Free (31-60), and Not Free (61-100).

Greece’s score decline was the largest in the region in 2012. It fell from 30 to 41 on the survey’s 100-point scale, triggering a change in the country’s press freedom status, from Free to Partly Free. (The third category in the three-tiered system is Not Free.) While Greek society as a whole suffered from economic and political turmoil, the Greek media endured widespread staff cutbacks and some closures of outlets. Journalists also faced heightened legal and physical harassment and pressure from owners or politicians to toe a certain editorial line. These factors damaged the media’s ability to perform their watchdog role and keep citizens adequately informed about election campaigns, austerity measures, corruption, and other critical issues.

In one prominent example, journalist Kostas Vaxevanis was arrested and charged with violation of privacy for publishing the so-called Lagarde List of prominent Greek citizens who had transferred funds to Swiss bank accounts, allegedly to avoid paying taxes in Greece. Although he was initially acquitted, he currently faces a retrial. Furthermore, there were cases of politically motivated firings and suspensions at both state and private media. Journalists were physically attacked while covering protests against government-imposed austerity measures, and targeted by the far-right Golden Dawn party.

The media environment in Spain has also suffered as a result of the economic crisis and a related series of austerity measures, with its score declining from 24 to 27 points in Freedom of the Press 2013—still in the Free range. Media diversity was affected as the advertising market contracted and a number of outlets closed, cut staff, or reduced salaries. Since 2008, 57 media outlets have closed, around one-sixth of the country’s journalists have lost their jobs, and those who remain receive only about half their precrisis salaries. Público, a left-leaning daily aimed at younger readers, stopped printing and switched to an online-only format in February 2012, leaving El País as the only major left-leaning newspaper in print. In addition, several journalists and staff at RTVE, the state-owned broadcaster, were removed after voicing criticism of the government’s controversial austerity policies. These developments raise significant concerns about political influence over content and a lack of diverse viewpoints in the mainstream media.

Latvia’s score has fallen to 28, three points shy of the Partly Free category. Declining advertising revenues since 2008 have caused media outlets’ budgets to shrink, resulting in tabloidization and the use of recycled content. Forced to search for new sources of income, some outlets have engaged in the questionable practice of “hidden advertising,” in which paid content is improperly disguised as news. While the country’s economic recovery has accelerated in the past two years, media ownership is becoming increasingly concentrated. Apart from economic problems, political interference in editorial policies has raised concerns, and the country is battling a growing trend of violence against journalists. The 2010 murder of newspaper owner Grigorijs Å…emcovs remains unsolved, and last year another journalist reporting on corruption and organized crime was badly beaten and shot at.

Figure Two – Largest Score Changes in the EU, 2008–12

Media Freedom Fig 2

Latvia’s Baltic neighbor, Lithuania, was also severely hit by the economic crisis, and its media sector suffered similar setbacks, though it is still ranked comfortably in the Free category. While the economy is currently performing well, Lithuania’s media and advertising sectors have not yet caught up. Media ownership has grown more concentrated over the last several years, and the industry’s recovery has been hampered by rising taxes on media outlets. Banks are barred by law from owning media, but many institutions work around those restrictions by maintaining media holdings through intermediaries, and newspapers controlled by financial institutions often demonstrate bias toward their owners. A number of politicians also have ownership stakes in media outlets.

Figure Three – Press Freedom Scores for Selected Countries, 2008–12

Media Freedom Fig 3

Italy did not suffer a decline in score for 2012, but it has been a regional outlier since 2008, when it fell into the Partly Free range due in large measure to the disproportionate influence of one man—then prime minister Silvio Berlusconi—over the country’s media. Berlusconi is a major private media owner, and his political position gave him control of the state-owned media as well, including influence over the appointment of directors and key journalists. While his resignation in November 2011 effectively decreased media concentration, Italy’s score did not improve significantly. It remained at 33 in 2012, with a Partly Free status, due in part to pressures from the economic crisis. Working conditions for journalists have become difficult in recent years; those with a full-time contract constitute only 19 percent of the workforce, and there is a significant pay gap between professional and freelance journalists. Those hoping to work full-time for one of the major outlets need a license from the journalists’ association, the Ordine dei Giornalisti, and obtaining one entails a lengthy and costly procedure. Other problems include the influence of political parties over nominations to the public broadcaster and the regulatory authority. This infamous phenomenon is called lottizzazione, or “dividing the spoils” between parties, and has long plagued Italian politics. Journalists also face physical threats or attacks from organized crime networks. In one case, investigative journalist Roberto Saviano has lived under 24-hour police protection since publishing the book Gomorrah, about the Neapolitan mafia, in 2006.

Hungary also avoided further score declines in 2012, but it fell precipitously over the previous three years—from a Free environment with a score of 21 in 2009 to Partly Free with a score of 36 in 2011. And as in Italy, the problems in Hungary cannot be attributed to economic factors alone. Press freedom has eroded in the legal and political areas under Prime Minister Viktor Orbán, who took office in 2010. His government adopted a new media law that provided for content restrictions and heavy fines; evidence emerged of a politically motivated licensing procedure that caused a critical radio station to lose its frequencies; and reports of censorship and self-censorship increased, especially at the public broadcasters. A series of rulings by the country’s Constitutional Court and legal amendments to meet objections from the European Commission have mitigated the impact of the government’s initiatives. For example, most of the content requirements in the media law have been removed, and a more balanced appointment procedure has been introduced for the head of the Media Authority. Moreover, the critical radio station, Klubradio, got back its frequency after an almost three-year court battle. Nevertheless, several problematic legal provisions remain in place. Media outlets (including online and print) still have to register with the Media Authority, for instance, and they can still receive large fines for violating human dignity or “discriminating against any nation.”

The relatively young democracies of the EU’s east and south have endured the worst press freedom setbacks in recent years, but even leaders of the democratic world like the United Kingdom are not without problems. The country’s libel laws heavily favor the plaintiff, resulting in significant “libel tourism,” though reforms enacted in 2013 appear to be a step in the right direction. Press freedom advocates are less satisfied with the conclusions of the November 2012 Leveson report, which suggested the adoption of statutory press regulations to solve the ethical crisis revealed by a scandal over illicit phone hacking by journalists. The use of superinjunctions also poses a threat to freedom of expression; these court-issued gag orders are an excessively powerful tool in the hands of those who can afford the legal expertise to secure them. Another issue that sets the United Kingdom apart from the best-performing European countries is the persistence of occasional attacks and threats against journalists, especially in Northern Ireland.

The economic crisis has shed light on, and often exacerbated, deep-rooted problems in the media environments of Europe. These include the cozy relationships between politicians and media owners, government hostility toward critical reporting, and violence against journalists in the course of their work. However, the EU still easily outperforms the world’s other regions, and the recent decline in press freedom has been recognized by European policymakers. As governments contemplate an appropriate response, journalists across Europe are already turning to new media as an outlet for their work. The proliferation of digital media—whether online versions of newspapers, purely web-based news organizations, internet broadcasters, or individual blogs—serves to counteract the contraction of the print sector and often frees journalists from the restrictions and conflicting interests of large public or commercial institutions. In addition to addressing the problems affecting the media offline, policymakers will need to ensure that the legal, political, and economic freedom of online journalism is adequately protected, so that it can evolve into a robust alternative to traditional sources of unbiased information and in-depth investigative reporting on the key issues facing the public.

See the original article >>

The Love Trade for Gold is Still On!

by Frank Holmes

Investors should have gained confidence from Ben Bernanke's recent testimony to Congress that the Federal Reserve intends on being accommodative as long as needed.

He had a laundry list of job market conditions that needed improving and reiterated that inflation remains low. It's his belief that "a premature tightening of monetary policy could lead interest rates to rise temporarily but would also carry a substantial risk of slowing or ending the economic recovery and causing inflation to fall further."

The Fed's news is "great for all of us in stocks... and not so great for those with cash in a savings account, with real negative returns for the past four years," reminded Money Map Press. Yet, at least in the short term, markets interpreted Bernanke's testimony differently, as stocks dropped during the week of May 20.

The news should also be good for gold investors.

Not only is the Fed maintaining its course, the world is also continuing its synchronized easing. According to Deutsche Bank, central banks representing almost 30 percent of global GDP are cutting rates.

The rate cuts are spread out over nearly every continent, as you can see on this great visual posted by Business Insider. Turkey's central bank cut its benchmark interest rate more than expected in April by 50 basis points and then another 50 basis points in May. Serbia also slashed rates by 50 basis points, as did Sri Lanka. Even the European central bank reduced its main rate to a record low 0.50 percent. According to Bloomberg, ECB President Mario Draghi is "promising to provide as much liquidity as eurozone banks need well into next year."

Gold

With this global easing cycle, gold and equities had been moving together, but have been taking vastly diverging paths in the past six months. In fact, the gold-to-S&P 500 Index ratio has fallen to lows not seen since 2008, according to UBS Investment Research. This extreme indicates that the precious metal may be looking more attractive. In addition, "gold's resilience in spite of very weak investor sentiment is encouraging, with recent price levels having acted as a good floor so far," says UBS.

Gold

As I often remind investors, gold buyers are a diverse group, but generally fall into one of two categories. Most of the attention gets focused on those who purchase out of fear of damaging government policies (i.e., the Fear Trade).

The more important demand for gold, in my opinion, comes from the enduring Love Trade, as countries like China and India buy the precious metal out of love and tradition.

Looking at a breakdown of gold demand from the World Gold Council (WGC) through March 31, 2013, the main source of weakness was the Fear Trade, as demand for gold ETFs and similar gold products plunged in the first quarter. However, the Love Trade scooped up jewelry and bars and coins, with the tonnage in each category growing 12 and 10 percent, respectively, on a year-over-year basis.

You can visually see the strength of the Love Trade below in the year-over-year change in total consumer demand in tons for gold jewelry, bars and coins. Indian demand grew the most, increasing 27 percent compared to the previous year. Demand for jewelry, bars and coins in the greater China area increased 20 percent, as "seasonal strength in China, related to Chinese New Year purchasing, exceeded all previous peaks, marking a new record quarterly high," says the WGC. Even U.S. residents had a love for gold, with demand growing 22 percent over the previous year.

Gold

The Love Trade doesn't look like it'll subside anytime soon. I recently discussed the record amount of coins purchased through the U.S. Mint and the buyers crowding stores in multiple Asian markets when gold tumbled in April. It appeared that gold was transferring from weak hands to the strong hands of the Love Trade.

As one example, on the Shanghai Gold Exchange, trading volume surged to a record 43.3 tons on one day in April, as buyers clamored to buy the metal at a great price.

Gold

Gold purchases are getting so strong these days, buyers are willing to pay a premium, says Mineweb. The mining publication reported that premiums on gold bars are climbing to all-time highs in Hong Kong and Singapore, with Chinese residents paying $5 to $6 an ounce over the spot London price due to classic economic one-two punch of huge demand and tight supply.

According to data from the Hong Kong Census and Statistics Department, "net gold flows from Hong Kong to China jumped to 223.519 tons in March from 97.106 tons in February, smashing a previous record of 114.372 tons in December," says Mineweb.

This is the Love Trade in action.

See the original article >>

Follow Us