Wednesday, July 27, 2011

China’s Inflation Muddle


Even as the debt crises in Europe and the United States loom large and the global economic recovery falters, inflation is making a comeback worldwide. Indeed, emerging-market economies are bracing for a serious bout of it – together with the dire political consequences that it will bring.

China’s headline consumer price index (CPI) jumped 6.4% year on year in June, reaching its highest level since July 2008. Against the background of a shaky global recovery, concerns have grown considerably over a possible hard landing for the Chinese economy, caused by monetary tightening aimed at controlling inflation.

In China, food prices account for about a third of the CPI basket, with the price of pork bearing a large weight. As a result, the CPI is jokingly called the “pork price index.” In June, pork prices rose 57% year on year, contributing nearly two percentage points to the overall inflation rate. Unfortunately, macroeconomic policy can do little about the “hog cycle” and usually should not respond to it.

While China’s inflation problem should not be exaggerated, complacency would be dangerous. Current inflation is more broad-based than it appears, regardless of the controversy surrounding the adequacy of China’s CPI basket in reflecting the reality of underlying price movements. In fact, annual increases in non-food prices accelerated to 3% in June, up from 2.9% in May. According to China’s National Bureau of Statistics (NBS), living expenses increased by 6.1% year on year in May. Many worry that non-food prices may rise higher.

Barring unexpected shocks, I believe that China’s inflation may peak soon. From a macroeconomic perspective, China’s current inflation is attributable both to demand-pull and cost-push factors.

Historically, inflation in China has followed GDP growth with a lag. Today’s inflationary pressures are partly the result of the lagged impact of the stimulus package that China adopted in 2009 to fight off the effects of the global financial crisis. But China’s GDP growth has already started to fall towards its potential level, which, according to the consensus view, is around 9%. In fact, most Chinese economists predicted last year that inflation would peak in early 2011.

Changes in China’s financial conditions reinforce this view. Historically, there is a lag of 8-12 months between M1 monetary growth and inflation. The growth rate of M1 started to fall in late 2009. If past experience is a reliable guide, a decline in inflation is already overdue.

The interference of cost-push factors contributed to the unexpected persistence of inflation. The rise in commodity prices since mid-2010 – China’s commodity price index has increased by more than 100% since its 2009 low – has had an important impact. Moreover, Chinese wages have been rising rapidly.

China’s current macroeconomic situation shares many similarities with the situation that it faced in 2007 and the best part of 2008, when, owing to strong investment and export demand, GDP growth surged significantly beyond its potential. Worried about worsening inflation and a budding real-estate bubble, the People’s Bank of China (PBC, the central bank) gradually tightened its monetary stance.

Yet inflation continued to worsen, peaking at 8.7% in February 2008. The most difficult period for Chinese decision-makers was between February and September 2008, when, despite abundant signs of a softening in domestic demand, overall demand remained strong, as did inflation.

To tighten or not to tighten: that was the question. The PBC continued to tighten. But the collapse of Lehman Brothers in September 2008 brought global economic growth to a screeching halt. China’s GDP growth fell dramatically, owing to the collapse of external demand. To offset the negative shock, the Chinese government enacted a four-trillion-renminbi stimulus package, and the PBC shifted its policy stance abruptly. There is no question about the necessity for the turnaround. However, with hindsight, one might ask whether an earlier loosening by the PBC would have been wiser.

With taming inflation its top priority, the PBC has raised banks’ mandatory reserve ratio six times this year. Commercial banks must deposit with the central bank 21.5% of deposits as reserves. Recently, the PBC raised the one-year lending rate and the one-year deposit to 6.56% and 3.5%, respectively.

Currently, China’s inflation is not as bad as it was in 2007-2008. The rise in house prices has begun to stabilize, and the impact of the rise in commodity prices is tapering off.

External demand in the second half of 2011 is unlikely to be strong, owing to the shaky global recovery. The steady increase in production costs, partly attributable to high borrowing costs, is squeezing enterprises’ profit margins of – small and medium-sized enterprises in particular. Declining profits and rising enterprise bankruptcies are posing challenges to China’s monetary authority.

In view of the need for structural adjustment, the PBC should maintain a tight monetary stance. But, with a coming decline in headline inflation and mounting concerns about growth, the PBC is likely to prove a bit more accommodating in the second half of 2011.

In short, although China will miss its inflation target of 4% for this year, price growth will remain under control. In the second half of 2011, China’s growth rate could fall further, but there will be no hard landing.

China’s economic problems are more structural than cyclical. Owing to a lack of distinct progress in restructuring and rebalancing the domestic economy, the next five years will be difficult, and the window of opportunity for adjustment will close rapidly. But, viewing China’s performance in the context of the past 30 years, there is no reason to believe that the country cannot muddle through once again.

Yu Yongding, currently President of the China Society of World Economics, is a former member of the monetary policy committee of the Peoples' Bank of China and former Director of the Chinese Academy of Sciences Institute of World Economics and Politics.
Read China’s Lips


The Chinese have long admired America’s economic dynamism. But they have lost confidence in America’s government and its dysfunctional economic stewardship. That message came through loud and clear in my recent travels to Beijing, Shanghai, Chongqing, and Hong Kong.

Coming so shortly on the heels of the subprime crisis, the debate over the debt ceiling and the budget deficit is the last straw. Senior Chinese officials are appalled at how the United States allows politics to trump financial stability. One high-ranking policymaker noted in mid-July, “This is truly shocking… We understand politics, but your government’s continued recklessness is astonishing.”

China is no innocent bystander in America’s race to the abyss. In the aftermath of the Asian financial crisis of the late 1990’s, China amassed some $3.2 trillion in foreign-exchange reserves in order to insulate its system from external shocks. Fully two-thirds of that total – around $2 trillion – is invested in dollar-based assets, largely US Treasuries and agency securities (i.e., Fannie Mae and Freddie Mac). As a result, China surpassed Japan in late 2008 as the largest foreign holder of US financial assets.

Not only did China feel secure in placing such a large bet on the once relatively riskless components of the world’s reserve currency, but its exchange-rate policy left it little choice. In order to maintain a tight relationship between the renminbi and the dollar, China had to recycle a disproportionate share of its foreign-exchange reserves into dollar-based assets.

Those days are over. China recognizes that it no longer makes sense to stay with its current growth strategy – one that relies heavily on a combination of exports and a massive buffer of dollar-denominated foreign-exchange reserves. Three key developments led the Chinese leadership to this conclusion:

First, the crisis and Great Recession of 2008-2009 were a wake-up call. While Chinese export industries remain highly competitive, there are understandable doubts about the post-crisis state of foreign demand for Chinese products. From the US to Europe to Japan – crisis-battered developed economies that collectively account for more than 40% of Chinese exports – end-market demand is likely to grow at a slower pace in the years ahead than it did during China’s export boom of the past 30 years. Long the most powerful driver of Chinese growth, there is now considerable downside to an export-led impetus.

Second, the costs of the insurance premium – the outsize, largely dollar-denominated reservoir of China’s foreign-exchange reserves – have been magnified by political risk. With US government debt repayment now in play, the very concept of dollar-based riskless assets is in doubt.

In recent years, Chinese Premier Wen Jiabao and President Hu Jintao have repeatedly expressed concerns about US fiscal policy and the safe-haven status of Treasuries. Like most Americans, China’s leaders believe that the US will ultimately dodge the bullet of an outright default. But that’s not the point. There is now great skepticism as to the substance of any “fix” – especially one that relies on smoke and mirrors to postpone meaningful fiscal adjustment.

All of this spells lasting damage to the credibility of Washington’s commitment to the “full faith and credit” of the US government. And that raises serious questions about the wisdom of China’s massive investments in dollar-denominated assets.

Finally, China’s leadership is mindful of the risks implied by its own macroeconomic imbalances – and of the role that its export-led growth and dollar-based foreign-exchange accumulation plays in perpetuating those imbalances. Moreover, the Chinese understand the political pressure that a growth-starved developed world is putting on its tight management of the renminbi’s exchange rate relative to the dollar – pressure that is strikingly reminiscent of a similar campaign directed at Japan in the mid-1980’s.

However, unlike Japan, China will not accede to calls for a sharp one-off revaluation of the renminbi. At the same time, it recognizes the need to address these geopolitical tensions. But China will do so by providing stimulus to internal demand, thereby weaning itself from relying on dollar-based assets.

With these considerations in mind, China has adopted a very transparent response. Its new 12th Five-Year Plan says it all – a pro-consumption shift in China’s economic structure that addresses head-on China’s unsustainable imbalances. By focusing on job creation in services, massive urbanization, and the broadening of its social safety net, there will be a big boost to labor income and consumer purchasing power. As a result, the consumption share of the Chinese economy could increase by at least five percentage points of GDP by 2015.

A consumer-led rebalancing addresses many of the tensions noted above. It moves economic growth away from a dangerous over reliance on external demand, while shifting support to untapped internal demand. In addition, it takes the heat off an undervalued currency as a prop to export growth, giving China considerable leeway to step up the pace of currency reforms.

But, by raising the consumption share of its GDP, China will also absorb much of its surplus saving. That could bring its current account into balance – or even into slight deficit – by 2015. That will sharply reduce the pace of foreign-exchange accumulation and cut into China’s open-ended demand for dollar-denominated assets.

So China, the largest foreign buyer of US government paper, will soon say, “enough.” Yet another vacuous budget deal, in conjunction with weaker-than-expected growth for the US economy for years to come, spells a protracted period of outsize government deficits. That raises the biggest question of all: lacking in Chinese demand for Treasuries, how will a savings-strapped US economy fund itself without suffering a sharp decline in the dollar and/or a major increase in real long-term interest rates?

The cavalier response heard from Washington insiders is that the Chinese wouldn’t dare spark such an endgame. After all, where else would they place their asset bets? Why would they risk losses in their massive portfolio of dollar-based assets?

China’s answers to those questions are clear: it is no longer willing to risk financial and economic stability on the basis of Washington’s hollow promises and tarnished economic stewardship. The Chinese are finally saying no. Read their lips.

Stephen S. Roach, a member of the faculty at Yale University, is Non-Executive Chairman of Morgan Stanley Asia and the author of The Next Asia.

The Crude Oil Enigma


Crude Oil ($CL_F) has been an enigma the past 3 months. Almost over night forecasts of West Texas Intermediate Crude Oil went from $200 per barrel back to $80 per barrel. The range has tightened a bit now but the direction is still eh source of heated debate. Let’s take a deep dive look and see if there are any clues in the charts.

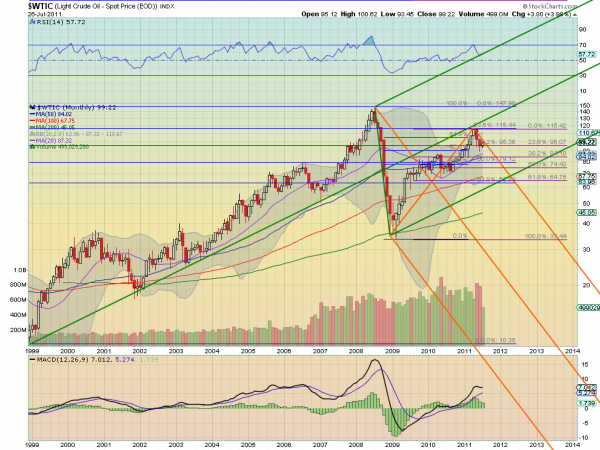
Crude Oil, $CL_F, Monthly Chart
oil m1 e1311729174411 stocks
The monthly chart above shows that Crude prices are bound within the Upper Median Line of the bearish orange Pitchfork, following it down, after bouncing lower off of the Median Line of the bullish green Pitchfork in April. It is also sitting on very tight Fibonacci levels at 96.07 as 23.6% retracement of the move from the 2009 low to the April high, and 95.36 as 38.2% of the move from the 2008 high to the 2009 low. Losing support of these Fibonacci levels would see support lower at 84.10 and then possible a walk down the orange Pitchfork to the green Pitchfork Lower Median Line. The Relative Strength Index (RSI) and the Moving Average Convergence Divergence (MACD) indicator are both supporting more downside on this time frame. If it can break above the orange Upper Median Line then it should be drawn back to the green Median Line and the 115.44 Fibonacci area.

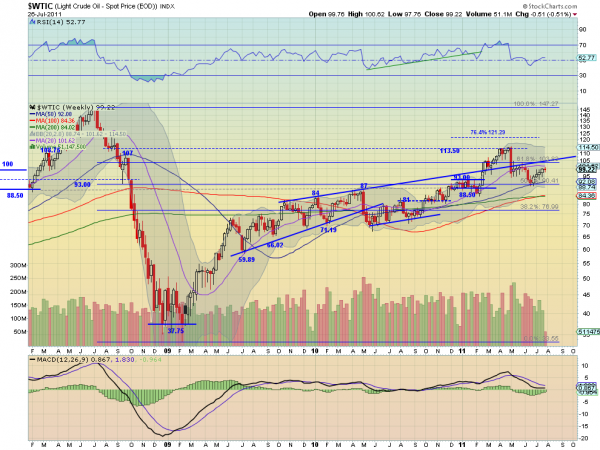
Crude Oil, $CL_F, Weekly Chart
oil w7 e1311729864567 stocks
The weekly chart shows a more bullish scenario in the short term. After bouncing off of the 50% retracement of the move from 2008 to 2009 at 90.41 it has been rising back towards the intersection of the 61.8% Fibonacci at 104 and the extension of the trendline resistance from October 2009 above the resistance at 100 from May. The RSI is rising and the MACD is improving support a run higher. If it can get through the 104 then it has resistance higher at 113.50. But rejection at 100 or 104 sees support lower at 93 followed by 90.40 and then 88.50.

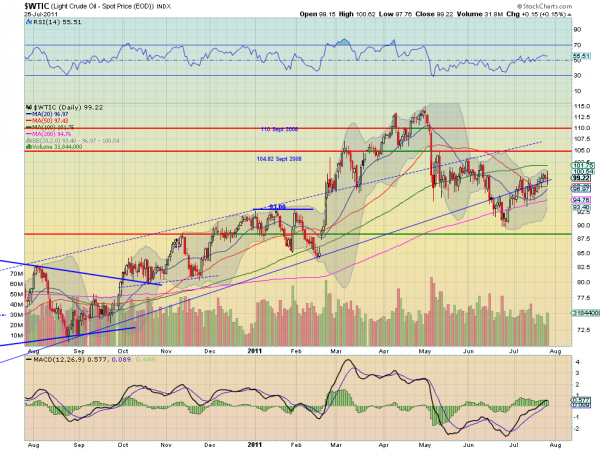
Crude Oil, $CL_F, Daily Chart
oil d3 e1311730220936 stocks
The daily chart is sporting a bullish flag but a long legged doji Tuesday. The RSI is falling over and the MACD is moving from level to slightly falling. Both supporting more downside but not authoritatively. The 20 day SMA is curling up towards a cross with the 50 day SMA as well. The resistance range between 98 and 100 is easily seen as is the support area between 95 and 98. Support lower is found at 93 and then 90 and resistance higher at 100 and then 104.82.

Summarizing, the monthly chart looks lower but is only a few dollars from changing that bias to the upside. The weekly chart looks better to the upside but with big resistance at 104 and the daily chart looks higher as well. Putting it all together gives the view of limited upside in the short term with a top at either 100 or 104, but a move above that making it a clean sweep to the upside. Failure at 104 is what the monthly chart suggests now.

Sugar rally falters as Brazilian output recovers

by Agrimoney.com

Sugar futures received a – temporary – knock after industry data revealed an improvement in Brazil's output, following a series of downbeat data.
Sugar production in Brazil's Center South region – the biggest producing area in the top producing country – reached 2.58m tonnes in the first half of July, Unica, the cane industry associations, said.
The figure represented an increase of 2.5% year on year, an improvement on the 1.3% pace of increase seen in the second half of June.
The growth was not enough to question expectations that Brazil is on course for its first decline in sugar production in a decade, in part because of a later start to the crushing season this year, but also a hangover from two years of underinvestment which have left the country with ageing cane.
However, it reduced the rate of decline in sugar output so far in 2011-12 to 11%, from a figure of 15% at the close of last month.
'Sugar prices to ease'
The immediate market reaction was to pull sugar futures into negative territory in New York, after an early run which had taken the October contract to 31.47 cents a pound, within an ace of a four-month high.
Indeed, the data acted as a rallying point for bears also banking on an easing in the queues of ships waiting to take on sugar in Brazil, which is also the world's largest sugar exporer.
"Guess now that the news of reduced crop estimates for Brazil have made the rounds, and the delays in loading sugar in the port at Santos are expected to ease, sugar prices will follow," Jurgens Bauer at PitGuru said.
However, futures recovered amid concerns that the disappointing Brazilian output represents a sign of strategic problems, rather than just those related to poor weather.
The underinvestment in cane, which now has an average age of more than four compared with an ideal of less than three, is seen as one major concern, another being the competition for suitable, and accessible, land for expanding productions.
"With the market trending higher, the bears need a 'story' sooner rather than later as Brazil news still seems to favour the bulls," Thomas Kujawa at Sucden Financial said.


High corn prices may put brakes on 'soy surge'

by Agrimoney.com

Corn may make a fightback in the battle of the acres against soybeans in South America, as high prices – which have risen above even Chicago levels – encourage farmers to rethink the "soy surge".
Soybeans have been on a winning streak in South America for decades, overtaking corn for sown area in Argentina in the 1980s and now accounting for five times as much land, driving the country to third place among exporters of the oilseeds.
In Brazil, the region's top grower of both crops, soybeans took the lead 14 years ago, and now take up roughly twice the area.
Brazil-based crop consultant Kory Melby said that this "soy surge", which has encompassed 1.9m hectares nationally over the last three years, was "related to cost of production and risk management strategies".
Soybeans vs corn and wheat
However, Mr Melby also noted that "corn prices domestically are very strong", trading at a premium to Chicago futures, with the Brazilian market lifted by a disappointing safrinha crop, besides srong international values.
Oil World, the analysis group, said that the "sharp" increase in prices was likely to spur extra sowings of the grain in southern and central areas, "as farmers are responding to the improved profitability of corn production".
Indeed, in South America as a whole "further growth of soybean plantings in 2011-12 will be threatened by increased competition from corn and wheat", the group said.
China factor
In Argentina, sowings faced a longer-term impetus too, assuming talks with Beijing over opening corn exports to China bear fruit.
"It is expected that Argentina will benefit considerably from rising Chinese corn import requirements in the years ahead," Oil World said.
"This is likely to improve the attractiveness of corn growing and thus implies increased acreage competition for soybeans in Argentina."
Fight for dirt
The prospect of an intense so-called "battle for acres" between the grain and the oilseed echoes that witnessed in North America earlier in the year – a fight won by corn, despite a poor early spring seeding period.
US corn sowings are currently estimated up 4.1m acres year on year to their second-highest since World War II, in part at the expense of soybean, whose plantings are believed to have dropped by 2.2m acres.

Cattle futures defy weight of data to pare losses

by Agrimoney.com

Has a matter of size trumped a numbers question?
Cattle futures staged a surprise rebound on Monday despite a barrage of apparently bearish data showing a bigger US herd than had been expected – with the revival attributed by some to potentially smaller animals.
Both feeder and live cattle opened weak in Chicago, running to traders' script after a key US Department of Agriculture report showed the US herd - while dropping this month by 1.1% to 100.0m head, its lowest on record - had not fallen as far as analysts had expected.
The market had forecast a decline of some 315,000-head more, to 99.7m animals.
The number of cattle in feedlots was especially strong, a separate report showed, lifted by placements which rose 4.0% last month – in contrast to the slide of 6.6% that traders had expected.
"The ongoing drought in the south west appears to have forced more cattle off the range" and into feedlots, Jon Michalscheck at Benson Quinn Commodities said.
'Somewhat bearish'
The feedlot data were deemed especially bearish for nearer-term contracts, implying a jump late in the year in supplies of live cattle - fattened animals ready for slaughter.
"This ought to affect the October, December timespan," Mike Mawdsley at Market 1 said.
The inventory report echoed the dynamic in showing a calf crop of 35.5m animals, some 350,000 head higher than analyst estimates, implying a near-term boost to cattle numbers, but a beef cow herd which fell well short of expectations, indicating a diminished breeding herd ahead.
"In the short-term, the report could be construed as somewhat bearish for cattle prices," a report from Paragon Economics and Steiner Consulting said.
"The much larger [than expected] calf crop is bearish in the short term."
Heat stress
However, after a weak start, and poor sentiment in crop markets, both near and far-term futures in both live cattle and feeder cattle recovered most of their lost ground, to bring some lots back into positive territory in late deals.
"It is a little bit surprising. Futures could not stick it to the downside," Don Roose, president of broker US Commodities, said.
He attributed the resilience in part to prices in the cash market, which traded at $108 a hundredweight last week. "We do not know how this is going to do this week," Mr Roose said.
Furthermore, there was some evidence that weights may be coming down, limiting the impact of higher animal numbers in raising beef supplies.
Besides the impact of high corn prices in reducing feedlots' appetite for fattening cattle to the limit, Mr Roose noted a side effect of the heatwave in southern states home to one-third of the US herd.
"We spoke to one feedlot owner earlier who was wary of putting large cattle because of the risk in high temperatures.
"When you are moving a 1,400-1,500 pound steer in 105-degree [Fahrenheit] heat, that's going pretty stressful for the animal."


See the original article >>

Bulls, Bears & PiiGs

By Barry Ritholtz
Bulls, Bears & PiiGs

No Guidance Is Better Than Bad Guidance

by Bespoke Investment Group

When a company releases quarterly earnings figures, any guidance that is issued is analyzed just as closely as the EPS and revenue numbers. But companies aren't required to issue guidance, and it's interesting to track the percentage of companies that do so each earnings season. We can think of two obvious reasons why a company wouldn't issue guidance -- 1) if there is simply too much uncertainty about the business environment and 2) if expectations are poor and the company wants to wait it out to see if it can turn things around before its next release.

Below we highlight the percentage of companies that have issued no guidance on a quarterly basis since 2002. As shown, when the market was in bull market mode during the mid-2000s, a lot of times less than 50% of companies would issue no guidance. When the financial crisis began in late 2007, the percentage began to steadily increase each quarter until it peaked in the same quarter that the market bottomed in Q1 '09. As the current bull market has progressed, more and more companies have begun to issue guidance, but this earnings season we have seen a huge spike in companies that haven't issued any guidance once again. Since earnings season began on July 11th, 412 companies have released numbers, and 65.8% of them haven't issued any guidance. This is actually .2% above the peak reading of 65.6% seen at the depths of the financial crisis. For those looking for proof that uncertainty abounds in the business world right now, there you have it.


Gold Is For Investors - Miners Are For Traders

by Steven Hansen

With gold continuing to flirt with all time highs, investors have been bombarded with gold touts - buy gold, buy coins, buy, buy, buy. When an investment heats up - it is time to exit.

Gold, however is not a hot investment - just a tortoise.

Follow up:


In the above graphic: gold price is NYSE:GLD, silver price is NYSE:SLV, gold miners is NYSE:GDX, and the S&P is NYSE:SPY.

My colleague Doug Short, in a graphical analysis, concluded that gold, while not cheap, did not appear to be in a bubble. If you look at the rapid increase of silver - this is a warning sign of a bubble. Gold has been moving up slowly. Although gold is not immune from corrections - it outperformed most asset classes during the financial collapse of 2008.

In Friday's Casey's Daily Dispatch, gold miner's were touted:

Remember, gold stocks have already demonstrated some serious leverage to gold in this bull market. From the 2001 bottom through the end of 2007, gold producers as a group rose about 1,200% (as measured by the Amex Gold Bugs Index), while gold was up about 230% in the same time frame. They outperformed the metal by five to one. Historically for the producers, the ratio is closer to three to one. Either way, my bet is that at some point, those days will return.
And maybe we’re nearing that time now.

Unfortunately, this statement is not true. While there at times has been considerable leverage, over an extended period shown on the above graphic - miners have underperformed gold. Why?

The leverage between miners and gold decreases the higher gold climbs.


The above graphic needs a little interpretation - it is showing the percent increase in the value of investments in gold and miners for each $100 increase in the value of gold.

The blue line shows the percent increase over the previous gold value for each $100 increase in the price of gold. The red line shows the theoretical increase in gross profits for miners for every $100 increase in the price of gold IF the production costs were fixed at $600. Finally, the green line is the averaged ACTUAL increase in miners stock values (expressed as the change in the price of GDX).

The reason for the variance between the red line (theoretical profits of miners) and the green line (stock value of miners) is that production costs are not constant (and are currently higher than $600). As the price of gold improves, miners are able to open previously marginal areas. In other words, the higher gold goes - the higher gold production costs go.

There are several first class professional miners out there - run by state of the art business techniques. However, as a group - these guys are cowboys who never saw the inside of a business 101 classroom. In other words, their business models will only used as examples of what not to do.

As a generalization, miner's historically make terrible investment but are great for traders because of the volatility. Gold, on the other hand makes a good cornerstone in your investment portfolio.

See the original article >>

Are We Headed for Great Recession 2.0?

by Guest Authors Caroline Corbett and Lance Roberts

Is a second recession in so short of a time in the offing? It certainly seems that way. The hope for a continued recovery has grown dim lately as many of the economic indexes are moving towards contractionary territory.
As we posted recently in “EOC Index Shows Economic Weakness” there are several concerns pressing the US economy and, in the words of David Rosenberg, chief economist at Gluskin Sheff, “one small shock” could send us into a second recession. With the recent release of the Chicago Fed National Activity Index, our proprietary economic index is just one small step away from crossing the 35 mark which has always been a pre-cursor to recession.
We have discussed many times recently that the unemployment rate remains high, housing prices are slipping into a secondary decline, consumer and business spending is slowing, while gas and food prices remain high, eating up more than 20% of consumers wages and salaries. Add on top of these factors the likelihood of a Greek debt default, a slowdown in the Eurozone, a weaker dollar and Washington locked in debate over the debt ceiling — well, the list of risks far outweigh the positives. It doesn’t take an economist to figure out that any one of these factors could send us tumbling into a second recession.However, that doesn’t seem to deter Wall Street economists and main stream media, who all seem to be wearing rose colored glasses these days.
Most of the mainstream media and economists claim this is simply a soft patch of the recovery. David Rosenberg refuted this claim in an interview with Bloomberg Television saying, “[it's] not normal to have two soft patches this close together nearly two years after the recession ends. It doesn’t happen. This will be two separate recessions.” He also stated in the interview that he believes that there is a 99% chance of another U.S. recession and the only reason he didn’t put it at 100% was that he needed a “margin of error”. He noted in his most recent issue of “Breakfast with Dave” that real disposable income, household employment, real business sales, and manufacturing production all peaked in March. This type of behavior was not characteristic of the soft patch last year, and this is the first sign of a looming recession. More importantly, remember that the recovery to date in the economy has not been an organic one. With more than $5 Trillion injected into the system through various Federal interventions and stimulus, it is disappointing that we only increased GDP by a little more than $900 Billion in the last two years. That is expensive growth any way you price it and is unsustainable without further injections.

However, not to be daunted by facts and figures, a recent CNNMoney survey of 18 leading experts shows that they believe there is about a 15% chance of a new recession. Of course, this is pretty much the same group of individuals who told everyone that the economic slow down in early 2008 was just a “soft patch” as well.

The risks, however, are real. According to Bernard Baumohl of the Economic Outlook Group, “the fragile US recovery means the economy is much more vulnerable to geopolitical shocks and a rise in fuel prices. Since the instability in the Middle East is far from over, there are real risks for the U. S. and international economy.” Dr. Gary Shilling, author of The Age Of Deleveraging, also notes the threat to the economy of another drop in housing prices. There is currently an excess inventory of 2 to 2.5 million homes with only 500,000 homes being absorbed out of that inventory per year. This means that it will take at least 4 to 5 years to clear that inventory if rates stay the same. If home prices drop another 20% in order to clear the market, it will force price declines on existing homes that will move the number of underwater mortgages from the current level of one in five to more than one in three. Shilling argues that the ripple effect will drive the economy into a second recession.

Robert Samuelson, in an article for the Washington Post, compares the current state of the economy to the climate of the economy during the “depression within a depression” from 1937-1938. During this recession, the unemployment rate rose to 20%, the economy’s output fell 18%, and industrial production dropped 32%. The climate leading to this recession is very similar to the economy today. Then, as now, commodity prices were rising rapidly and inflation fears were growing. Federal budget was criticized as too large and the president was perceived as anti-business. Similar complaints exist today. However, there are some significant differences between then and now. Policy reversal in 1937-1938 was much more drastic than anything being considered today. The federal deficit fell from 5.5% to .1% of GDP between 1936 and 1938. Today’s budget deficits are much larger as a share of GDP and prospective reductions are much smaller. Still, the parallels are unsettling.

Finally, statistically speaking, the data suggest the definite possibility of a second recession. Mark Thoma recently analyzed a graph of real GDP growth in an article for economitor.com. The graph shows a downward growth heading to below 2% GDP growth. This 2% line has been indicative of a recession in the past. Almost every drop below this line has led to a recession measuring back to 1947. The Fed, however, is hoping for a turnaround in the third quarter that could prevent us from hitting this line. Thoma believes the government needs to start taking action in order for this to happen. “Policymakers need to realize that unemployment, not the deficit, is the immediate crisis to be addressed and take action. Unfortunately for the unemployed, that’s unlikely to happen,” he stated in the article.

We agree with Thoma that unless some initiatives are taken we will hit that 2% mark very soon and head into our second recession.

Of course, all of this is barring another round of Quantitative Easing by the Fed. However, even that may not be enough to offset the real problems facing the U.S. economy.

The American Employment Dream

by Guest Author John Mauldin

I wrote about a year ago about how difficult it was going to be to really bring unemployment down. Rather than go back and replay that piece, I am going to pass on a note that my friend Barry Habib sent me today, which is quite sobering, and then add my thoughts. Quoting:
“A healthy employment market is the key to a strong economy. The housing market, along with many other important sectors of our economy, is highly dependent on people feeling confident in their ability to find work. But with the rate of unemployment above 9% and the economy sputtering to recover, everyone is asking how and when will the employment situation improve? This economic lynchpin is a very hot topic, which is also a critical element of many political, economic proposals. But while promising or estimating a decline in the unemployment rate may sound good, when the actual numbers are looked at more closely, realistically, and held to the light of historical performance, the forecasted declines may be far more difficult to achieve.
“For almost 40 years, the average rate of unemployment was below 6%. But the latest recession has pushed the rate far above what had been considered “normal”. So will we get back to the “normal” levels we have been accustomed to? I don’t see that happening for at least a long while. Let’s look at some data.
“There are about 311 Million people in the US. Our natural population growth rate, which compares births to deaths, is 0.6% per year. Our overall growth rate, which adds in migration, is 0.9% per year. There is currently a little less than half of the total population in the workforce, or about 153 Million people. So a 10% rate of unemployment would amount to about 15.3 million people wanting to find work. These factors create the need for job creations that will keep pace with the growing workforce so that the rate of unemployment can at least remain stable. How many jobs need to be created to absorb the growing workforce? About 115,000 per month. This calculation takes the current work force and overall growth rate into account. Therefore, the US must create 115,000 jobs each month just to keep pace!
“These numbers also tell us that if we want to reduce the rate of unemployment by 1%, there must be about 1.53 million jobs created. But remember that our population is also growing. That means young men and women are entering the workforce every day. And the positive migration causes more people seeking employment. During the last decade, there have been two stock market tumbles and a housing crash. This has adversely changed many previous plans to retire, and causing individuals to remain in the workforce longer than they may have originally planned. And if we want to see a reduction in the unemployment rate, we will need to see job creations over and above 115,000 per month. Therefore, targeting or projecting a 1% decline in the rate of unemployment requires 1.53 million jobs created plus 115,000 jobs per month for as long as it takes to achieve the target.
“In order to calculate this correctly, we need to factor in the time frame that this target is being projected over. For example, if the target is one year, then the 1.53 million jobs would be divided by 12 months, or about 125,000 per month. We then add this to the 115,000 needed to keep pace, which brings the total to a lofty 240,000 jobs per month for 12 months average. If the target is for a drop in unemployment by 2% in three years, the total jobs needed to be created are 3.06 Million, divided by 36 months – or about 85,000 jobs per month, plus the 115,000 needed to keep pace with population growth. This means we would have to add and average of 200,000 jobs per month for 3 years. And when we start to look at historical performance, we begin to see just how hard it is to accomplish this.
“For the record, I understand that demographics from 50 years ago are different, as well as different circumstances and moving targets. It’s true we can’t create an exact duplicate set of conditions. And I also understand that as the population grows, the 115,000 jobs needed each month will compound over time. That said, I am keeping it a bit simple so we can illustrate the concept.
“I went back 50-years on the BLS site and found some very interesting data. The best year for job gains was 1978, when the US added an average of 356,000 per month. Best decade was the 1990’s, with 181,000 average monthly gains During the past 50-years the average gains per month were only 124,000. The worst decade was the 2000’s, which actually saw monthly job losses that averaged 10,000 per month.
“We often hear projections on reaching a lower level of unemployment within a certain time frame. Let’s look at a chart to see how many jobs it would take to reduce the current 9.2% rate to a lower level over some different periods of time.

“The colors on the chart help us see how likely this scenario may be. For example, the numbers in the red boxes indicate that this has never been done before during the time frame desired. Green boxes indicate that this is close to a historical average. Blue boxes are an optimistic, but achievable goal. Grey boxes have numbers that have been reached in the past, but very rarely. The yellow box indicates that this has happened only once before – and that is over 50 years of data…meaning a very slim 2% chance.
“We often hear of a return to a 6% unemployment rate. Well if the goal is to do this in 4 years, then the US would need to create just under 250,000 jobs per month on average during this period. There are 47 rolling 4 year periods during the past 50 years. For example 1961 – 1964 is one. Then 1962 – 1965 is the next, and so on. During this time, a level above 250,000 jobs per month average for a 4 year rolling period only happened three times. There were a few more times when the numbers were close, but the chance of this happening was less than 10%. If history is a guide, the promises and projections we have been hearing, will have a very low probability of becoming a reality.
“History tells us that bringing unemployment down to 8% over 4 years is just about 50/50. This is very worrisome. And back to our earlier example of bringing the rate down 2% in 3 years – The 200,000 monthly job gains needed during a 3 year period of time has about a one in three chance of happening, according to the historic data.
“Let’s look at the total needed to get to 7% unemployment in 5 years, or about 171,000 jobs per month average. There are 46 rolling 5 year periods during the past 50 years. There were 17 times where the creations were above the number needed to reach the goal. That is just a little better than a one in three chance. Not very good odds, and worse – this is what many projections are based upon.
“Job creations need to be the central focus of our leaders. Small Businesses create so many of these jobs and should be given the tools to help them do this.”
OK, John here. The times Barry talks about, of large job creation, were during periods of either high innovation or significant home and infrastructure building and increasing leverage. That is just not in the cards now. It requires an economy rocking and rolling north of 4% GDP growth. We are barely at 2%. In May, total state payrolls (the data came out today) were down 64,000; in June they were up 65,200, averaging out to +1,200 for the two months combined.

We keep hearing about what the government should do to create jobs. And the reality is that it can do precious little. Private businesses create jobs, and nearly all net new jobs for the last two decades have come from start-up businesses. What government can do is create an environment that encourages new businesses, get rid of red tape (especially in biotech, where the FDA is mired in the 1980s!), stop creating even more rules that make it costly for new businesses to hire, and so on. I could go on, but the fact is, we are in for a rather long period of higher-than-comfortable unemployment. And that means lower tax revenues and a more difficult economy.

Employment is a key element in the American Dream. What we find ourselves in is more like a nightmare.

Cotton channel update ...

by Kimble Charting Solutions


Currency and Copper breakout ...

by Kimble Charting Solutions


See the original article >>

US Economy: Countdown To Default?


One line of reasoning from the “no tax hikes” crowd in the debt ceiling debate is the inaccurate premise that the very wealthy, the top 0.1%, are job creators. If they’re the “job creators,” it might be in the public interest to protect them from excessive taxation - thereby allowing these top 0.1% to spend money on creating jobs--This is incorrect.

The overwhelming majority of U.S. jobs are ‘created’ by ordinary Americans when they spend their paychecks. Consumer spending drives about 70% of our GDP. When average Americans are struggling with high unemployment, which recently popped back up to 9.2%, they are reluctant to spend money on anything beyond basic necessities. The broader U6 unemployment number - which includes the underemployed and “discouraged workers” - is 16.2%.

Meanwhile, U.S. companies are not stepping up hiring due to weakness in the economy - there is no demand. As Paul Ashworth of Capital Economics wrote, “Businesses aren’t confident enough, and the longer this goes on, the harder it is to convince them that they should be.”

Let Them Eat Cake

The Republicans are standing firm against raising taxes, in an era when many American corporations are already paying surprising little in taxes.
Russ Winter of Winter Watch at the Wall Street Examiner discussed the gap between what people think corporations pay in taxes, versus what they really spend. For example, Microsoft “lowers its effective tax rate a full 7% by taking foreign income to $19.2 billion from $15.4 billion, and lowering US income (and expenses) from $9.6 billion to $8.9 billion. Today MSFT is effectively a 68% foreign operation. In return it gets all the benefits of stimulus and minimizes the costs of supporting the US system...
“One of the big economic winners, Apple Computer, is even worse, hardly paying a thin dime to a U.S. Gumnut tottering towards insolvency. Here is the big picture of this foreign company getting U.S. benefits going back a few years [chart by Capital IQ]
.
Little wonder so much largesse flows into the hands of so few. Bloomberg’s Jesse Drucker estimated that Google all by itself has saved $3.1 billion in taxes in the past three years by shifting its profits overseas. If the U.S. is looking for a source to close its out of control deficits I have some suggestions...
“When one hears talk of tax reform, and closing tax loopholes, prepare to duck and cover if you are an ordinary American. Taxes collected for CY 2011 for the corporation year to date were $131.5 billion, versus $167.2 billion for the same period in CY 2010, down nearly 17% YoY. Little wonder there are so many earnings beats from the corporate sector...
“Mark Kreiger writes a spot on piece regarding the high end luxury bubble that includes this gem - ‘The social crisis facing the country as a result of the most egregious plundering in modern American history will spell the end of the ‘high end’ theme. Buying into this trend now is like getting long Marie Antoinette’s unsevered head in 1792.’”
Meanwhile, compouding the issues of the bleak labor market, and coporation tax loopholes, the impasse between the President and the Republican leadership reached new lows last week when talks broke down and Rep.

Boehner walked out of negotiations. “The White House deal for the House would have required that alongside these cuts, tax revenues would go up by $1.2 trillion, largely through a rewrite of the tax code to eliminate many deductions and loopholes". That’s substantially less in revenue than the $2 trillion in the “Gang of Six” plan.

The problem is that while much of the cutting would start right away, most of the revenue increases would be put off, in part because a tax-code revision would take months, and in part to allow House Republicans to say they did not agree to any specific tax revenue increases (i.e. they planned on lying to their constituents).

Democratic lawmakers were furious when they heard about these details, calling the plan wholly unbalanced. Bush tax cuts expire as scheduled next year. That's another $400 billion ($40Bn a year!) which the White House wanted to raise by ending tax loopholes and deductions.

“So, on the eve of economic calamity, the Republicans killed an overly generous deal largely over a paltry $40 billion in annual deductions". President Obama was willing to take considerable heat from his liberal critics over the deal, and the Republicans were not willing to do a thing to anger their Tea Party base."

Jefferson County Alabama Hires Bankruptcy Firm; Record Municipal Bankruptcy Coming; Death Spiral Swaps and JPMorgan Fraud Revisited

by About Mike Shedlock

At long last, and in what will be the largest municipal bankruptcy in history, Jefferson County Alabama is poised to file bankruptcy, but only after county officials attempted to stick it to taxpayers one last time.

Please consider Alabama’s Jefferson County Hires Bankruptcy Lawyer Kenneth Klee and Firm
Jefferson County, Alabama, which may vote in two days to file a record U.S. municipal bankruptcy, hired attorneys who represented Orange County, California, when it sought protection from creditors in 1994.

County commissioners voted 5-0 today to retain Kenneth Klee and his Los Angeles firm Klee, Tuchin, Bogdanoff & Stern LLP. The commissioners have scheduled a July 28 meeting in which they may decide to seek bankruptcy protection, extend negotiations with creditors on restructuring more than $3 billion of sewer bonds or approve a settlement.

Creditors including JPMorgan Chase & Co. (JPM) and bond insurer Syncora Guarantee Inc. haven’t responded to a county proposal to reduce its debt obligation to about $2 billion, while raising sewer rates by 8 percent for the next three years, commissioners said. The county will likely enter bankruptcy if creditors don’t respond this week, they said.

“My constituents are saying pull the trigger,” Commissioner Sandra Little Brown said at a meeting.

The county, home to Birmingham and more than 658,000 residents, has been under fiscal stress for more than three years after a sewer-bond refinancing collapsed during the credit crisis. Its woes intensified when the Legislature refused to act after a court struck down a local occupational tax in March. The tax generated about a quarter of Jefferson’s general-fund revenue, and losing it forced officials to put more than 500 employees on unpaid leave.

Previously, debt holders and companies that insure the bonds proposed refinancing as much as $2.4 billion and raising sewer fees more than 25 percent for at least three years.

Commissioners have said they will reject any proposal that requires them to raise sewer revenue by 10 percent or more.
Death Spiral Swaps

This sad saga should have ended three years ago. It has been so long ago now that most have probably forgotten about the fraud involving JPMorgan that is at the center of the saga.

Flashback April 12, 2008: Jefferson County Death Spiral Swaps
The Largest U.S. Municipal Bankruptcy Looms in Alabama. What caused this mess is an interest rate swap Jefferson County officials entered into when they financed a $3.2 billion sewer cleanup. For weeks county officials claimed they would work things out, but that is increasingly unlikely.
Fraud Involving JP Morgan

Flashback May 23, 2008: Fraud, Antitrust Investigation Involving JPMorgan, Jefferson County
Jefferson County Alabama is back in the news with a Fraud probe involving JPMorgan.

On May 22 Bloomberg reported JPMorgan Swap Deals Spur Probe as Default Stalks Alabama County.
Like homeowners who took out mortgages they couldn't afford and didn't understand, Jefferson County officials rejected fixed- rate debt and borrowed instead at rates that varied with the market.

The county paid banks $120 million in fees -- six times the prevailing rate -- for $5.8 billion in interest-rate swaps. That was supposed to protect the county from rising rates for their bonds. Lending rates went the wrong way, putting the county $277 million deeper into debt.

Bankers who worked for New York-based Bear Stearns Cos. and JPMorgan when Jefferson County bought its swaps have been told they might face criminal charges under an antitrust investigation of the municipal derivatives industry, according to records filed with the Financial Industry Regulatory Authority Inc.

On April 30, the SEC sued Larry Langford, the former county commission president and now Birmingham's mayor, for fraud in allegedly accepting $156,000 from a local banker while refinancing the sewer debt.

JPMorgan, Bank of America, Bear Stearns, and Lehman Brothers Holdings Inc. charged Jefferson County about $50 million above prevailing prices for 11 of the interest-rate swaps the county bought between 2001 and 2004. None of the fees were disclosed to the commissioners, records show.

Porter, White & Co., the Birmingham-based financial advisory firm later hired by the county to analyze its swaps, said the banks raked in as much as $100 million in excessive fees on all 17 of its swaps.

At least four JPMorgan bankers who worked for the bank at the time Jefferson County deals were done, including Douglas MacFaddin, the former head of municipal derivative sales, have been told by the U.S. Attorney's office that they could face criminal charges, records show. MacFaddin, who was fired in March, couldn't be reached for comment.
Clear Case Of Fraud

I am not an attorney but the facts presented suggest there is a clear case of fraud. Jefferson County should walk away from those deals and/or sue JPMorgan for fraud and antitrust violations.

JPMorgan for its part would be smart to absolve Jefferson County of those deals because there is no way for it to win. Even if JPMorgan won a lawsuit vs. Jefferson County, the county could simply declare bankruptcy.
County Officials Stick it to Taxpayers

Jefferson County should have declared bankruptcy three years ago.

Instead they opted to stick it to taxpayers with a 10% fee hike. Moreover, they passed a local occupational tax that thankfully the courts struck down.

It is amazing what lengths politicians are willing to go to blatantly screw taxpayers even in clear cases of fraud.

Striking Similarities to Greece

Parallels to Greece are striking. Greece should have defaulted 3 years ago. Via preposterous can-kicking exercises, all of which screwed taxpayers, EU officials prolonged the taxpayer agony as well as increased the total pain.

Greece defaulted anyway.

Now, unless Jefferson Country officials and JPMorgan come up with an agreement to screw taxpayers once again, this sad saga is finally headed where it should have been three years ago - bankruptcy court.

How many JP Morgan bankers were convicted in criminal court of fraud?

How many tens-of-millions of dollars of taxpayer money did Jefferson County waste in these last three years?

I do not have the answer to that but I can answer this pertinent question: "How many JPmorgan bankers were convicted in criminal court of fraud?"

The answer is none.

Straight from a SEC press release, please consider J.P. Morgan Settles SEC Charges in Jefferson County, Ala. Illegal Payments Scheme
Washington, D.C., Nov. 4, 2009 — The Securities and Exchange Commission today charged J.P. Morgan Securities Inc. and two of its former managing directors for their roles in an unlawful payment scheme that enabled them to win business involving municipal bond offerings and swap agreement transactions with Jefferson County, Ala. This is the SEC's second enforcement action arising from Jefferson County's bond offerings and swap transactions.

J.P. Morgan Securities settled the SEC's charges and will pay a penalty of $25 million, make a payment of $50 million to Jefferson County, and forfeit more than $647 million in claimed termination fees.

The SEC alleges that J.P. Morgan Securities and former managing directors Charles LeCroy and Douglas MacFaddin made more than $8 million in undisclosed payments to close friends of certain Jefferson County commissioners. The friends owned or worked at local broker-dealer firms that performed no known services on the transactions. In connection with the payments, the county commissioners voted to select J.P. Morgan Securities as managing underwriter of the bond offerings and its affiliated bank as swap provider for the transactions.

J.P. Morgan Securities did not disclose any of the payments or conflicts of interest in the swap confirmation agreements or bond offering documents, yet passed on the cost of the unlawful payments by charging the county higher interest rates on the swap transactions.

"The transactions were complex but the scheme was simple. Senior J.P. Morgan bankers made unlawful payments to win business and earn fees," said Robert Khuzami, Director of the SEC's Division of Enforcement.

Glenn S. Gordon, Associate Director of the SEC's Miami Regional Office, added, "This self-serving strategy of paying hefty secret fees to local firms with ties to county commissioners assured J.P. Morgan Securities the largest municipal auction rate securities and swap agreement transactions in its history."

According to the SEC's complaint filed against LeCroy and McFaddin in U.S. District Court for the Northern District of Alabama, the two former managing directors demonstrated in taped telephone conversations that they knew the payments to local firms with ties to county commissioners were designed to obtain business for J.P. Morgan's broker-dealer and affiliated bank. LeCroy and MacFaddin referred to the payments as "payoffs," "giving away free money," and "the price of doing business."

J.P. Morgan Securities agreed to settle the SEC's charges without admitting or denying the allegations by paying $50 million to the county for the purpose of assisting displaced county employees, residents and sewer rate payers; forfeiting more than $647 million in termination fees it claims the county owes under the swap transactions; and paying a $25 million penalty that will be placed in a Fair Fund to compensate harmed investors and the county in the municipal bond offerings and the swap transactions.
And so here we are, where we should have been three years ago, minus the fraud convictions, minus the fact these entire deals should have never have transpired in the first place, and minus the fact these deals should have been immediately negated in entirety once the fraud was exposed.

On Broken vol, skew and implications on the Markets


As we pointed out earlier this year, volatility is broken. Due to different effects by the QE programs, volatility, and especially VIX, has behaved rather “strange” since the beginning of the QE programs. Many frustrated vol traders have experienced this effect during the last year, and will continue experiencing it until everybody is dragged into believing there is minimal risk in the system. The skew has on the other hand traded somewhat differently, but it is not only an effect of “pro traders” buying protection, but we won’t go into those discussion here.

Instead are presented some charts on the skew (actually the skew in relations to VIX) and SPX index, courtesey of Macro Story. Are we up for some big drop in the Markets, or do we still need the last desperate Alpha chaser to join the bull run? One thing is for sure, not many, even of the experienced vol traders community, understand what is going on in the vol complex, and therefore we expect the unexpected to happen during the autumn.

For further reading on broken volatility and this year’s best vol report, artemis volreport.

Uranium Shortage Can’t Be Ignored


The world faces a long-term uranium shortage as China and India build new nuclear plants, and major buying opportunities may emerge for shares of some beaten-down uranium producers.

Uranium prices have seen the largest drop in two years following the Japanese nuclear disaster and Germany’s decision to phase out its nuclear plants, both of which hit uranium prices hard. This has hammered the stocks of the leading uranium producers, but the longer-term fundamental and technical outlook suggests a major buying opportunity may lie ahead.

Germany depends on nuclear power for 23% of its needs, and with Japan considering cutting back on its nuclear expansion plans, the entire industry has been in retreat. Though Japan is the third-largest nuclear power producer after the US and France, it’s important to take a much more global look at the prospects for nuclear power.
chart
Click to Enlarge

Currently, production does not meet the demand of the industry, and the projections for production versus demand indicate that this gap will continue to widen going into 2020. The chart above is from the World Nuclear Association, a group that promotes nuclear energy, and therefore has a vested interest. The potential gap between supply and potential demand, however, is consistent with the views of other experts.

The recent announcement from China regarding plans to boost nuclear capacity to eight times the current level by 2020 was followed by India’s plans to boost nuclear power production by thirteen times by 2030. The nuclear power industry is also flourishing in South Korea, which could add as many as ten plants by 2010.
Though there are no clear signs yet that uranium stocks have bottomed, they are approaching long-term support where a bottom is likely to be completed.
chart
Click to Enlarge

Chart Analysis: Cameco Corp. (CCJ) is by far the dominant player in the field, as this $15 billion company is involved in all facets of finding and processing uranium, as well as in the sale of nuclear electricity. CCJ traded as high as $44.81 in February, but hit a low of $25.13 in late June.
  • The weekly uptrend (line b) is currently at $21.75 with additional long-term support, line a, in the $20.85 area
  • The recent rally looks like a rebound within the downtrend, suggesting a test, if not a break, of the recent lows is possible before a bottom could be formed
  • The weekly relative performance, or RS analysis, has improved but does not yet suggest a bottom is in place. A move in the RS above the May highs would be a positive sign
  • There are similar readings from the weekly on-balance volume (OBV), as it is still below its declining weighted moving average (WMA). The daily OBV (not shown) is positive but does not yet show formations consistent with a significant low
  • There is initial resistance for CCJ at $31.25 and then the weekly gap at $32.87 to $36.80.
Uranerz Energy Corp. (URZ) is a much smaller, $233 million company that reports earnings on August 8. It had a high of $5.93 in February before dropping to a low of $2.52 in May.
  • The $2.52 level corresponds to long-term support going back to 2009, line d, as well as the weekly uptrend, line e. There is additional support at $2.24 and the 2010 highs
  • The weekly RS line is trying to hold its longer-term uptrend, line f, as it has turned over the past two weeks
  • Weekly OBV has moved well above its flat weighted moving average, which is consistent with a bottom formation. One more pullback to the WMA is possible
  • Daily OBV (not shown) does not look as strong as its weekly counterpart
  • There is initial resistance at $3.53 with further resistance at $3.89. Longer-term resistance is at $4.30-$4.50
Click to Enlargechart
Denison Mines Corp. (DNN) is a much larger, $1 billion company with interests in both the US and Canada. It peaked in February at $4.48 before plunging to a low of $1.70 in late June. This was a 62% decline from the highs.
  • The recent lows (line a) correspond to the 2010 highs, and additional support is in the $1.30-$1.35 area
  • The daily RS analysis is still negative, as it shows a pattern of lower highs and lower lows. On top of the RS, I have also plotted a 21-period weighted moving average that can help identify trends in the RS
  • The daily RS dropped below its weighted moving average in February and then violated support, line b, in March. The RS now shows a similar pattern to what occurred in the summer of 2010 (see circles), which suggests the stock may be bottoming out
  • Daily OBV is still negative, as there was heavy selling on the drop early in the year. Weekly OBV (not shown) could bottom in the next month
  • Key resistance on the weekly chart is at $2.43, and a close above this level would be positive. Additional resistance is in the $2.90-$3.00 area
Uranium Resources, Inc. (URRE) is a small, $200 million company whose stock may have already bottomed. It peaked in February at $3.98 and then hit a low of $1.37 in March. URRE held above this low by a penny in June. This support goes back to 2009 and 2010.
  • There is further support on the weekly chart in the $1.20 area
  • The weekly RS analysis has tested its declining weighted moving average but does not yet indicate a bottom has been formed
  • The RS completed a bottom formation last summer, moving above its WMA. Several weeks later, the RS started to rise, and URRE subsequently rose from $0.65 to its 2011 high of $3.98
  • The weekly OBV has moved back above its weighted moving average, which has now flattened out. This is also a positive sign
What It Means: The prevailing outlook for the nuclear industry and uranium prices still appears to be quite negative. These four uranium stocks have dropped precipitously from the highs made earlier this year. Two of them, Uranerz Energy Corp. (URZ) and Uranium Resources, Inc. (URRE), appear to be completing weekly bottom formations. The other two, Cameco Corp. (CCJ) and Denison Mines Corp. (DNN), look vulnerable to further declines back to or below their recent lows.

Despite the negative outlook, a small, 3%-5% commitment to uranium stocks still seems reasonable, as those economies with the largest growth potential will need to rely on nuclear power.

How to Profit: For Cameco Corp. (CCJ), given no clear signs of a bottom, I would only look to buy on a test of the recent lows. Therefore, go 50% long at $23.16 and 50% long at $22.56 with a stop at $21.14 (risk of approx. 7.5%).

The technical outlook for Uranerz Energy Corp. (URZ) is better. Go 50% long at $2.96 and 50% long at $2.78 with a stop at $2.67 (risk of approx. 6.9%).

For Denison Mines Corp. (DNN), one more drop looks likely, so the risk in buying is higher. Go 50% long at $1.76 and 50% long at $1.64 with a stop at $1.53 (risk of approx. 10%).

Finally, for Uranium Resources, Inc. (URRE), go 50% long at $1.54 and 50% long at $1.42 with a stop at $1.32 (risk of approx. 10.8%).

Follow Us