By Ed Easterling, Crestmont Research (courtesy of John Mauldin)
The end is near! Stock market history and earnings cycle history are converging. As a result, the market is likely to be down for the year 2011 or 2012. If not, then it will have been different this time.
Crestmont’s research focuses primarily on long-term secular stock market cycles and their fundamental drivers. Inside of the secular periods are short-term cyclical cycles, primarily driven by psychology, collective emotion, and reactions to current events. These short-term cycles are part of the market process to incorporate new information and to balance the pressures of buyers and sellers. In the long-run, the short-term cycles are reconciled back to the long-term fundamentals of value.
The stock market remains in a secular bear market. Actually, it is still in the early stages of a secular bear based upon relatively high P/E valuations currently and a relatively low core inflation rate (the driver of P/E over time).
Secular bear markets, albeit fairly flat periods for returns, experience violent interim swings—it’s just the nature of market volatility. Although Crestmont’s research does not explain or predict the short-term movements, it does recognize a fundamental nature and tendency that should be respected. For example, even if we can’t explain why there tends to be short runs of positive years in the market, we should realize that risk increases as we approach the historical limits.
Beware: there are two series of short-term trends that are converging on their limits. They portend increased risk for the stock market (…or new historical precedent). The first is the sequence of market gains and losses; the second is the earnings cycle.
The goals of this discussion are (1) to dispel the notion that P/E is low today and (2) to highlight the risks of a market decline in 2011 or 2012.
P/E TODAY
Most reports and articles about stock market valuation contend that P/E is low and below average—supposedly, it is a harbinger for upcoming gains. This is the result of two major distortions. The first distortion is that the reported P/E is based upon unsustainable earnings (EPS). The second distortion results from comparing P/E to its historical average.
On the first point, profit margins are near historical highs; it is unrealistic to expect that the trend will extend indefinitely into the future. For more details, see Beyond The Horizon: Redux 2011 at CrestmontResearch.com. Otherwise, here are the basics. The graphs virtually speak for themselves, yet a few notes are included as highlights.
Figure 1. Pre-Tax Corporate Profits As % of GDP: Quarterly 1990–1Q2011
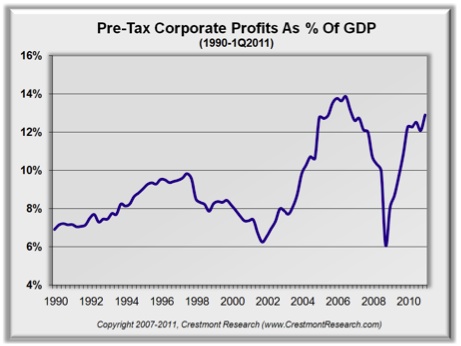
NOTE: Profit margins are returning to lofty levels, and this does not reflect the forecast by most analysts for even higher margins. Based upon the current forecast for public company earnings, the line in the graph should exceed 14% by 2012.
Figure 2. The Analysts’ Forecast: S&P’s Outlook—Percentages
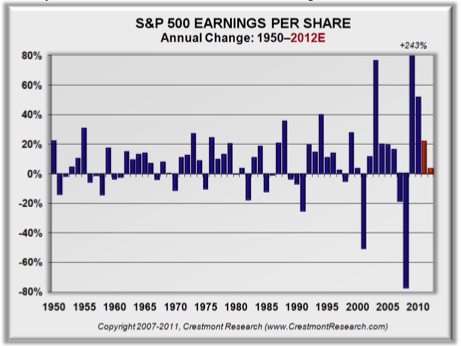
NOTE: Historical annual changes and S&P’s forecast for the percentage change in as-reported earnings per share (EPS) for 2011 and 2012.
Figure 3. The Analysts’ Forecast: S&P’s Outlook—Dollars
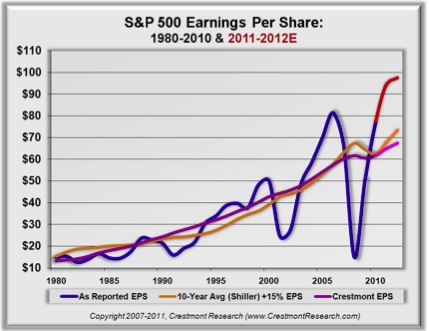
NOTE: The blue line is actual reported EPS; the red line extension is S&P’s forecast. The orange and purple lines are baseline normalized EPS using Crestmont’s & Shiller’s methodologies (the latter one is adjusted as described in Probable Outcomes: Secular Stock Market Insights).
Figure 4. Magnitude of EPS Over/Under Baseline Trend
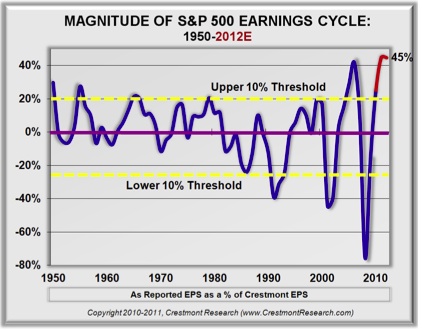
NOTE: This graph reflects the percentage variance of reported EPS over and under the baseline trend EPS based upon Crestmont’s methodology. Current forecasts imply record profit margins.
Figure 5. Duration of EPS Cycles
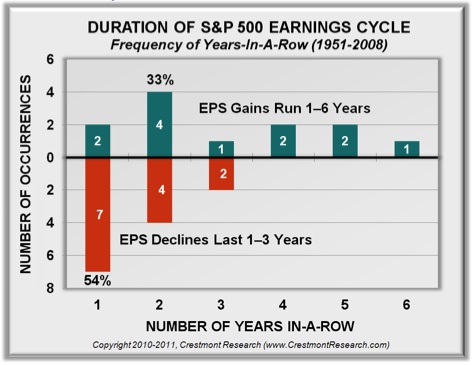
NOTE: So if you are convinced that a reversion of profit margins is imminent, how soon could it happen? Past EPS cycles have lasted one to six years. Over the past six decades, there have been twelve up-cycles. Six lasted one or two years (2010 was year two for the current cycle). We’re now in the second half of the game. As each upcoming year passes with an increase in EPS, the likelihood rises for the next decline in the market.
Conclusion #1: Reported earnings are expected to decline over the next two years (or they are increasingly likely to disappoint current expectations). That will put pressure on the stock market. If history is a guide, and if the line in Figure 4 only slightly retreats below the baseline, the implication is adecline in reported EPS of almost 40%!
Conclusion #2: The measures of P/E that are based upon reported EPS are currently distorted by the business cycle. Whereas current reports reflect forward P/Es near 13, a more rational measure for P/E based upon normalized baseline EPS is close to 20. P/E is not below average and is not ready to propel the market upward, it is well above average. But a high P/E does not necessarily mean that the stock market is “overvalued”…
MISGUIDED AVERAGE
The average yield from U.S. Treasury bonds over the past fifty years is almost 7%. Today, the yield is near 3.5%. Are Treasury bonds grossly overvalued?
Before we can compare today’s yield to the historical yield, it’s important to assess the driver of bond yields—the inflation rate. Over the past fifty years, inflation averaged near 4%; today’s reports reflect inflation at less than half of that rate. Since the inflation rate drives the yield of a bond, today’s below-average inflation is causing bond yields to be below-average. Therefore, to assess relative valuation and the appropriate bond yield, we should compare it to the inflation rate.
For example, when the inflation rate was below its average over the past fifty years, bond yields averaged under 6%. But when the inflation rate was above its average, bonds averaged over 8%.
Likewise for the stock market. Inflation drives the P/E ratio. When the inflation rate has been below average, P/E has typically been in the upper teens. Higher inflation and deflation drive P/E into the lower teens (and with extreme inflation and deflation, P/E went well into single digits).
As an analogy, consider the weather report for Chicago. Wouldn’t you laugh if the weatherman boasted:“G-o-o-d morning and Happy New Year in the Windy City. Today’s high will be near 50 degrees! It’ll be a chilly one for sure on this first day of the year, since the long-term average high in Chicago is almost 60 degrees…” What, chilly at 50 on a January day in Chicago?!
Yes, the average daily high in Chicago is 60 degrees, but not in January. Even weathermen, with their notorious imprecision, know to use a relevant average—one that is at least generally comparable.
If bond market folks and weathermen know to use relevant benchmarks, then why do we let stock market analysts and writers lead us with a convoluted average?
The reality is that today’s relevant average for P/E is closer to 20 than to the recognized long-term average near 15. The inflation rate is relatively low and bond yields are relatively low; thus, P/E is appropriately above the long-term average that includes both low inflation rate and high inflation rate periods.
As a result, the stock market currently is not overvalued, nor is it undervalued. Today’s high normalized P/E corresponds to the relatively low inflation rate (the relatively high P/E also reflects current secular bear market conditions). Thus, the stock market is near fairly valued albeit at high levels (given the inflation rate at low levels) as well as in the early stages of a secular bear because valuations are high yet trending lower.
Today’s normalized P/E of 20 is within the range of fair value given the relatively low inflation rate. Most importantly, investors cannot rely upon the tailwind of an undervalued market, nor should they necessarily fear the headwinds of an overvalued market. So if the fundamental conditions do not overlay a directional bias, what’s likely ahead of us in the near-term?
IN-A-ROWS
Although P/E is near fair value for the long-run, the stock market may be vulnerable in the short-run. Long-term secular stock market cycles are punctuated by short-term cyclical cycles. This leads to the second major point of this discussion—the current run in the market is nearing its typical limit.
The market does not always go up in secular bull markets, nor does it constantly go down in secular bear markets. Instead, the market’s fluctuations alternate between periods of gains and losses. This is the concept behind “in-a-rows.” In-a-row reflects the number of periods in one direction before a reversing period in the other direction.
For example, assume that the market goes up in years 1, 2, and 3. Then in years 4 and 5 the market declines. Years 6 through 9 are winners, then year 10 is a loser. In this example, we have a 3 in-a-row, followed by a 2, then a 4, and last a 1. The gain periods are 3 and 4 in-a-row and the loss periods are 1 and 2 in-a-row.
There may not be cause and effect explanations for longer gain periods and shorter loss periods. Nonetheless, if we find that the pattern repeats over time, there is at least a propensity worth recognizing. If gains have always been 3’s and 4’s while losses were always 1’s and 2’s, then what should we expect for the future? We certainly can’t and shouldn’t bet the farm on a second year gain, yet we should recognize that the trend will match its historical limit in year 4…and it’ll make history if year 5 is up.
Before exploring the actual characteristics of the cyclical cycles inside secular periods, let’s review the overall characteristics of secular bulls and bears. Using another weather analogy, secular bull markets are periods like spring. During the spring, daily high temperatures generally rise. Today’s high is not always higher than yesterday, but the trend is upward. That’s analogous to what the stock market experienced in the 1980s and ‘90s, a generally rising trend across the two decades.
Secular bear markets are periods somewhat like winter. During much of winter, the daily highs fluctuate without a general trend. The general declines of fall have ended and the general increases of spring have yet to arrive. That’s analogous to what the stock market experienced over the past decade and during most of the 1960s and the 1970s.
Each type of secular period reflects different characteristics. During secular bull markets, when the trend is generally rising, the up-periods tend to last longer than the downs. Based upon annual data, the average cumulative gain during cyclical cycles in secular bull markets is 100% before the next down period, which averages a loss of just over -6%. As a result, the short-term cycles in secular bulls deliver net returns of 87% on average (the length and number of ups and downs vary, so the averages can’t be used to calculate the net).
During secular bear markets, when the market is generally flat and choppy, the duration of the up-periods and down-periods are somewhat similar. Further, although the average cumulative gain during cyclical cycles in secular bear markets is 42% and the average loss is -29%, the power of losses mutes the gains. As a result, the short term cycles in secular bears deliver net returns of 1% on average.
Figure 6 reflects the frequency of in-a-rows for combined secular bulls and bears as well as the frequency for each type of market. To illustrate, 41% of the time across all years from 1901 to 2010, the market reversed course during the subsequent year (i.e., if it was up one year, then it was down the next or vice versa; thus, only one year in-a-row either direction before reversing direction).
Figure 6. Cyclical Cycles Within Secular Stock Market Cycles
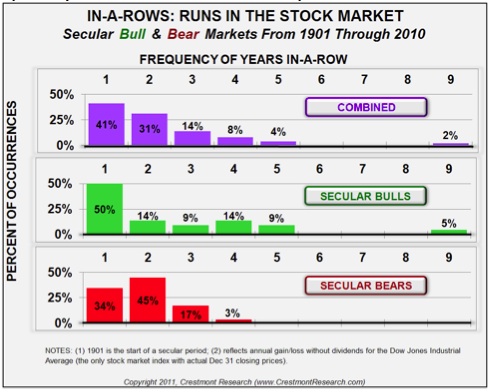
Figure 7. Cyclical Cycles Within Secular Bull Markets
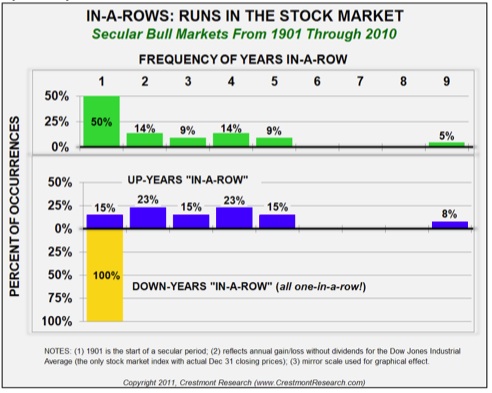
During secular bulls, one-in-a-rows occurred half the time compared to approximately one-third of the time for secular bears. Secular bears, however, tend to have a profile that is more concentrated into shorter durations, while secular bulls tend to have longer runs.
It may be surprising to see that secular bulls have so many one-in-a-rows, especially compared to secular bears. That is where the details are revealing.
All declines in secular bull markets (nine of them) have lasted only one year. In contrast, the short-term bull runs generally stretch over five years (and one lasted nine years). After two or three years of gains, it’s still reasonable to expect another year or more of gains (especially if the cumulative gains have been modest).
Figure 8. Cyclical Cycles Within Secular Bear Markets
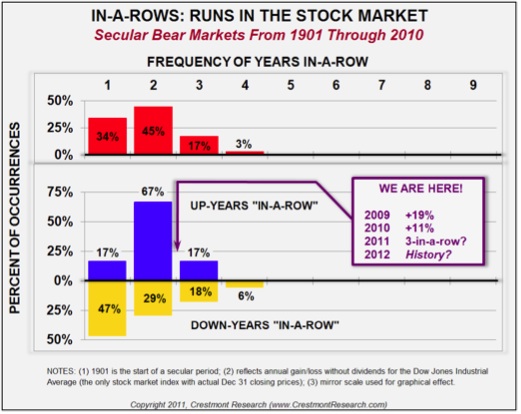
In secular bear markets, the gains most often last two years—with the other in-a-rows split evenly between one and three years. The losses last a year about half the time, with declining frequency out to four years.
So where are we now? The past two years were up, 19% and 11% respectively. Cumulatively, that’s 32%. The historical average cumulative gain for cyclical cycles in secular bear markets is 42%. Therefore, after two consecutive up-years, if this year ends with gains, it’ll add another mark to the three-in-a-row column. For 2012, assuming a gain this year, an up-year would make history.
As for today’s perspective, the Dow is near 12,500. When we add this year’s gain to the cumulative gain last year, we’re up 42% for this cyclical cycle (exactly the average of past up-year runs in secular bear markets). This is not a prediction that the market is reaching its top, but it is a reflection that this cycle has not only duration but also magnitude.
CONVERGENCE TO CONCLUSION
By the end of this year, the earnings cycle is likely to be well above its typical thresholds of duration (certainly into the second half of the game) and magnitude (well beyond the upper 10% threshold and at record levels). Although earnings could again rise in 2012 without making history (especially if there are shortfalls to the gains in 2011), the magnitude of excess margins portends a fairly significant decline when the earnings cycle reverts.
In addition, the profile of cyclical cycles in the stock market may have also run its course. The market may sustain or extend its gains for 2011 by year-end, but another up-year in 2012 would make history. Not only is duration stretched, but also the magnitude of cumulative gains has now matched the historical average.
In the longer-run, over this decade for example, the fundamental drivers of stock market returns will provide total nominal returns of 6% or less compounded annually. The current level of normalized valuation (P/E) provides dividend yields near 2%, earnings growth of less than 4%, and little room for P/E expansion. Should the inflation rate rise over the next few years, thereby increasing the nominal growth rate of earnings, the resulting decline in P/E will more than offset it. The probable outcomes for the stock market over this decade, using your assumptions and outlook for key variables, are the subject of recently-released Probable Outcomes: Secular Stock Market Insights(www.ProbableOutcomes.com).
In the shorter-run, the drivers of cyclical cycles will continue to provide investors with a dramatic spectacle. For those seeking investment success, their investment approach must change with the market environment. The approaches that work in secular bull markets fail in secular bears. Secular bear markets are more demanding. They require diversification, skill, and active portfolio management.
With two major market factors converging on the horizon, is your portfolio positioned to resist the risks while still participating in the opportunities?
No comments:
Post a Comment