by
Crude Oil ($CL_F) has been an enigma the past 3 months. Almost over night forecasts of West Texas Intermediate Crude Oil went from $200 per barrel back to $80 per barrel. The range has tightened a bit now but the direction is still eh source of heated debate. Let’s take a deep dive look and see if there are any clues in the charts.

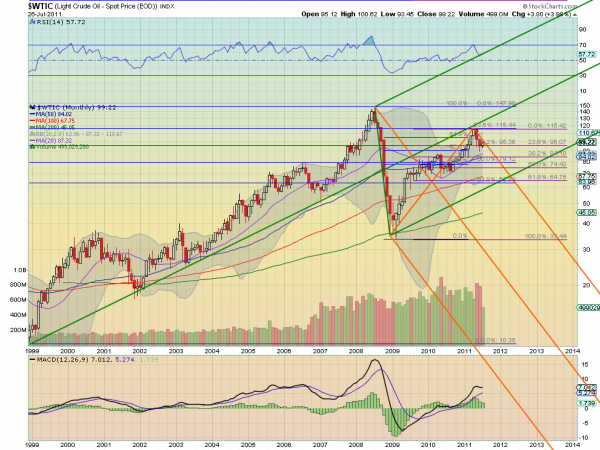
The monthly chart above shows that Crude prices are bound within the Upper Median Line of the bearish orange Pitchfork, following it down, after bouncing lower off of the Median Line of the bullish green Pitchfork in April. It is also sitting on very tight Fibonacci levels at 96.07 as 23.6% retracement of the move from the 2009 low to the April high, and 95.36 as 38.2% of the move from the 2008 high to the 2009 low. Losing support of these Fibonacci levels would see support lower at 84.10 and then possible a walk down the orange Pitchfork to the green Pitchfork Lower Median Line. The Relative Strength Index (RSI) and the Moving Average Convergence Divergence (MACD) indicator are both supporting more downside on this time frame. If it can break above the orange Upper Median Line then it should be drawn back to the green Median Line and the 115.44 Fibonacci area.

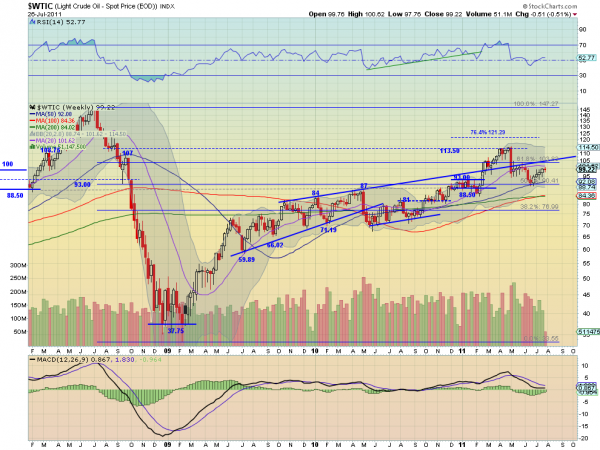
The weekly chart shows a more bullish scenario in the short term. After bouncing off of the 50% retracement of the move from 2008 to 2009 at 90.41 it has been rising back towards the intersection of the 61.8% Fibonacci at 104 and the extension of the trendline resistance from October 2009 above the resistance at 100 from May. The RSI is rising and the MACD is improving support a run higher. If it can get through the 104 then it has resistance higher at 113.50. But rejection at 100 or 104 sees support lower at 93 followed by 90.40 and then 88.50.

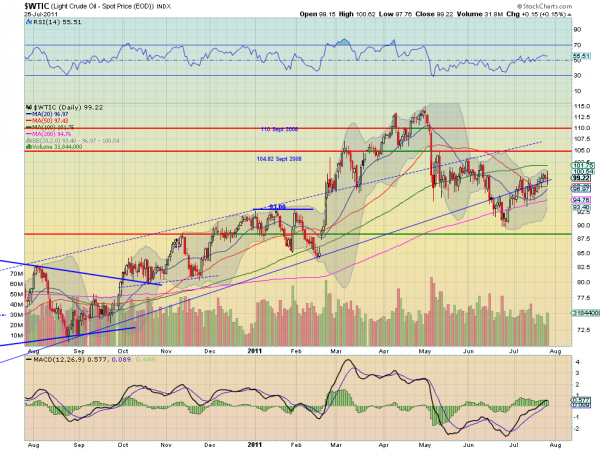
The daily chart is sporting a bullish flag but a long legged doji Tuesday. The RSI is falling over and the MACD is moving from level to slightly falling. Both supporting more downside but not authoritatively. The 20 day SMA is curling up towards a cross with the 50 day SMA as well. The resistance range between 98 and 100 is easily seen as is the support area between 95 and 98. Support lower is found at 93 and then 90 and resistance higher at 100 and then 104.82.
Summarizing, the monthly chart looks lower but is only a few dollars from changing that bias to the upside. The weekly chart looks better to the upside but with big resistance at 104 and the daily chart looks higher as well. Putting it all together gives the view of limited upside in the short term with a top at either 100 or 104, but a move above that making it a clean sweep to the upside. Failure at 104 is what the monthly chart suggests now.
No comments:
Post a Comment