| | "Somebody" I want somebody to share |
Sunday, April 6, 2014
Depeche Mode - Somebody
The time has come to leave running the faster strategies …
 | On the side I put the equity line of our Nivor portfolio strategies , composed entirely by fast automatic strategies. Here worked with $ 1M. I have highlighted on the chart the areas where low volatility slowed the growth of equity. Inside of these areas I have highlighted on red two points, where the technical situation of Vix is very similar. The first area is March 2006, the second is for the same period of 2014. I think the time has come to leave running the faster strategies, which work very well with medium-high volatility. Let's look ahead .. |

SPY Trends and Influencers April 5, 2014
by Greg Harmon
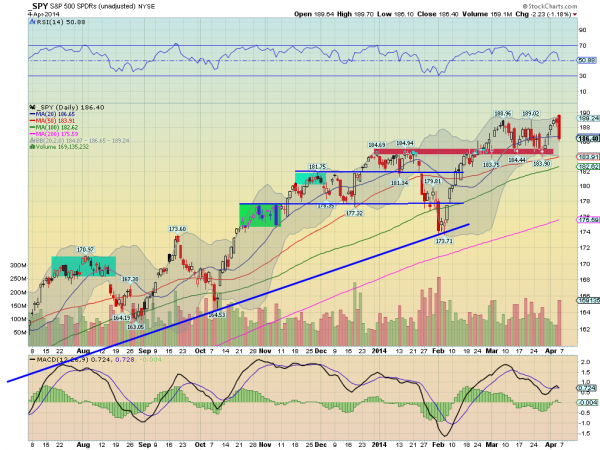
| A weekly excerpt from the Macro Review analysis sent to subscribers on 10 markets and two timeframes. Last week’s review of the macro market indicators suggested, as the calendar prepared to turn into April the equity markets were looking weak. Elsewhere looked for Gold ($GLD) to continue lower while Crude Oil ($USO) continued to move higher. The US Dollar Index ($UUP) looked better to the upside as did US Treasuries ($TLT), but both with big resistance areas nearby. The Shanghai Composite ($SSEC) looked back to its downward price action but Emerging Markets ($EEM) were biased to the upside with some caution after a big week with short term topping signs. Volatility ($VIX) looked to remain subdued keeping the bias higher for the equity index ETF’s $SPY, $IWM and $QQQ, despite the moves lower. Their charts were not so optimistic though with the IWM and QQQ in pullbacks that looked to continue while the SPY tried to hold on in consolidation. The week played out with Gold probing lower before rebounding to end the week up while Crude Oil started lower but also rebounded late in the week. The US Dollar moved slightly higher while Treasuries found trouble at that overhead resistance and pulled back. The Shanghai Composite muddled along sideways while Emerging Markets finally met some resistance and consolidated. Volatility made a new two month low before rebounding slightly. The Equity Index ETF’s halted started the week well but ended worse, with the SPY giving back most of the gains, the IWM virtually all of them and the QQQ the worst, giving all the gains and some more making a lower low in the process. What does this mean for the coming week? Lets look at some charts. As always you can see details of individual charts and more on my StockTwits feed and on chartly.) SPY Daily, $SPY 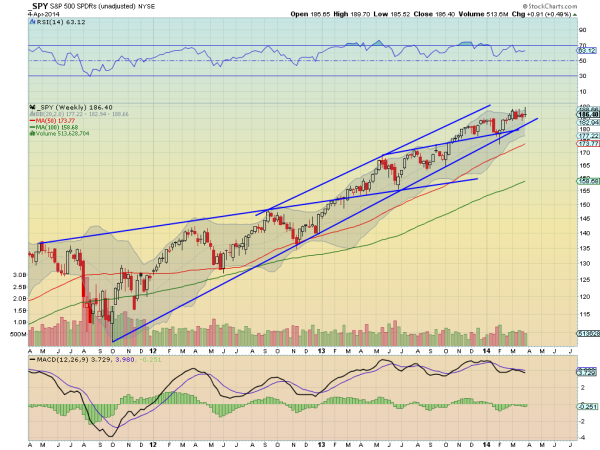 The SPY started the week moving higher, continuing the bounce off of support from the prior week. On Friday it made a new intraday high near the open and then proceeded to sell off the rest of the day, finishing with a strong red candle lower below the 20 day SMA. Volume was solid but not extreme on the sell off, and you will note on the daily chart has been running higher on down days than up days consistently now since mid March. But with that negative backdrop it has yet to break the consolidation range lower, below 184. The RSI on the daily chart is moving back lower, at the mid line, with a MACD that may cross lower Monday. The short term looks lower in the range. On the weekly chart the consolidation of the last 6 weeks is clear as it moves sideways towards the rising trend support line. The RSI on this timeframe is in the bullish zone and flat while the MACD failed to signal higher and is in a soft slope lower. A mixed bag. There is resistance higher at 188.96-189.70, and then a break higher would see a Measured Move target 200. Support lower comes at 184 and 181.80 with 177.50 and 174 following that. A move under 174 turns the trend bearish. Pulling Back in Consolidation Zone in the Uptrend. Moving into next week the equity markets continue to look weak. Elsewhere look for Gold to move higher with Crude Oil in the short term. The US Dollar Index and US Treasuries are also biased to the upside with a chance that treasuries just churn their wheels sideways. The Shanghai Composite is poised to consolidate in the downtrend while Emerging Markets are biased to the downside in the short run after a strong move higher. Volatility looks to remain subdued keeping the bias higher for the equity index ETF’s SPY, IWM and QQQ, despite the moves lower last week. Their charts do not share the upside optimism in the short run with the SPY the strongest pulling back near support, the IWM next at support but weak and the QQQ looking lower in the short run. The longer view is similar with the SPY the strongest and consolidating while the IWM is at support and the QQQ moving lower. Use this information as you prepare for the coming week and trad’em well. |
Follow the Trends with Quarterly Pivots
by Tom Aspray
| As we start a new quarter, it is time to determine whether the quarterly pivots helped one navigate what was a frustrating market for many investors and most traders. In December of 2012, I wrote “The Most Powerful Pivot Level” where I discussed using quarterly pivots which had been shown to me several years ago by John Person. Since they were going to be featured in his new book, I was able to share his research with my readers. Since then, they have been featured in several other articles and I have been providing a table each quarter that can be used as a reference. The rather simplistic approach that I use is to watch whether a market average, stock, or ETF has a weekly close above or below their quarterly pivots. I also use the pivot resistance levels as another way to determine upside targets. Sometimes, the quarterly levels will also correspond to weekly or monthly starc bands, which suggests that this level is even more important.
On the table I have highlighted those ETFs (in red) that started off the first day of the quarter by closing below their new quarterly pivots. Those highlighted in green closed, on April 1, above their new quarterly pivots. Several of the ETFs could rally enough by the end of the week to close back above their quarterly pivot levels. This makes Friday’s close, and the reaction to the unemployment report, even more important. It would take a severe decline on Thursday and Friday to drop many of the ETFs below their quarterly pivots.
As I have discussed in prior articles, the Spyder Trust (SPY) did not have a weekly close below its quarterly pivot in 2013. On the chart, line a, represents the fourth quarter pivot for 2013, which was at $167.72. In early October, SPY had a weekly low of $162.92 but rebounded sharply to close the week at $168.60. For the first quarter of 2014, the pivot was at $177.97, line b. The daily chart insert shows that the sharp drop, on Monday, February 3, took the SPY well below the quarterly pivot, as Wednesday’s low was $172.95. There were signs at the time that this could be a panic low, as it increased the bearish sentiment and the ARMS Index hit an oversold extreme. The SPY was able to rebound by the end of the week at $178.89, which was well above the quarterly pivot. The 20-week EMA, which has provided good support over the past year, was sharply violated during the early February drop, but not on a closing basis. For the second quarter, the pivot is at $183.25 with the R1 resistance at $192.79, which corresponds nicely with the upside target from the recently completed trading range. The rising 20-week EMA is at $182.72. The PowerShares QQQ Trust (QQQ) opened the New Year by closing the first week of 2014 well above the quarterly pivot at $84.09, line a. In early February, the QQQ dropped as low as $83.20 on February 5, but closed the week at $86.74. As I suggested last October, one way to avoid panic selling is to “Avoid the Noise, Watch the Numbers,” which was referring to the quarterly pivot levels. On March 7, the QQQ hit a high of $91.36, which was not too far below the quarterly R2 resistance at $91.83, line b. For the second quarter, the pivot stands at $87.47 with the S1 support at $83.59. On the upside, the R1 resistance is just slightly above the March high at $91.56.
As of the close on Wednesday, April 2, the daily studies for the QQQ are still negative but have turned up. I pointed out last month that the daily relative performance had turned negative and, subsequently, the weekly RS line also dropped below its WMA. The weekly and monthly OBV are still clearly positive. The biotechnology sector was the hottest sector for most of the first quarter, as the iShares Nasdaq Biotechnology (IBB) ended 2013 at $227.06 and closed on February 25 at $273.20. This was a rise of 20.3%. Subsequently, IBB dropped sharply to a low of $228.68 in late March. It ended the quarter with a gain of just over 4%.
The chart shows that the quarterly R1 and R2 resistance levels were both easily exceeded, as the rally topped out just below the R3 resistance at $276.50. The trend line resistance on the daily chart, line b, was tested as IBB was topping out. For the second quarter, the pivot stands at $244.70, which is not too far above the April 2 close at $241.60. On a weekly close back above the quarterly pivot, the R1 resistance for the second quarter stands at $267.10. It has been a tumultuous past two quarters for gold and the gold miners as they started the last quarter of 2013 below the quarterly pivots. For the week ending October 18, both closed back above the quarterly pivots, but the signals did not last long. The chart of the SPDR Gold Trust (GLD) shows the move above the quarterly pivot at line a, and then the drop below it two weeks later. The ensuing nine week decline took GLD to a low of $114.50, which was just below the quarterly S1 support at $115.04 (see table). For the first quarter of 2014, the pivot, line c, was at $120.67, which was overcome on Friday January 17 as GLD closed at $120.93 (see arrow). Over the next eight weeks, GLD rallied to a high of $133.69 on March 14 and was up 15% for the year. GLD easily overcame the R1 resistance at $126.89 by the middle of February.
The decline from the highs has been equally sharp. On April 1, GLD closed at $123.39, which was below the second quarter’s pivot at $124.80. It did have nice gains of just over 7% for the first quarter, but gave up over half of its gains. It could rally back above the pivot by Friday’s close. As I have noted previously, the weekly OBV on GLD did form a bullish divergence at the December lows that was confirmed by the move above the prior high. The weekly OBV is declining but is still well above its rising WMA. The daily studies are still negative but are now trying to turn higher. I attempted to buy the pullback but it has been sharper than expected, as the 50% Fibonacci support levels have been violated and my stops were hit. The Market Vectors Gold Miners (GDX) also tested the 61.8% support but it gapped higher on April 2 on heavy volume. It may close the week back above its second quarter pivot at $24.30. |


Ugo Bardi: The Banquet of Consequences
by Adam Taggart
"Growth is the problem; not the solution" says Ugo Bardi, Professor of Physical Chemistry at Italy's University of Florence and author of the recent book Extracted: How the Quest for Mineral Wealth is Plundering the Planet. In this week's podcast, Professor Bardi and Chris discuss resource depletion and its growing impact on geopolitical events and the world economy. In many ways, the future is becoming increasingly predictable due to the obvious math of resource extraction. Many of these predictions, by the way, are not new; but an accelerating preponderance of evidence now indicates we are quickly moving into the era where future forecasts are now becoming present reality. From Bardi's perspective, human society has been running at an unsustainably high rate of consumption given the resources it depends on. At some point, the limits of scarcity will force a contraction of the status quo. Bardi concludes that time is now:
|
Soaring Chinese Gold Demand And Its Geopolitical Strategy
by Alasdair Macleod
Geopolitical and market background
The impact of these revelations on estimates of total identified demand and the drain on bullion stocks from outside China is likely to be dramatic, but confirms what some of us have suspected but been unable to prove. Western analysts have always lagged in their understanding of Chinese demand and there is now evidence China is deliberately concealing the scale of it from us. Instead, China is happy to let us accept the lower estimates of western analysts, which by identifying gold demand from the retail end of the supply chain give significantly lower figures. Before 2012 the Shanghai Gold Exchange was keen to advertise its ambitions to become a major gold trading hub. This is no longer the case. The last SGE Annual Report in English was for 2010, and the last Gold Market Report was for 2011. 2013 was a watershed year. Following the Cyprus debacle, western central banks, seemingly unaware of latent Chinese demand embarked on a policy of supplying large quantities of bullion to break the bull market and suppress the price. The resulting expansion in both global and Chinese demand was so rapid that analysts in western capital markets have been caught unawares. I started following China's gold strategy over two years ago and was more or less on my own, having been tipped off by a contact that the Chinese government had already accumulated large amounts of gold before actively promoting gold ownership for private individuals. I took the view that the Chinese government acted for good reasons and that it is a mistake to ignore their actions, particularly when gold is involved. Since then, Koos Jansen of ingoldwetrust.ch has taken a specialised interest in the SGE and Hong Kong's trade statistics, and his dedication to the issue has helped spread interest and knowledge in the subject. He has been particularly successful in broadcasting market statistics published in Chinese to a western audience, overcoming the lack of information available in English. I believe that China is well on the way to having gained control of the international gold market, thanks to western central banks suppression of the gold price, which accelerated last year. The basic reasons behind China's policy are entirely logical: • China knew at the outset that gold is the west's weak spot, with actual monetary reserves massively overstated. For all I know their intelligence services may have had an accurate assessment of how much gold there is left in western vaults, and if they had not, their allies, the Russians, probably did. Representatives of the People's Bank of China will have attended meetings at the Bank for International Settlements where these issues are presumably openly discussed by central bankers. • China has significant currency surpluses under US control. By controlling the gold market China can flip value from US Treasuries into gold as and when it wishes. This gives China ultimate financial leverage over the west if required. • By encouraging its population to invest in gold China reduces the need to acquire dollars to control the renminbi/dollar rate. Put another way, gold purchases by the public have helped absorb her trade surplus. Furthermore gold ownership insulates her middle classes from external currency instability which has become an increasing concern since the Lehman crisis. For its geopolitical strategy to work China must accumulate large quantities of bullion. To this end China has encouraged mine production, making the country the largest producer in the world. It must also have control over the global market for physical gold, and by rapidly developing the SGE and its sister the Shanghai Gold Futures Exchange the groundwork has been completed. If western markets, starved of physical metal, are forced at a future date to declare force majeure when settlements fail, the SGE and SGFE will be in a position to become the world's market for gold. Interestingly, Arab holders have recently been recasting some of their old gold holdings from the LBMA's 400 ounce 995 standard into the Chinese one kilo 9999 standard, which insures them against this potential risk. China appears in a few years to have achieved dominance of the physical gold market. Since January 2008 turnover on the SGE has increased from a quarterly average of 362 tonnes per month to 1,100 tonnes, and deliveries from 44 tonnes per month to 212 tonnes. It is noticeable how activity increased rapidly from April 2013, in the wake of the dramatic fall in the gold price. From January 2008, the SGE has delivered from its vaults into public hands a total of 6,776 tonnes. This is illustrated in the chart below.
This is only part of the story, the part that is in the public domain. In addition there is gold imported through Hong Kong and fabricated for the Chinese retail market bypassing the SGE, changes of stock levels within the SGE's network of vaults, the destination of domestic mine output and scrap, government purchases of gold in London and elsewhere, and purchases stored abroad by the wealthy. Furthermore the Chinese diaspora throughout South East Asia competes with China for global gold stocks, and its demand is in addition to that of China's Mainland and Hong Kong. The Shanghai Gold Exchange (SGE) About 75% of the SGE's gold turnover is for forward settlement and the balance is for spot delivery. Standard bars are Au99.95 3 kilos (roughly 100 ounces), Au99.99 1 kilo, Au100g and Au50g. The institutional standard has become Au99.99 1 kilo bars, most of which are sourced from Swiss refiners, with the old Au99.95 standard less than 15% of turnover today compared with 65% five years ago. The smaller 100g and 50g bars are generally for retail demand and a very small proportion of the total traded. Public demand for smaller bars is satisfied mainly through branded products provided by commercial banks and other retail entities instead of from SGE-authorised refiners. Overall volumes on the SGE are a tiny fraction of those recorded in London, and the market is relatively illiquid, so much so that opportunities for price arbitrage are often apparent rather than real. The obvious difference between the two markets is the large amounts of gold delivered to China's public. This has fuelled the rapid growth of the Chinese market leading to a parallel increase in vaulted bullion stocks, which for 2013 is likely to have been substantial. By way of contrast the LBMA is not a regulated market but is overseen by the Bank of England, while the SGE is both controlled and regulated by the People's Bank of China. The PBOC is also a member of both its own exchange and of the LBMA, and deals actively in non-monetary gold. While the LBMA is at arm's length from the BoE, the SGE is effectively a department of the PBOC. This allows the Chinese government to control the gold market for its own strategic objectives. Quantifying demandIdentifiable demand is the sum of deliveries to the public withdrawn from SGE vaults, plus the residual gold left in Hong Kong, being the net balance between imports and exports. To this total must be added an estimate of changes in vaulted bullion stocks. SGE gold deliveries
Growth in public demand for physical gold is a reflection of the increased wealth and savings of Chinese citizens, and also reflects advertising campaigns that have encouraged ordinary people to invest in gold. Advertising the attractions of gold investment is consistent with a deliberate government policy of absorbing as much gold as possible from western vaults, including those of central banks. Hong Kong The mainstream media has reported on the large quantities of gold flowing from Switzerland to Hong Kong, but this is only part of the story. In 2013, Hong Kong imported 916 tonnes from Switzerland, 190 tonnes from the US, 176 tonnes from Australia and 150 tonnes from South Africa as well as significant tonnages from eight other countries, including the UK. She also imported 337 tonnes from Mainland China and exported 211 tonnes of it back to China as fabricated gold. Hong Kong is not the sole entry port for gold destined for the Mainland. The table below illustrates how Hong Kong's gold trade with China has grown, and its purpose is to identify gold additional to that supplied via Hong Kong to the SGE. Included in the bottom line, but not separately itemised, is fabricated gold trade with China (both ways), as well as the balance of all imports and exports accruing to Hong Kong.
The bottom line, "Additional supply from HK" should be added to SGE deliveries and changes in SGE vaulted gold to create known demand for China and Hong Kong. SGE vaulted gold The closest and most logical relationship for vaulted gold is with actual deliveries. After all, public demand is likely to be split between clients maintaining gold accounts at member banks, and clients taking physical possession. The ratios of delivered to vaulted gold were remarkably stable at 1.05, 1.03, and 0.99 for 2008, 2009 and 2010 respectively. On this basis it seems reasonable to assume that vaulted gold has continued to increase at approximately the same amount as delivered gold on a one-to-one basis. The estimated annual increase in vaulted gold is shown in the table below.
The benefits of vault storage, ranging from security from theft to the ability to use it as collateral, seem certain to encourage gold account holders to continue to accumulate vaulted metal rather than take personal possession. SupplySupply consists of scrap, domestically mined and imported gold Scrap Scrap is refined entirely by Chinese refiners, and as stated in the discussion concerning mine supply below, the absence of SGE standard kilo bars in Hong Kong is strong evidence that they are withheld from circulation. It is therefore reasonable to assume that scrap should be regarded as vaulted, probably held separately on behalf of the government or its agencies. Mine supply Typically, a mine will produce doré which has to be assessed and paid for before it is forwarded to a refinery. Only when it is refined and cast into standard bars can gold be delivered to the market. Broadly, one of the following procedures between doré and the sale of gold bars will occur: • The refiner acts on commission from the mine, and the mine sells the finished product on the market. This is inefficient management of cash-flow, though footnotes in the accounts of some mine companies suggest this happens. • The refiner buys doré from the mine, refines it and sells it through the SGE. This is inefficient for the refiner, which has to find the capital to buy the doré. • A commercial bank, being a member of the SGE, finances the mine from doré to the sale of deliverable gold, paying the mine up-front. This is the way the global mining industry often works. • The government, which ultimately directs the mines, refiners and the SGE, buys the mine output at pre-agreed prices and may or may not put the transaction through the market. I believe the government acquires all mine output, because it is consistent with the geopolitical strategy outlined at the beginning of this article. Furthermore, two of my contacts, one a Swiss refiner with facilities in Hong Kong and the other a vault operator in Hong Kong, tell me they have never seen a Chinese-refined one kilo bar. Admittedly, most one kilo bars in existence bear the stamp of Swiss and other foreign refiners, but nonetheless there must be over two million Chinese-refined kilo bars in existence. Either Chinese customs are completely successful in stopping all ex-vault Chinese-refined one kilo bars leaving the Mainland, or the government takes all domestically refined production for itself, with the exception perhaps of some 100 and 50 gram bars. Logic suggests the latter is true rather than the former. Since the SGE is effectively a department of the PBOC, it must be at the government's discretion if domestic mine production is put through the market by the PBOC. Whether or not Chinese mine supply is put through the market is impossible to establish from the available statistics, and is unimportant: no bars end up in circulation because they all remain vaulted. It is material however to the overall supply and demand picture, because global mine supply last year drops to about 2,490 tonnes assuming Chinese production is not available to the market. Geopolitics suggests that China acquires most, if not all of its own mine and scrap production, which accumulates in the vaulting system. This throws the emphasis back on the figures for vaulted gold, which I have estimated at one-for-one with delivered gold due to gold account holder demand. To this estimate we should now add both Chinese scrap and mine supply. This would explain why vaulted gold is no longer reported, and it would underwrite my estimates of vaulted gold from 2011 onwards. Further comments on vaulted gold Therefore, scrap and mined gold must be allocated into other vaults not included in the SGE network, and these vaults can only be under the control of the government. It will have been from these vaults that China's sudden increase in monetary gold of 444 tonnes in the first quarter of 2009 was drawn, which explains why the total recorded in SGE vaults was obviously unaffected. So for the purpose of determining the quantity of vaulted gold, scrap and mined gold must be added to the gold recorded in SGE vaults. Though it is beyond the scope of this analysis, the existence of government vaults not in the SGE network should be noted, and given cumulative mine production over the last thirty years, scrap supply and possibly other purchases of gold from abroad, the bullion stocks in these government vaults are likely to be very substantial. Western gold flows to ChinaWe are now in a position to estimate Chinese demand and supply factors in a global context. The result is summarised in the table below.
Chinese demand before 2013 had arrived at a plateau, admittedly higher than generally realised, before expanding dramatically following last April's price drop. Taking the WGC's figures for the Rest of the World gives us new global demand figures, which throw up a shortfall amounting to 9,461 tonnes since the Lehman crisis, satisfied from existing above-ground stocks. This figure, though shocking to those unaware of these stock flows, could well be conservative, because we have only been able to address SGE deliveries, vaulted gold and Hong Kong net flows. Missing from our calculations is Chinese government purchases in London, demand from the ultra-rich not routed through the SGE, and gold held by Chinese nationals abroad. It is also likely that demand from the Chinese diaspora in SE Asia and Asian is also underestimated by western analysts. There are assumptions in this analysis that should be clear to all. But if it only serves to expose the futility of attempts in western capital markets to manage the gold price, the exercise has been worthwhile. For much of 2013 commentators routinely stated that Asian demand was satisfied from ETF redemptions. But as can be seen, ETF sales totalling 881 tonnes covered only one quarter of the west's shortfall against China, the rest coming mostly from central bank vaults. Anecdotal evidence from Switzerland is that the four major refiners have been working round-the-clock turning LBMA 400 ounce bars into one kilo 9999 bars for China. They are even working with gold bars that are battered and dusty, which suggests the west is not only digging into deep storage to satisfy Chinese demand at current prices, but digging a hole for itself as well. |


Weighing the Week Ahead: Fluff or Fundamentals?
by Jeff Miller
| Sometimes markets emphasize simple themes, rejecting even modest efforts at nuance. The current big stories are the record highs in stocks, the length of time since the last significant correction, and the "market is rigged" meme. These themes are all easily grasped and interesting media fodder. It has set the agenda. Meanwhile, the economy seems to be providing a positive answer to early 2014 skepticism – Weather (!) or Not? The contrast between the economic fundamentals (and impending earnings results) and the "soft" stories will be the dominant theme during the upcoming week. Prior Theme Recap In the last installment of WTWA before my vacation, I expected the theme to feature new Fed Chair Janet Yellen in her first press conference. Some might have questioned that forecast, since we had already heard plenty from Yellen both in confirmation hearings and in her "Humphrey-Hawkins" testimony to Congress. What could be new? The era of Fed transparency yields ever longer statements, economic forecasts, and assurances about future guidance. There are also many speeches. The press conferences by the Fed Chair, given only when the overall forecast has been updated, require extemporaneous answers to questions from financial reporters. It can be a minefield. In response to question about how long the Fed might delay raising rates after QE ended, she hesitated and said a considerable time. With further pushing she mentioned "six months." This sent stocks into a downward spiral, since there is an over-reaction to any hint of Fed tightening even a modest reduction in the extremely easy Fed policy. Those who have been reading "A Dash" know better than to invest on such reactions, so we had yet another buying opportunity as the clarifications ensued. The theme actually extended over the next ten days. This all reminded me of Ben Bernanke's first year, when he made a few comments to CNBC's Maria Bartiromo at the White House correspondents' dinner. This is a fun affair, but Bernanke learned that he was not "off the record" and the result was a market-moving story. Bernanke admitted that it was a "lapse in judgment." This is a perfect illustration of the reason for my weekly post – planning for the week ahead. Readers are invited to play along with the "theme forecast." I spend a lot of time on it each week. It helps to prepare your game plan for the week ahead, and it is not as easy as you might think. This Week's Theme In the absence of much fresh news, we can expect another week of pundits on parade. I am calling this fluff versus fundamentals. On the fluff side I expect to see the following:
On the fundamental side we have the following:
The discussion will include some early speculation about Q1 earnings reports. I have some thoughts that I will share in the conclusion. First, let us do our regular update of the last week's news and data. Readers, especially those new to this series, will benefit from reading the background information. Last Week's Data Each week I break down events into good and bad. Often there is "ugly" and on rare occasion something really good. My working definition of "good" has two components:
The Good It was a big week for data including plenty of good news.
The Bad There was also some bad news.
The Ugly Middle East peace talks. Some believe that the White House has pulled the plug on Secretary Kerry. (See the CFR story). Whatever the reason, the lack of progress is disappointing. Humor We all deserve some laughs. Here is an amusing contrast. Congressman James P. Moran (D. VA) explains that members of Congress are underpaid at $174,000 per year with assorted benefits and perks. He explains that it is expensive to live in DC. Moran is retiring this year. (Rollcall) Former Fed Chair Ben Bernanke is raking in the speaking fees. He scored over $250K on his first gig, beating his full-year salary working for the Fed. This seems to be just a starting point. Given the frequency of Bernanke testimony and speeches, I wonder what additional information he has to offer? What sort of incentive structure does this create? Quant Corner Whether a trader or an investor, you need to understand risk. I monitor many quantitative reports and highlight the best methods in this weekly update. For more information on each source, check here. Recent Expert Commentary on Recession Odds and Market Trends Georg Vrba: Updates his unemployment rate recession indicator, confirming that there is no recession signal. Georg's BCI index also shows no recession in sight. For those interested in Canadian stocks, Georg has unveiled a new system. Doug Short: An update of the regular ECRI analysis with a good history, commentary, detailed analysis and charts. If you are still listening to the ECRI (2 ½ years after their recession call), you should be reading this carefully. Bob Dieli does a monthly update (subscription required) after the employment report and also a monthly overview analysis. He follows many concurrent indicators to supplement our featured "C Score." One of his conclusions is whether a month is "recession eligible." His analysis shows that none of the next nine months could qualify. I respect this because Bob (whose career has been with banks and private clients) has been far more accurate than the high-profile punditry. RecessionAlert: Great work on the "Yellen Dashboard" as noted above! Putting it all together, it is time for another look at the "Big Four" indicators monitored by the NBER when defining recessions. As you look at the chart, remember that a recession starts at a business cycle peak. First we need to see a potential peak, and then there must be a significant decline. Doug Short updates this regularly, providing the best concurrent evidence on the economy: The Week Ahead This is a light week for data. The "A List" includes the following:
The "B List" includes:
We will also have some FedSpeak, speeches by assorted foreign leaders and politicians, and some lesser data releases. Tuesday market the "official" start of earnings season with the Alcoa report. In recent years that has been less of a bellwether, so I expect the earnings story to start in earnest next week. How to Use the Weekly Data Updates In the WTWA series I try to share what I am thinking as I prepare for the coming week. I write each post as if I were speaking directly to one of my clients. Each client is different, so I have five different programs ranging from very conservative bond ladders to very aggressive trading programs. It is not a "one size fits all" approach. To get the maximum benefit from my updates you need to have a self-assessment of your objectives. Are you most interested in preserving wealth? Or like most of us, do you still need to create wealth? How much risk is right for your temperament and circumstances? My weekly insights often suggest a different course of action depending upon your objectives and time frames. They also accurately describe what I am doing in the programs I manage. Insight for Traders Felix has shifted into neutral leading us to sell stock positions as more ETFs were sent to the penalty box. This is not a bearish sign, but an indication of extreme uncertainty. By Thursday Felix was completely out of stocks and was 1/3 invested in bonds (via TLT). Those who want to follow Felix more closely can tune it at Scutify.com, where he makes a daily appearance. Compare this with Charles Kirk's outlook, summarized above. Insight for Investors I review the themes here each week and refresh when needed. For investors, as we would expect, the key ideas may stay on the list longer than the updates for traders. The current "actionable investment advice" is summarized here. This is still an important time for long-term investors. We all know that market corrections of 15% or so occur regularly without any special provocation. Recent years have been the exception. Over the last several weeks I have emphasized the need to maintain perspective, using market declines to add to positions. It helps if you have been actively rebalancing your portfolio and trimming winners. Then you have some cash. Some readers have asked me to write more on this topic, so I have placed it on the agenda. For now, let me do a quick summary.
Because we have been selling in our "long stock" program, we have prepared to buy on dips. We are following the rules that I have recommended for you. Barron's notes that "value stocks" are doing fine. In our Enhanced Yield program we hardly noticed Friday's selling. Positions declined by less than 0.2%, despite declining stocks and increased volatility on our short calls. Each week I highlight some of the best advice I see. Here are some highlights. Bonds beat stocks in Q1. Bespoke has the story with some great charts. This was a surprise for many, including me, but I acknowledge all evidence, and we will continue to monitor this story. I expect the bond to stock rotation to continue. Morgan Housel has thoughtful comments about expectations and volatility. He writes as follows:
I have frequently written that no one can time the smaller fluctuations. Those who claim success have a standing bearish prediction, claiming success when it works but ignoring years like 2013. I recommend that investors accept the moderate declines as a cost of doing business and try to avoid the bigger moves by using the indicators I report each week. This combination would have caught all of the major declines. Eric Parnell highlights some risks for those over-emphasizing the dividend growth stocks. Investors perceive an extra measure of safety from dividends and the group has performed well. It is a part of the quest for yield that I have documented, and it has become a crowded trade. It is fine to have a long-term focus on investing, but you should still look for value. Here is one of Eric's charts: Robert Shiller suggests that most people would benefit from using an investment advisor. (See the WSJ article). Most people misquote and misuse Prof. Shiller by concluding that they should currently be out of the stock market because of his CAPE ratio. In fact, he personally holds an aggressive stock position (for his age) and has consistently recommended that others should hold significant stock positions. He notes that most people do not have the training to pick stocks. To this advice, I add that most people do not have the discipline to buy and sell at the right times. Every week I hear about people who bailed out of the market in 2009 and never got back in. You can be a do it yourselfer, but you need to ignore most of the pundits, popular web sites that promote fear, and focus on hard data. If you are missing the stock rally, you have plenty of company. This is one of the problems where we can help. It is possible to get reasonable returns while controlling risk. Check out our recent recommendations in our new investor resource page -- a starting point for the long-term investor. (Comments and suggestions welcome. I am trying to be helpful and I love and use feedback). And a special thought (and chart) for young investors……from Sam Ro of Business Insider: Study the effect of saving early and consistently! Final Thought There are three important themes.
|
China’s Tottering Towers Of Debt: The Punch Bowl Is Empty And The Party’s Winding Down
by By Sara Hsu
| China is coming under close scrutiny these days, as the leadership scurries to find new sources of economic growth and control its debt. Some analysts have reassured China watchers that the Chinese government can simply write off its bad debt, at least within the major banks, and pass it on to the asset management companies that handle that resale of distressed debt (or have it later purchased by the Ministry of Finance). Others have warned that some of the debt is serious, such as that incurred by local government financing vehicles, and are dubious about the sustainability of these entities. [ZH: As we have noted before, the dats is ugly... From November 2012, The Chinese Credit Bubble - Full Frontal:
And from November 2013, "How China's Stunning $15 Trillion In New Liquidity Blew Bernanke's QE Out Of The Water"
It seems people are starting to listen, and not a moment too soon: as of December 31, China's corporate debt just hit a record $12 trillion. From Reuters:
And then there was the worst capital misallocation in history:
Of course, there is also this:
To worry or unwind? How much debt can China really absorb? The first step in answering this would be to examine what types of debt has gone bad in China and what is likely to continue to sour, as well as how these products have been dealt with. There are three general categories of bad debt that have been bailed out in recent years (there is other bad debt that has not been bailed out): bank loans, trust loans, and loans from smaller sectors such as informal finance and credit guarantee companies. Problems with trust loans and loans from smaller sectors have generally been handled by local governments, while bank loans have been bailed out via asset management companies funded through the Ministry of Finance. Trust loans bailed out by local governments have involved sums in the low billions of RMB, while non-performing bank loans amounted to about 1.5 trillion RMB between 2011 and 2013. The second step is to consider how well the central and local governments can cope with a potential increase in bad debt. While local governments are overly indebted, as revealed by a recent report by the National Audit Office, and have experienced fiscal shortfalls for some time, the central government has maintained relatively low deficits, even coming in under the projected deficit in 2013. The way in which the central government deals with non-performing loans is easy on the fiscal budget as long as the debt can be recovered; the worst impact of this process is that it may very lightly constrain lending, as non-performing loans are taken off books and bonds are issued and purchased by banks, changing the nature of capital held on the books. In reality, however, much of the distressed debt is not recovered, and in the past has been purchased by the Ministry of Finance. Both central and local governments, then, face issues with bailing out bad loans either directly or indirectly. The third question we ask is whether the scale of bad debt will grow sufficiently to threaten the financial health of the central and local governments. For local governments, the question is moot. Their health is already threatened by a serious lack of revenue. This can only be addressed by increasing revenue, perhaps land revenue or an increase in revenue redistribution from the central government. As it stands, it seems that the fallout from trust bailouts has been relatively low and may turn out to be less onerous on local governments than it has been on the psyche of financial analysts, but if the trust debt increases and bailouts do rise, local governments will suffer, as they have little capacity to withstand a further accumulation of debt. The central government can bear a small increase in bad debt, but as long as the deficit is kept in check, bailouts will replace policies that spur much-needed growth, trading future prosperity for past profligacy. The recent 3-year non-performing loan amount of just less than 1.5 trillion RMB (about 500 billion per year and growing) seems like a tidy sum compared to fiscal expenditures of 7 trillion RMB (in 2013). With mounting non-performing loans and declining revenue in the short run, the gap between these numbers will only narrow. Although the government can pay down the debt later, postponing the bailout, many new nonperforming loans would present a challenge to officials as to how to classify, recover, and ultimately relieve the financial system of this burden. These numbers tell us that it does not appear that China can bear a very large increase in debt, and that the idea that the government can simply “bail out the financial sector” is erroneous, or at least, a stretch. China does not have the luxury of the United States, which can spend excessively because foreign countries continue to buy U.S. government debt (as the dollar is the world reserve currency). If the leadership attempts to spend down its large cache of dollar reserves, it will lose control of its currency, as a larger supply of U.S. dollars relative to the Chinese RMB would depreciate the currency unless sterilized. The only remaining option is the least savory: the Chinese government must control its debt, and this includes reducing overindulgence within the real economy. It seems that the punch bowl is empty already and the party is winding down. Now the question is, who will clean up the mess? |


The Lions in the Grass, Revisited
By John Mauldin
| The Lion in the Grass “In the economic sphere an act, a habit, an institution, a law produces not only one effect, but a series of effects. Of these effects, the first alone is immediate; it appears simultaneously with its cause; it is seen. The other effects emerge only subsequently; they are not seen; we are fortunate if we foresee them. “There is only one difference between a bad economist and a good one: the bad economist confines himself to the visible effect; the good economist takes into account both the effect that can be seen and those effects that must be foreseen. “Yet this difference is tremendous; for it almost always happens that when the immediate consequence is favorable, the later consequences are disastrous, and vice versa. Whence it follows that the bad economist pursues a small present good that will be followed by a great evil to come, while the good economist pursues a great good to come, at the risk of a small present evil.” – From an 1850 essay by Frédéric Bastiat, “That Which Is Seen and That Which Is Unseen” I’ve come to South Africa a little bit ahead of my speaking tour next week to spend a few days “on safari.” Which is another way to say that I am comfortably ensconced in a game lodge next to Kruger Park, relaxing and trying to get some time to think. We’ve been reasonably lucky on the game runs: besides the usual lions, rhinoceri, water buffalo, etc., we’ve seen both cheetah and leopard, two animals that avoided my vicinity on every other trip to Africa. I’m here at the end of the rainy season, so everything is lush and green, and you have to get a little lucky to find the animals in the dense bush. In several moments here, I was reminded of an essay I wrote two years ago called “The Lion in the Grass.” So I went back and read it and decided to update it fairly extensively in order to talk about the hidden lions we don’t see today that could catch us unawares tomorrow. Just like the African bush I am surveying at this moment, the economic landscape out there could harbor some serious but still unseen problems. I have been captivated by the concept of the seen and the unseen in economics since I was first introduced to the idea. It is a seminal part of my understanding of economics, at least the small part I do grasp. It was introduced by Frédéric Bastiat, a French classical liberal theorist, political economist, and member of the French assembly. He was notable for developing the important economic concept of opportunity cost. He was a strong influence on von Mises, Murray Rothbard, Henry Hazlitt, and even my friend Ron Paul. (I will have to ask Rand about his familiarity with the Frenchman the next time I see him.) Bastiat was a strong proponent of limited government and free trade, but he also advocated that subsidies (read stimulus?) should be available for those in need. “[F]or urgent cases, the State should set aside some resources to assist certain unfortunate people, to help them adjust to changing conditions.” Today we explore a few things we can see and then try to foresee a few things that are not quite so obvious. The simple premise is that it is not the lions we can see lounging in plain view that are the most insidious threat, but rather that in trying to avoid those we may stumble upon lions hidden in the grass. But first, I really want to urge you to consider joining me in San Diego May 13-16 for my Strategic Investment Conference. We are continuing to fill out the strongest list of speakers we’ve ever had in our 11 years at this. My good friends George Gilder, Stephen Moore of the Wall Street Journal, and Neil Howe (who wrote The Fourth Turning) have all agreed to come and join Niall Ferguson, Newt Gingrich, Kyle Bass, David Rosenberg, and a dozen other A-list speakers from around the world. You can see who else will be there by clicking on the link above or here. And I’m especially honored and pleased to announce that Vice Admiral Robert S. Harward, Jr., has agreed to join us on Wednesday night as a special keynote speaker. The three-star admiral (just recently retired) is a Navy SEAL and former Deputy Commander of the United States Central Command. In addition to his numerous other positions and awards, he also held the title of “Bull Frog” from 2011 until 2013 (longest-serving SEAL on active duty). This is simply the finest economic and investment conference anywhere in the country. Don’t procrastinate; make your plans to come and register now. When I was discussing this concept with Rob Arnott (of Research Affiliates and the creator of Fundamental Indexes) in Tuscany a few years ago, he mentioned the following photo, which he took on the savannah in Tanzania. I think it’s a perfect way to start out our discussion of the lions in the grass.
Going back to Bastiat, let’s look at that first sentence: In the economic sphere an act, a habit, an institution, a law produces not only one effect, but a series of effects. Of these effects, the first alone is immediate; it appears simultaneously with its cause; it is seen. The other effects emerge only subsequently; they are not seen; we are fortunate if we foresee them. It is natural to focus on the apparent dangers in front of us. That is part of our evolutionary heritage from the time when humans were first dodging lions and chasing antelopes on the very African savannah in Rob’s picture. But we soon learned that, if we were to survive, it wasn’t enough to dodge the lions we could see. It is the hidden lions that may spring upon us suddenly and take an arm or a leg. Below I have once again reproduced Rob’s picture. Even when I knew there was a hidden lion, I couldn’t find it. But after it was pointed out to me, it is now the first thing I see. And there is a direct analogy there, to both economics and investing. So, before you go to the next page, I suggest you go back and look one more time to see if you can spot the hidden lion. Just for fun, you know. I showed this to a friend of mine who is a hunter, and he found it almost immediately. But then he has taught himself over the years to look for hidden game. And as Bastiat noted, it is the skilled economist who looks for the effects that are hidden, the surprises that are unseen. It should be a habit to look at the potential second- and third-order consequences of what we can see happening before our eyes. That way, we not only avoid the hidden lions, we also turn what would hunt us and do us harm into the hunted. Sometimes, the dangers themselves can be turned into a very nice trophy indeed – if you can act in time. As I noted, that previously invisible lion is now the first thing I see. And that is the way with economic lions in the grass. Once someone points one out, it’s obvious, so obvious that we soon convince ourselves that we would have seen the lion without help. How many people told you they “knew” all along that subprime debt was going to end in tears? Or that the housing market was a bubble? Or that we would be plunged into the Great Recession? I remember that in the fall of 2006 I was beginning to talk about the probability of a recession, in this letter, in speeches, and in numerous media interviews. (There is one such episode still up on YouTube.) I was told I was ignoring what the market was telling us, and indeed the market proceeded to go up for another six months or so. Being early is lonely. Me and Nouriel. J Today there are a lot of people who tell us they knew there was a recession coming all along. In fact, the farther we get from 2006, the greater the number of people who remember making that call. It now seems I had no reason to feel so lonely out there on that limb, scanning the tall grass of the savannah. In retrospect, it seems that limb was rather crowded. So, with that in mind, let me show you where the other lion is. Then go back and look at the first picture. After a few times you will see the hidden lion almost before you see the obvious ones.
I should note that a lion in the grass is different from a black swan. A black swan is a random event, something which takes us all by surprise. Economic black swans are actually quite rare – 9/11 was a true black swan. Other than Nostradamus some 500 years ago, who saw it coming? The last recession and the credit crisis were not true black swans. There were those who saw it all coming, but few paid attention. They were dancing right along with Chuck Prince to the rousing music of a bull market and swelling profits. As we know now, a few people saw the subprime crisis coming and made huge fortunes. Sadly, pulling that off generally required one to risk a small fortune to play in that game. So while I talk about the lions hidden in the grass, remember that if you can figure out how to play it, there can be large profits betting on that which is unseen by the markets. Now, let’s look at a few obvious lions and then see if we can spot a few hidden lions lurking nearby. By some miracle, Mario Draghi and his team at the European Central Bank (ECB) continue to get from their communication tools what most central banks have to take by force. Widespread complacency has washed over the region in the months and quarters since July 2012, when Mr. Draghi introduced the Outright Monetary Transactions (OMT) facility and adamantly promised to do “whatever it takes” to preserve the euro system. As a result, government borrowing costs are converging back to pre-crisis levels even as falling inflation brings the next debt crisis forward … and markets are clearly still responding to the ECB’s increasingly hollow commitments. Without changing the ECB’s main policy rate at this week’s monetary policy meeting, Mr. Draghi once again attempted to talk his way to a policy outcome by suggesting that he has the broad-based support to authorize quantitative easing, if and when it is needed. It will be needed – and maybe soon. As I wrote late last year, European banks are in terrible shape compared to US banks. We think of German banks as the epitome of sobriety, but they have been on a lending binge to creditors who now appear to be in financial trouble; and with 30- or 40-1 leverage, they could easily see their capital fall below zero. Despite modest bank deleveraging across the Eurozone since early 2012…
… public and non-bank private debt burdens have not improved:
Low inflation is also seriously disrupting government debt trajectories. The analysis below from Bank of America Merrill Lynch shows how low inflation, near 0.5%, raises debt trajectories in France and Italy that would be a lot lower under a normal, 2%, inflation scenario. As the charts show, persistent “lowflation” for several years could add another 10% to 15% to the public debt-to-GDP ratio in each country … even if rates stay where they are today.
In addition to unsustainable debt loads and steeper debt trajectories, debtor countries continue to run relatively large fiscal deficits. Just look at Spain, France, the Netherlands, and Italy:
While this toxic combination bluntly confirms higher default risk in countries like France, Italy, and Greece relative to Germany, risk premiums over German bunds have collapsed in the quarters since Draghi’s July 2012 statement. The bond market clearly does not see any risk in sovereign debt. As you can see in the chart below, government borrowing costs across the Eurozone have converged to pre-crisis levels without the ECB’s buying a single bond. (In fact, the ECB has let its balance sheet shrink dramatically over that time.)
Even Greek rates are back to pre-2010 levels:
Both France and Italy are getting close to the point at which the markets will begin to question their ability and willingness to deal with their deficits. Without serious action by the ECB, this situation has the potential to become quite unstable very quickly. But the lack of effort by France, at least by the Hollande government so far in its first term, is clearly taxing the patience of the Germans. They recently signaled willingness to allow the ECB to begin to come up with its own form of quantitative easing; but without French cooperation on its deficit, it is difficult to imagine the Germans staying as patient as they have been. The bond market is clearly not paying attention to the nuances of how defaults happen. Greece’s hard-won primary budget surplus may actually raise the odds of a formal default. According to Benn Steil and Dinah Walker at the Council on Foreign Relations, The Greek government has far less incentive to pay, and far more negotiating leverage with, its creditors once it no longer needs to borrow from them to keep the country running…. This makes it more likely, rather than less, that Greece will default sometime next year. As [the graph below illustrates], countries that have been in similar positions have done precisely this – defaulted just as their primary balance turned positive.
Here we may catch sight of a lion’s face peering out from the tall grass – not just the long anticipated possibility of a Greek default but the roaring return of default risk in Eurozone sovereign spreads. That lion could pounce this year if startled by Greece, or it could lie in wait for a distinctively French BANG! moment … but it is only a matter of time, as long as highly indebted governments continue on their current trajectories. My young partner and protégé, Worth Wray, wrote about the nasty prospects for a Chinese slowdown in Thoughts from the Frontline just a couple weeks ago; and he pointed to a series of signs that may eventually reveal the most dangerous of big cats hiding in our global economic grasslands. I’ll let you go back and read his research for yourself, but the main ideas are powerful: China’s private-sector debt is going parabolic…
… and the Middle Kingdom’s corporate debt is now the highest in the world.
Moreover, the Chinese economy is employing that credit very inefficiently, taking on more and more debt for less and less growth.
History suggests that China’s Minsky Moment is approaching quickly, since corporate debt has topped 150% and total debt is over 210%. Investors around the world should prepare for the inevitable demand shocks and falloff in global growth … regardless of the specific outcome. The Chinese government may have the assets to backstop a truly horrific crisis and maintain slow growth in the 2-3% range, but history suggests that China could land very hard. Over the last fifty years, every investment boom coupled with excessive credit growth has ended in a hard landing, from the Latin American debt crisis of the 1980s, to Japan in 1989, East Asia in 1997, and the United States during both the late 1990s internet bubble and the mid-2000s housing bubble. The lesson is always the same, and it is hard to avoid. Economic miracles are almost always too good to be true. Broad-based, debt-fueled overinvestment (misallocation of capital) may appear to kick economic growth into overdrive for a while; but eventually disappointing returns and the consequent selling lead to investment losses, defaults, and banking panics. And in cases where foreign capital seeking strong growth in already highly valued assets drives the investment boom, the miracle often ends with capital flight and currency collapse. Worth and I talk about China constantly and always reach the same conclusion. There is no way to really know what is happening there today, much less what will happen tomorrow. The primary data is flawed at best, manipulated at worst, and riddled with inconsistencies when we compare official data to more concrete measures of economic activity. Since we published “China’s Minsky Moment?” two weeks ago, the official data flow – which shows admittedly soft but fundamentally sound production – continues to conflict with real-world indicators, which reveal some alarming declines in production, prices, and demand. For example, the official manufacturing Purchasing Manager’s Index (PMI) for March 2014 indicates that manufacturing expanded, while the more objective HSBC MarkIt PMI suggests an alarming contraction in manufacturing activity that is consistent with a rough landing.
With such an ambiguous picture, we cannot know for sure whether Chinese production is moving ahead or falling behind… but a Kookaburra in the regional economic coal mine is calling at the top of its lungs. The recent collapse in Australian new export orders and moderate contraction in Australian production could point toward a real man-eater lurking in the Chinese bamboo (now that’s what I call some real tall grass!).
Before the credit crisis, market makers like Bear Stearns, Goldman Sachs, Merrill Lynch, Morgan Stanley, and Bank of America created a huge amount of the overall liquidity in major markets by consistently taking “the other side” of trades. If the markets were selling, market makers bought, and vice versa. In the wake of 2008, the big market makers either went out of business, merged, and/or were forced to operate at much lower levels of leverage. The net effect is far less trading volume from market makers and other forms of “real money,” to the point that high-frequency trading and ETFs accounted for about 66% of all trading volume in 2010. While that number has fallen to about 50% today, equity mutual fund flows suggest that higher trading volume from smaller investors, not the resurrection of market makers, is responsible for the shift. In fact, the following chart from Credit Suisse suggests that the average daily trading volume from “real money” fell by more than half from 2008 to 2012, as high-frequency trading advanced. I do suspect that “real money” volume is rising today with the rotation that is underway into an overvalued, overbought, and overbullish market (but let’s save that for our conclusion).
Understanding how the structure of market participants has changed, let's think about the effect of there being less market-making volume to balance against high-frequency trading and the retail/institutional herd. On May 6, 2010, the markets sold off for most of the day, and market makers expanded their volume as the media ran all-day coverage of a small riot in Greece. But (and this is critical), market makers who can no longer buy at 40x leverage will carry only so much inventory overnight. At some point market makers must stop buying ... and they did when a large sell order came into the market toward the end of the day on May 6. The market makers stepped back instead of providing liquidity, precipitating a sharp drop in prices. Then many of the HFTs shut their systems down, seeing an irregular trading pattern and fearing another “Quant Crisis” like the one in October 2007. Liquidity dried up in a matter of minutes, and the market went into free fall … triggering stop losses and emotional selling from the general public. (As they saw the market collapse and the rioting in Greece, people may have thought, “Something big just happened and I am late... sell everything!”). Without market makers to provide volume, an orderly sell-off became a chaotic collapse. Now, with market-maker volume way down, a similar situation could develop again; and once again the general public will rush to sell if liquidity evaporates. We should really think about this dynamic, because the next correction may look more like the stock market crashes of 1929 or 1987 as opposed to the more gradual "cascading crash" we all experienced in 2008. With that in mind, investors will do well to pay attention to the ever-changing structural makeup of the markets before blindly jumping in. Just because US stock markets – along with a lot of the major markets around the world – have found new highs since 2008 doesn’t mean they have healed structurally. It doesn’t mean they are stable. And with long-term valuations at historic levels, both on an absolute basis and relative to the rest of the world, US equity markets are both unstable AND overpriced. The inevitable correction that is coming to US markets could be a catalyst for a downturn in the broader economy, and without much of a warning. It could be another lion, prowling through fiber-optic cables, data feeds, and stock exchange servers. I continue to believe that high-frequency trading should be reined in. It is creating the illusion of liquidity, which can dry up in a heartbeat while at the same time sucking billions of dollars from the trading of individuals and institutions.
I’m not trying to stop computerized trading, but if the bid or offer were required to last for at least half a second, I think the problem would be mostly fixed. It has been said that you can’t consider yourself a real global macro trader until you have lost money shorting Japanese bonds. Nevertheless, Japan is a bug in search of a windshield, with a debt-to-GDP of almost 230% (and growing by 8-10% a year). The Japanese savings rate (see chart below courtesy of Kyle Bass and team at Hayman Advisors) has steadily declined from its high of nearly 20% in the early ’80s and will soon go negative. At that point the thought is that Japan will need to seek out foreign investor to buy its bonds. And who will buy a Japanese bond at 1% for ten years? Yet, if rates only rise by 2%, then Japan would be spending almost 80% of tax revenues on just the interest on its bonds. I would submit that this is not a workable business model.
So traders keep shorting Japanese bonds (JGBs) … and they keep losing money. But what if Japanese rates never rise? How could that be, you ask? Given that Japan would collapse if interest rates were to rise, it may be that interest rates will not be allowed to rise. The Bank of Japan will crank up the printing press for their own version of Operation Twist, but on a scale that will make the other central bankers of the world jealous. But if Japanese bonds don’t revalue (on an internal basis), the consequence is that the Japanese yen will go seriously south – 125 to the dollar? 150? 200? Do I hear 250? This week Japan increased its consumption tax rather seriously. That is a deflationary hit to their economy and one they cannot easily withstand. But to me this move is part and parcel of their overall plan to get out of the current crisis. They are raising taxes in an effort to increase government revenue with the hope of being able to balance their budget. They will offset the negative economic effects with continual and increasingly massive injections of quantitative easing. I expect another round to be announced relatively soon. This will bring howls of protest from Japan’s neighbors and will certainly raise eyebrows at the next gathering of the world’s major central bankers. At what point will you be able to buy a Lexus for less than you can buy a Kia? Think that will make Korea happy? Or any of Japan’s Asian neighbors? Think the Japanese care? They will continue to churn out quality products made with robots that will compete very favorably with those of any industrial country. Japanese equities will soar in such an environment (in terms of a depreciating yen), which makes buying cutting-edge Japanese stocks and shorting the yen an interesting trade. But that is the lion we can see. The lion we are missing is the probability that such a development will trigger a massive currency war, which will be far more significant and costly than anything we have seen in our lifetimes, as I described in my latest book, Code Red. Which brings me to a recent interview my team conducted about the effects of the Fed’s actions. It includes segments from my friends and colleagues Grant Williams, Louis Gave, and David Hay. None of us can predict exactly what the Fed is going do next, or the aftermath of their actions (although we certainly try). But regardless of what comes next, we can prepare ourselves … and that’s the real point of today’s letter and this video. South Africa, Amsterdam, Brussels, Geneva, and San Diego I’m finishing this letter on a beautiful morning in South Africa near Kruger Park. Sunday I fly to Cape Town, where I will make several presentations and then fly on to Durban for more presentations and then to Johannesburg, all at the behest of my sponsors, Glacier by Sanlam. It will be a very busy four days. I will spend Friday writing up my notes about what I learned on this trip for your regular weekly letter, and then I’ll start the journey back to Dallas. I will be home for a little over two weeks before heading to Europe on another speaking tour. Then I am back home for a few days before hopping over to San Diego for my Strategic Investment Conference, where you really should join me! As my dad would say, “I’ve been to two hog callings and three county fairs, but I never seen anything like this.” I have traveled to a few extremely nice venues over the years, but nothing approaches the level of quality and service – the total experience – that I’ve enjoyed the last few days at the Royal Malewane. The food is simply exquisite, and each night they prepare a feast somewhere under the stars. The attention to detail is amazing in every aspect of this place. It is relatively small, and each villa is set apart for total privacy – except from the monkeys and the occasional elephant that evidently finds the chlorinated water in your personal pool a refreshing treat. I want to thank my Dallas friend Erin Botsford for recommending this place and my South African partner, Prieur du Plessis, for making it happen. It has been a memorable four days and an experience that I am rather inclined to repeat, if I have the opportunity. If you decide to pay the Royal Malewane a visit, tell them John Mauldin sent you. There has been quite a contrast as I have been plowing through two books dealing with the effects of technological change on our future while living the slow rhythms of Africa in a facility that harkens back to a period of time when life was more genteel. It is probably a good thing I am leaving tomorrow, as I might get too used to this. It’s quite the dream for this country boy from Texas. It is time to hit the send button – they’re calling me for my last game run. Have a great week. Your amazed at what life brings me analyst, |


