Monday, July 4, 2011

Monday night has become soybean night

by Agrimoney.com

Monday nights look like being soybean nights.
OK, not this week, with the US independence day holiday causing delays to some official reports.
But for normal weeks, Monday crop health reports from the US Department of Agriculture look like taking on particular importance for soybeans, following data showing that American farmers have sown surprisingly low levels of the oilseed.
If the acres aren't there, it is on good yields that buyers must rely to lift supplies.
Tight supplies
After all, last week's surprise US data on crop sowings and stocks, while unveiling plenty of extra corn, left soybean supplies looking even more snug.
Last week's 1.4m-acre cut to USDA estimates for soybean sowings this spring equates to some 60m bushels less production at an average yield. And, in fact, the loss may be bigger, given that the area lost has been focused in states such as Nebraska, Illinois and Iowa which are among the most productive.
That swamps the boost to supplies from extra soybeans left over from last year's harvest. (US stocks were, as of a month ago, some 23m bushels larger than had been thought.)
Indeed, it is not difficult to get to a stocks-to-use ratio – a key metric for the availability of crop supplies and therefore of their pricing potential – to match the 4.5% or so which represents, in essence, the lowest that the market can get to.
That kind of level has been reached in a number of recent seasons, notably in 1972-73, 2003-04 and 2008-09, kicking off strong rises in prices each time to keep consumption under control.
Every bushel counts
The best hope for buyers this time, now that soybeans have lost the acreage war, would be (bar a blow-up in a major consumer such as China) for the oilseed to win favourable growing conditions.
A one bushel-per-acre rise in yield, after all, would add more than 40m bushels to stocks. And that's equivalent to an inventory rise of more than one-quarter, working through last week's acreage and inventory statistics at face value.
Conversely, of course, a one bushel-per-acre fall signals sharply tighter supplies, which would likely force a big rise in prices to ration demand.
Summer challenge
Which is why condition data will be particularly crucial to soybean prices.
So far, the data is looking OK for buyers, with 65% of the crop rated in "good" or "excellent" condition. But that's no cause for comfort given the length of the growing season still ahead.
The figure was 70% at this time in 2003, only to crumble below 40% in the autumn, when the crop turned in a yield of 33.9 bushels per acre. That is nearly 10 bushels per acre below what is being forecast for 2011.
Expect every percentage point to make a difference in soybean market sentiment this year until whatever is harvested is safely in the silo.

Crude Oil Price Could Double


We have not written anything about the bull market in Crude since November. And that piece was more directed toward Natual Gas, which continues to drift along with a slight upward bias. We are not going to get into the fundamentals that are driving Crude prices higher; i.e. peak oil, quantitative easing, tax issues and simply growing energy demand from the emerging economies. This is more of a technical report using the principles of OEW with price and cycle analysis.

Commodities move in 34 year cycles: 13 years up and 21 years down. The reason this occurs has a lot to do with FED policy, the 68 year interest rate cycle and the 34 year currency cycle. The bellwether for this 13 year cycle is Gold, which bottomed in 2001. A search on selected charts or special reports, on this website, will produce some additional information about these cycles.

Typically commodities experience an ABC type bull market. Commodities are mainly driven by supply/demand, while stock markets are mainly driven by economic growth. The only exception to an ABC commodity bull market, that we are aware of, is Gold and Silver. The following chart displays the price action in Crude since the 1998 low at about $11.00. Notice the five Major wave advance from 1998 to 2008: 
$11.00 – $146.00. This completed Primary wave A of this Cycle wave bull market. Next came the collapse in the world’s economy in 2008. Crude dropped, in a matter of months, down to $35.00. This was Primary wave B. The prices quoted are daily closing prices in a continuous contract. Since that 2008 low, Crude has been advancing in another five Major waves. When these five waves conclude, probably around 2014, Crude will have completed its entire bull market in an ABC consisting of three Primary waves.


Recently Crude hit a high of $114 to end Major wave 3. Then sold off sharply down to a June low of $91. This recent low may have ended Major wave 4. It was sufficiently oversold on the weekly RSI, and nearly so on the weekly MACD, (we like to see the MACD touch neutral during major corrections). If the low is indeed in we can now make some fibonacci calculations, which should produce resistance levels, for the rest of the bull market.


First, Primary wave A rose $135: at $118 Primary C = 0.618 times Primary A, then at $170 Primary C equals Primary A. Second, Major wave 1 was $39 and Major wave 3 was $45. At $130 Major wave 5 equals Major wave 1. At $136 Major wave 5 equals Major wave 3. Then at $170 Major wave 5 equals Major wave 1 through 3. This analysis suggests future resistance at the following levels: $118, $130, $136 and then a cluster at $170. Therefore, we expect Crude will end its bull market at $170 on the continuous contract closing price basis. It could shoot up to $180 on an intraday basis, the reason for the potential double.


The above chart displays the daily price action since September 2010. Notice the negative RSI divergences at short term and medium term tops, plus the positive divergences at medium term lows. You can observe this correction was much steeper, and more complex, than Intermediate wave iv in January. Also the decline came right into an important support zone between Intermediate waves iii and iv. Then at the recent low we had a positive divergence between Intermediate wave A (May) and Intermediate wave C (June). This is a classic bottoming pattern in OEW analysis.

Stock Market Elliott Wave Analysis, Bear Rally?


That is the question. Is this a Wave 2 or Wave B or a deeper or much deeper correction, or is this the beginning of a Wave 5 that will take us to new heights. My bottom line position is that this is the beginning of Wave 5 that will take us to a new high. I base this in part on looking at other indices, but will show you both sides of the argument.


The first chart I want to show y'all is the Dow Transportation Average. This index is traditionally considered a leading indicator. The chart is a bit of a dilemma in that it could be read two ways. First you will notice that it is making a long-term double top and second, it has barely reached new highs as it peeks above the old high of 2008. It could still be considered in the resistance zone of the old high, IMO, and another substantial move above its present level will be telling.


So, what does the ES Weekly chart look like? And what scenarios can we anticipate? On this chart, I did something a little different with the GET software. I localized the Elliott count to the beginning of Wave 5. You will notice that at this time frame it is calling for our more Bullish count (Black numbers) where we make one more high. I have as a primary scenario, W4 of W5 completed and a new high our next objective. Note how close ES came to my typical minimum retracement of W3 (38.2% - the red Fib level). As a secondary scenario, I have depicted with the dashed arrows, W4 of W5 not yet completed, but in Wave B of W4. I see the second scenario as a possibility if the double top on the Dow Transportation Average provides resistance and a short-term pullback.


Here is a shorter term view of this scenario and the beginning of W5. This demonstrates the completed W4 (Black). In support of this count is the fact that W3 (purple) has gone beyond the 162% projection of W1. That is the typical maximum projection for a Wave C in a corrective pattern. Therefore, it is safest to regard this as a change in trend with the initiation of an impulsive move which typically are in the direction of the major trend.


Now we will look at the more Bearish scenario. Even with the long-term settings for the Elliott count turned on for the GET software, it counts W5 (the whole wave) of the rally from 6March2009 as complete. You will notice that it is counting the rally ending Friday as Wave B of the countertrend move after a completed impulsive wave. But this isn't just the end of this W5 impulsive wave, it is the end of the entire impulsive rally from 6Mar2009. That means that typically this correction should minimally correct to the beginning of this whole impulsive wave (1002.75) or from 50%-62% of the entire rally from 6Mar2009. Why does the GET software count the Daily data as a completed wave and the Weekly data as just beginning W5? It has to do with the way that the counts are calculated by the software. The software uses an Elliott Oscillator to arrive at its count. Fewer bars will change the histogram of the oscillator. When I want to tweak the counts on the data to agree with my count, I will alter the time interval that is being calculated. That's why you need to know more than the software. The software is great for speeding up analysis, but it isn't the Holy Grail!


What does this scenario look like on a Weekly chart? This is our Sky-is-Falling scenario. The red-dashed arrow is for the end-of-the-world scenario where we go into a double dip recession and make new lows. That scenario is low on my list.


I hope this hasn't been confusing, but I couldn't think of any more simplified way of presenting it. This is a study that is worth going over until you understand it, because it should be useful in days to come. Have a Happy 4th and good luck next week.

See the original article >>

S&P threatens of a Greek Default


While the US is celebrating the 4th of July and the Liberty of the Nation, S&P is threatening of a Greek default. The Trocia roll over plan seems to be flawed, and would cause great headache for the parties involved if it fails. Bloomberg reports;


Europe’s effort to pull Greece back from the brink may be slapped with a default rating by Standard & Poor’s, exposing a critical flaw in the drive to press creditors to assume a share of the cost.

Standard & Poor’s said today a rollover plan serving as the basis for talks between investors and governments would qualify as a distressed exchange and prompt a “selective default” rating. That may leave the European Central Bank unable to accept Greek government debt as collateral, impairing the lifeline it has provided the country’s banks.


“It sends all the officials and banks back to drawing board to think something new,” said Christoph Rieger, head of fixed-income strategy at Commerzbank AG in Frankfurt. “The ECB is saying it won’t accept debt in a default. Someone needs to give in — either Germany or theratings agencies or the ECB. One of three will have to compromise.”


The S&P statement comes less than 48 hours after euro-area finance ministers authorized an 8.7 billion-euro ($12.6 billion) loan payout to Greece by mid-July and said they would aim to complete talks with banks on maintaining their Greek debt holdings within weeks.

The prospect of a default rating adds to policy makers’ concerns that Greek officials can enact the 78 billion euros of austerity measures that lawmakers passed last week as a condition of receiving further aid


If Greece defaults, as thetrader has argued is necessary, we will get the Lehman situation back. The ECB will end up in a severe liquidity crisis as the Greek bonds won’t be accepted as collateral. Further, this would of course spread to the European banks, and we would get a run on the Greek Banks. Let’s see how well designed the Troica roll over plan is. We still argue for Greece to make an Icelandic “liberty” move, drop the Euro and tell the banks, we are not paying other people’s stupidity. Then Greece could start celebrating a day of Liberty, instead of being squeezed by the Banksters.


Don’t forget, Greece’s first tranche of Aid, won’t even last until the end of August.
 
Finally, below is the Statement by the Eurogroup, on the great accomplishment of the Greek rescue, released less than 48 hours ago…..

See the original article >>

Morning markets: dog doesn't bark, to relief of crop markets

by Agrimoney.com

A dog that didn't bark proved a market mover on Monday.
And not the one that was on holiday. US financial markets are closed for the Independence Day celebrations.
Many investors had been bracing for a rise in interest rates in China... which never happened.
In failing to raise rates on Friday, China broke a trend of raising rates every other month since October. (Although there are residual fears that an increase might yet come to pass in a week's time or so.)
And borrowing costs in China are viewed as having a big factor in determing commodity buyers' willingness to splash out in a country with such a huge appetite for raw materials.
Chinese rises
That helped boost sentiment among commodity investors, as did a broadly improved financial market mood.
Tokyo's Nikkei share index crossing 10,000 points for the first time in two months although, in closing up 1.0%, it ended just below.
The dollar strengthened too – a help for raw materials in Asian markets which, being denominated in other currencies, look more competitive when the greenback appreciates.
In China, corn for January rose 0.8% to 2,282 yuan a tonne as of 07:00 GMT (08:00 UK time) on the Dalian, where soybeans for January added 0.7% to 4,433 yuan a tonne.
On the Zhengzhou exchange, cotton for January added 0.8% to 22,535 yuan a tonne.
Overtapping hangover?
In Kuala Lumpur, palm oil exploited the improved sentiment, as well as a positive close for rival vegetable oil soyoil in Chicago on Friday, to add 1.2% to 3,071 ringgit a tonne in Kuala Lumpur, for September delivery.
Crude oil, which has some bearing on commodities such as palm oil used in making biofuels, helped by adding 0.3%, for the West Texas Intermediate variety, to retake the $95-a-barrel mark.
In Tokyo, rubber added 3.8% to 378.00 yen a kilogramme for the benchmark December lot.
"Although supplies are improving after the low production season, the post-winter global supply of natural rubber has not seen a normally expected seasonal rise," Ker Chung Yang, at Phillip Futures in Singapore, said.
"According to Association of Natural Rubber Producing Countries, the post-wintering supply situation could be due to rains, damage due to overtapping of trees to take advantage of abnormally higher prices earlier in the year and ageing trees."

Sowings upgrade fails to quell cotton crop fears

by Agrimoney.com

The threat of high rates of lost acres, to drought, remains a spectre over US cotton production prospects despite the hike by American officials to their forecast for sowings of the fibre.
American farmers planted 13.7m acres with cotton this spring, a five year high, the US Department of Agriculture said on Thursday, lifting its forecast by nearly 1.2m acres.
However, there was no certainty that this increase will end up translating into a rise to the forecast for production too, given the extent of the drought challenges facing the crop, analysts said.
The USDA earlier in June estimated the abandonment rate at nearly 19%, among the highest in recent history. Officials estimate the proportion of the US cotton crop in "good" or "excellent" condition at 27%, compared with 62% a year ago.
'Conditions remain severe'
"With 1.16m more acres, a revision [in production] higher is possible, but due to weather problems resulting in yield reductions and a high abandonment rate, such an upwards adjustment is not a given," Rabobank said.
"Conditions of drought remain severe" in Texas, the main producing state in the US, the top cotton exporter.
Goldman Sachs analysts said that such fears might support prices of the fibre despite the, ostensibly bearish, sowings upgrade.
"While this large cotton average increase could accelerate the decline in cotton prices that we forecast, we expect that concerns for large abandonment in the US South will limit price downside in the near-term," Goldman said.
Price forecasts
The bank left its forecasts for cotton prices unchanged, at 150 cents a pound in three months' time, declining to 125 cents a pound in a year, for New York's near-term contract.
However, Rabobank said that, despite its reservations over US cotton production, "our view continues to be that prices will correct lower".
New crop cotton for December stood 0.1% higher at 118.75 cents a pound in late deals in New York. The soon-to-expire July contract was 1.1% higher at 161.50 cents a pound.

See the original article >>

Greek Crisis: What Bankers Should Learn from Germany's Weimar Republic


As the bankers queued up to get served their pound of flesh of Sparta, which is all that’s currently on offer, it’s hard not to notice the striking similarities between the Greece of today and Germany's Weimar Republic in 1923.

Germany then also owed billions thanks to a treaty that was made in a French-speaking country along with an offer that couldn’t be refused, back then Versailles, this time Maastricht.

Back then government employees were demanding their wages, unions were on strike, the coffers were empty, and the government of the day chose to inflate away the problem. That is one of the options presented to Greece today--they can leave the Euro, default on the debts, and inflate away the cost of the commitments made by previous governments to unions, pensioners, and government employees.

There are two other alternatives;
  • The first is austerity, although it’s getting harder to do the austerity thing these days, now that it’s considered politically incorrect to shoot at rioters with live ammunition, which wasn’t an issue in 1923.
  • The other way is to sell up the assets of the country; which was an idea the French came up with when they occupied the industrial heartland of Germany in order to convince them to “honor their obligations”.
Outside of the detail that French and German bankers can’t occupy the tourist hot-spots of Greece and kill any protestors who object, there are two problems with collecting proxies for collateral that was never offered.

First the Greek state postal system probably has a negative NPV, and the Acropolis, well I know it would look great as an anchor attraction in a theme park in Düsseldorf, but you can’t be serious!!

The second is that in any case the full resources of the joke which passes for the fragmented European “defense” capability is currently engaged doing, I’m not quite sure what, or for what objective, in Libya. Although, it must be said, Germany elected not to participate in that Charlie Foxtrot…so perhaps they were saving themselves up for a spot of asset-stripping?

Everyone knows the story of hyperinflation in the Weimar Republic. Not so many know how Germany was transformed from basket-case to embark on seven “Golden Years” that lasted until the 1929 US Stock-market Crash.

In the chaos that followed the stock-market crash Hitler saw his chance to seize power; by then Germany was strong enough to go to war against the whole world. To understand how that was done you have to understand the flaw in the New-World-Order financial system.

When Alan Greenspan got interrogated by Congress, just before all the excitement of financial Armageddon was really starting and what seems like many-many years ago; he famously said, “We found a flaw”.

He was talking about a flaw in Econ-101 and the base-assumptions about how high-finance works (as in the stuff you smoke), which provided the base-foundation for “inflation-targeting”, “affordability”, and all the other nonsense that is still endlessly regurgitated by PhD economists.

What he didn’t say was what the flaw was?

Well it’s not a new idea, and it’s not complicated. It’s the same “flaw” that the Merchant of Venice got hammered by, which is that you can’t eat a pound of a man’s flesh, and you can’t cut out that flesh without spilling blood.

That wasn’t a new idea then either, in Islam it says something along the lines that it is dirty to profit from someone else’s misfortune, and that’s not just in the eyes of your fellow man, it’s in the eyes of God too.

Financial Bubbles are all about profiting from someone else’s misfortune, that’s because they are zero-sum. In aggregate no wealth is created; for everyone who wins, someone else must loose; hence the mantra that used to be rolled out as a clever in-joke on Wall Street, “The value of something is what you can sell it for to someone dumber than you”.

The reality was that no one cared so long as there was a good story line, and the legal work on the “Pound of Flesh” clause had been done properly.

As we speak, bankers in Germany and France are lining up in a big long queue to extract their pound of flesh from Greece. And the threat is that if they don’t get it they will trash Greece’s credit score.

And they have every right to do that, both under the Law, and from their perspective, morally, because the core of the belief-system of every atheist is that in a “free market” the law on profiting from other people’s misfortune (or stupidity), is a “Just Law”.

And sure, the behavior (in the past) of the government that racked up those debts was no different from a glazed-eyed drug addict. They lied, they cheated, and when they got the money they blew it buying election-candy and apartments for their mistresses.

Therefore “someone” should be punished. Money was lent, so money should be paid back, with interest; and if not the stupid population which voted that stupid corrupt government into power, in “democratic” elections, should be made to lie down and have pounds of flesh cut out of the part of their chest closest to their hearts, until such a time as they “learn” better.

This is how that works, all the banks in the world operate a cartel to protect each other, so if you borrow money from a moron in Bank A, and you don’t pay it back, then there is a back-to-back agreement with ALL the other banks in the world, that says they won’t lend you any money, regardless of how perfect your collateral is.

So you can’t go to Bank B to get credit collateralized by the virginity of your six-year-old grand-daughter, or something equally valuable. No first you have to pay Bank A, then we talk.
Source: WSJ.com
(added by EconMatters)

If that’s not anti-trust and collusion to make the customers pay more, I don’t know what is? But that’s how the great New-World-Order financial system works, except for one small problem, it doesn’t work.

There’s got to be a better way!

In the case of the Weimar Republic, a new currency was collateralized by land and by other tangible assets. In the case of the contemporary Greece, a step away from the abyss would be to issue new debt, collateralized by tangible assets.

But what assets have they got?

Well, Greece’s biggest industry and major source of foreign exchange is it’s tourism industry, which coincidentally also provides the main conduit that Greeks and foreigners investing in Greece use to avoid paying tax, which is one of the reasons Greece got into the mess in the first place. (See Chart Added by EconMatters)

The way that works is that when you sell a holiday to a German for $2,000 which includes for supply of airport transfers, a nice hotel room with a sea-view, and full board, you “sell” that service and the room to your relative or whatever in Germany for $500 and you cleverly manage to make a small operating loss on your hotel (in Greece), so you don’t pay any tax in Greece.

And you don’t pay much tax in Germany either, because you spend the $1,500 that the Greek tax-man doesn’t know about on the cost of employing your relatives to “market” the holiday in Germany, and then you can slip the nice clean crisp Euro’s back into Greece so that you can live in the style to which you have been accustomed. And it’s not just the Greeks who work that scam, lots of Germans do too.

It’s not hard to stop that. Just impose a tax on hotel rooms, depending on the category, and if the taxes don’t get paid you simply confiscate them and put them into a pool to securitize the debt.

That’s not nice, but someone has to pay taxes, sometime, and a good place to start on that, is to go after the people who can afford to pay them. And for collection, well, you could put all the recently retired civil servants on commission.

See the original article >>

Stock Market New Uptrend ... Higher Highs Ahead


An eventful week as the US market had its biggest upsurge since early July 2010. Economic reports ended the week with a positive bias too: positives outpacing negatives 9 to 6. On the negative side: the monetary base, WLEI, construction spending, consumer sentiment, and consumer confidence all declined.


The weekly jobless claims ticked higher too. On the positive side: excess reserves, PCE prices, Case-Shiller, pending home sales, the Chicago PMI, ISM manufacturing, and auto sales all moved higher. Personal income/spending remained positive. The equity markets gained every day of the week as the SPX/DOW surged 5.50%, and the NDX/NAZ was +6.35%. Asian markets gained 1.6%, Europe rallied 5.2%, the Commodity equity group was +3.8%, and the DJ World index rose 5.1%. Next week will be highlighted by friday’s Payroll report, ISM services and Factory orders.

LONG TERM: bull market

The bull market resumed this week after a multi-week 8.2% correction. Our primary count remained in place, despite several medium term alternative counts gaining in probability as the correction unfolded. We have been counting this bull market as a five Primary wave Cycle wave one, coming off the Supercycle low of March 2009 at SPX 667. The first two Primary waves completed in April 2010 at SPX 1220 and July 2010 at SPX 1011 respectively. The current Primary wave three began at that time. Since Primary wave I divided into five Major waves, (as noted in black on the chart below), we expected Primary wave III to do the same.


The first uptrend from the SPX 1011 Primary II low topped in February at SPX 1344. We labeled that Major wave 1. The correction to SPX 1249 in March we labeled Major wave 2. Major wave 3 should have started at that low. The following uptrend (Mar-May) and downtrend (May-June) was a bit tricky, in that the Techs (NDX/NAZ) completely retraced the entire uptrend, and the Industrials (SPX/DOW) did not. As a result we now have two slightly different counts between these two sectors. This is not unusual. Our primary count is posted on the SPX/DOW charts, since our bellwether index for the US is the DOW. This count suggests the March-May uptrend to SPX 1371 was Intermediate wave one of Major wave 3, and the recent May-June downtrend to SPX 1258 was Intermediate wave two. The current uptrend should then be Intermediate three, of Major 3, of Primary III. The mid-point, in wave structure, of the bull market.

MEDIUM TERM: uptrend

We noted last week the weekly RSI was the most oversold it had been since the bull market began, (see chart above). We also noted about two weeks ago the correction had changed character, in that it had not made a lower low (SPX 1258) after the gap up opening on June 17th. And then it had its biggest rally since the correction began: 41 points to SPX 1299. Most of that rally was retraced by June 23rd when the SPX hit 1263. But it held the SPX 1258 low, started to rally again, and took out the 1299 previous rally high on June 29th. Near week’s end a new uptrend was confirmed, along with a WROC buy signal – the first since early July 2010. These buy signals usually lead an uptrend confirmation, this one was coincident, and multiple signals suggest a very strong uptrend.


On the technical front. Eight of the nine SPX sectors are in confirmed uptrends. They were all in downtrends recently. The NYAD, market breadth, has already made a new bull market high. Copper is uptrending, the VIX is downtrending, Bonds are downtrending, Crude appears to have bottomed, and the USD appears to have topped, (the EUR is already uptrending). Also, seven of the fourteen foreign indices we track are now in confirmed uptrends. They were all in downtrends recently as well.

We are counting this uptrend as a five Minor wave Intermediate wave three. Minor waves 1 and 2 appear to have already completed at SPX 1299 and 1263 respectively. Minor wave 3 is underway now. Since Intermediate wave one ended at SPX 1371, Intermediate wave three has to rally much above that to prevent an Intermediate wave four, (the next downtrend), from overlapping Intermediate wave one. We would expect this uptrend to clear the OEW 1363, 1372 and 1386 pivots and then hit the SPX 1440 pivot before it ends. This would allow for a minor 4% – 5% correction, Intermediate wave four, to occur around September/October.

SHORT TERM

Support for the SPX is at 1313 and then 1303, with resistance at 1363 and then 1372. Short term momentum remains extremely overbought. There is some short term resistance right at the current level: between SPX 1339 and 1345. These levels created resistance at the February uptrend high, the early April high, and the late May high. With short term momentum (RSI) at 94% and the hourly MACD well over 10, a pullback of 10 or more SPX points would help reset these indicators.


Looking a little further out. Minor wave 1 rallied from SPX 1258 to 1299. Minor wave 2 pulled back to SPX 1263. At the OEW 1371 pivot Minor wave 3 would be 2.618 times Minor wave 1. So we could get a small pullback from around current levels, and then a larger pullback around the bull market high for a Minor wave 4. After that Minor wave 5 should take the market to new bull market highs, and up to the OEW 1440 pivot.

As a cautionary note. Should this market pullback to the 1313 pivot, the 1303 pivot, and then overlap SPX 1299, a correction process from the February SPX 1344 high may still be in progress. Best to your trading!

FOREIGN MARKETS

The Asian markets were all higher on the week for a net gain of 1.6%. The Nikkei is in a confirmed uptrend and the other four appear to have bottomed.

The European markets were all substantially higher for a gain of 5.2%. Four of the five indices we track are in confirmed uptrends.

The Commodity equity group were all higher for a net gain of 3.8%. The RTSI is in a confirmed uptrend and the other two appear to have bottomed.

The DJ World index is uptrending and gained 5.1% on the week.

COMMODITIES

Bond prices confirmed a downtrend this week losing 2.3%. The 10YR yields are uptrending from the recent low of 2.85%: currently 3.2%.

Crude (+3.6%) appears to have ended its downtrend within the support range posted on the daily chart. There is a large positive divergence at the recent low. No uptrend confirmation yet.

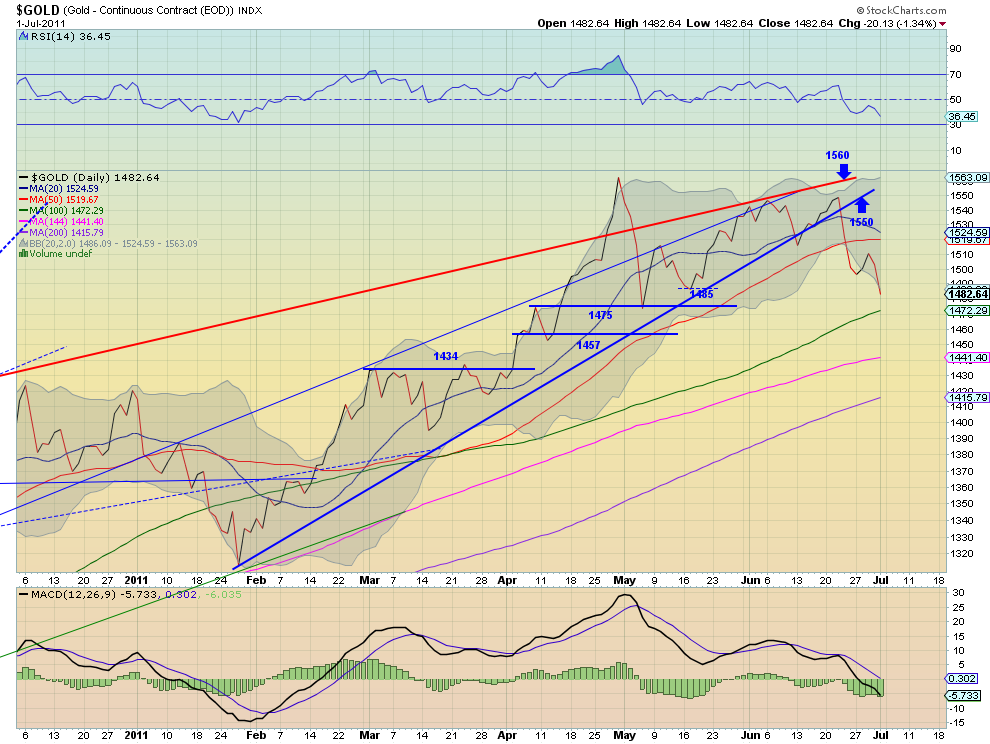
Gold lost 1.2% this week as it continues its correction from the late April high. Support is around the $1450 area.

The USD lost 2.1% on the week and the recent uptrend appears to have topped. The EUR (+2.4%) is already in a confirmed uptrend.

Global Steel Demand Continues to Rise


Massive infrastructure growth in the developing nations and a more modest growth in developed nations promise to push global steel demand by 6.5–7% this year. Lakshmi Mittal, the chief executive of ArcelorMittal recently said that the demand for steel is expected to continue rising in 2011. In 2010, global steel demand rose by 10% from 2009 levels and touched a record high of 1.4 billion tons.

By 2020, over 250 million people in the developing nations are expected to move to urban areas and that would create a huge demand for housing and other infrastructure. Mittal hopes the strong growth curve continues to rise over the next five years and the steel industry reaches pre-financial crisis levels by 2015.

Chairman of the World Steel Economics Committee, Daniel Novegil, said, “2010 saw a steady recovery of steel demand which began in the second half of 2009 driven by stimulus packages globally, the resilience of emerging economies and an overall market recovery. In 2011, we expect to see a further 5.9% growth in world steel demand.”

Developments in China, which is the world’s largest consumer of steel, have been a major driver of this meteoric rise in demand. China’s demand for steel is expected to grow by 5% this year as well as in 2012, and reach 635 million tons in 2012. 

India is another major contributor to the growing steel demand. In 2010, India produced the fifth highest quantity of steel in the world. According to the last World Steel Association (worldsteel) report, India is expected to see the world’s highest growth in steel demand this year, a massive13.3%. In 2014, demand in India is expected to grow by 14.3% and touch 79 million tons per year. However, an important question put forward by an analyst asks, “The question is how much of this demand growth will be met by the local steel mills and how much will be met by imports?” India was a net importer of steel in 2010 and since no significant capacity addition is expected in 2012 either, the country is likely to remain a net importer in 2014 as well. 

Central and South America is another leading steel market and consumption in the region is expected to grow by 6.6% and 8.3% in 2011 and 2012 respectively. Consumption this year is expected to reach almost 49 million tons. 

In the Western world, the US is expected to lead the demand curve with a 13% growth this year. Consumption of steel in the EU is forecast to increase by almost 5% this year. Germany and France are expected to lead the demand growth with countries such as Spain, Portugal, Ireland and Greece following slowly. 

Japan is the world’s largest exporter of steel and business in Japan is almost back at levels before the devastating tsunami and earthquake of March 2011. However, all reports quickly point out that given the current trend of rising prices, the expected growth in the global steel industry may not happen as early or as consistently as expected. 

For example, in China, domestic prices of steel have been falling sharply and the government’s power rationing policy is worsening the situation with steel makers having to reduce production. While Q1 and Q2 of 2010 saw record production figures, Q3 and Q4 are expected to be the exact opposite. Housing projects will continue to demand steel rebar but China is more often than not, short of the product causing further price hikes. 

India too is witnessing a fall in demand because of increasing interest rates, which is affecting demand for houses and automobiles. Further, delays in land acquisition and environment clearances are holding up projects. In fact, the growth of the domestic steel industry is expected to fall from 10% to 8% year-on-year by end September.

See the original article >>

Macro Week in Review/Preview 7/2/11


Last week’s review of the macro market indicators looked to bring more red to Gold and Crude Oil, although likely at a slower pace in Crude. The US Dollar Index was headed to a test with the 3 year trend line while US Treasuries looked to continue to consolidate, but with an upward bias. The Shanghai Composite looked higher if only to retest the weekly breakdown level while Emerging Markets consolidate, with a chance of more downside. Volatility looks to continue to drift higher with a spike a possible signal of a further downside move in the Equity Index ETF’s. Otherwise they look to continue to consolidate but with the SPY and QQQ biased to the downside while the IWM is biased higher. 

The week played out at as the charts foretold for Gold, and Crude did consolidate and move slightly higher. The US Dollar Index hit resistance and bounced lower while US Treasuries broke their consolidation to the downside. The Shanghai Composite consolidated slightly higher but Emerging Markets broke their consolidation higher. The Volatility Index started higher but then drifted lower as the Equity Indexes SPY, IWM and QQQ rocketed higher out of their descending wedges for the week. The same correlations between Treasuries, Equities and the Dollar, but the opposite direction, with the US Dollar being the driver. What does this mean for the coming week? Let’s look at some charts. 

As always you can see details of individual charts and more on my StockTwits feed and on chartly.)

Gold Daily, $GC_F
gold d stocks
Gold Weekly, $GC_F
gold w stocks
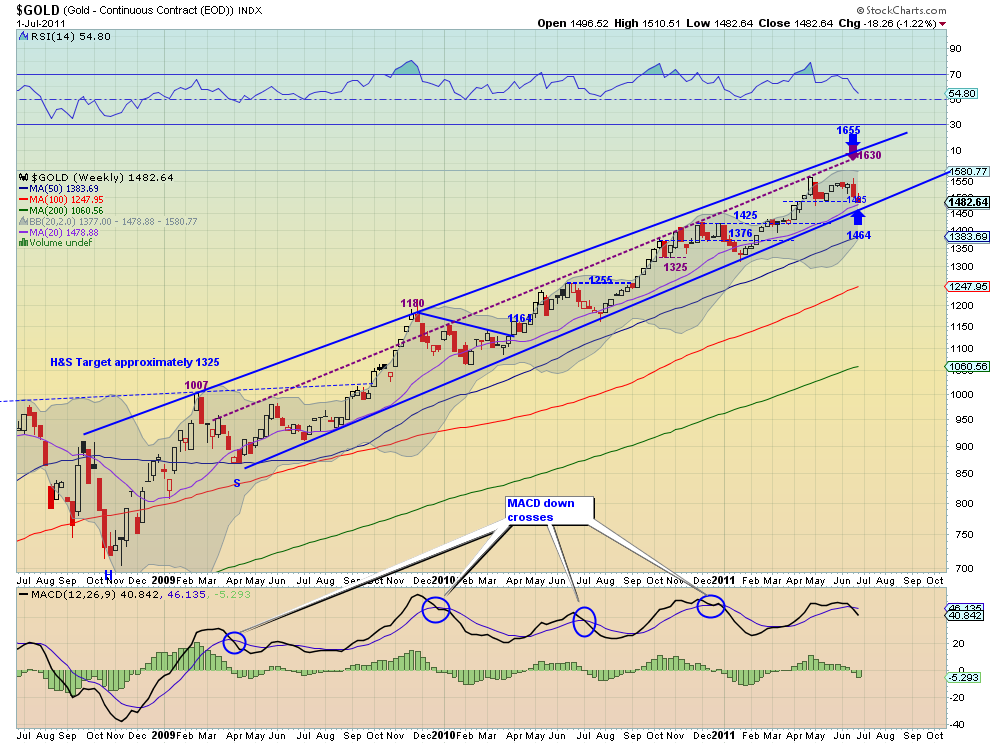
Gold started the week lower, looked like it might consolidate and then plummeted to finish the week. It now sits below support at 1485 on the daily chart with Relative Strength Index (RSI) that is still heading lower and a Moving Average Convergence Divergence (MACD) that is again gaining to the downside. The shorter Simple Moving Averages (SMA), the 20 and 50 day, have rolled lower and the 100 day SMA is just below near the next resistance at 1475. The weekly chart shows that the multi-year uptrend is still in tact with support of the rising channel below at 1464. But the RSI is moving south steeply and the MACD has just crossed negative. Look for more downside to Gold next week and likely a test at the 100 day SMA with a failure there falling to the 144 SMA which has historically been a buy level.

West Texas Intermediate Crude Daily, $CL_F
oild stocks
West Texas Intermediate Crude Weekly, $CL_F
oil w stocks
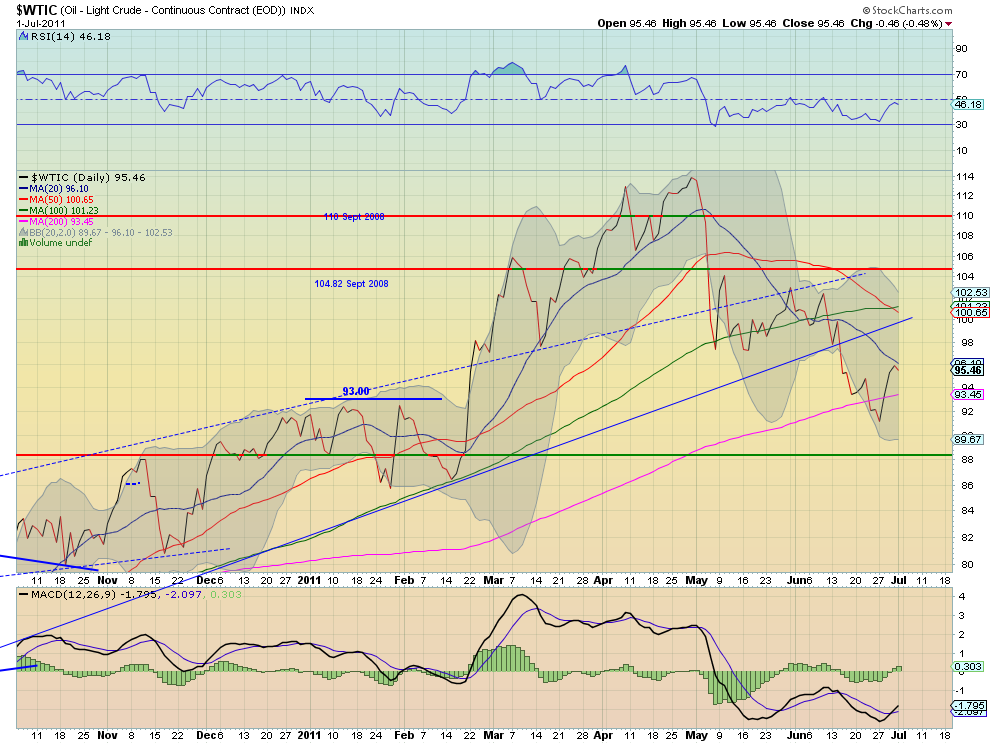
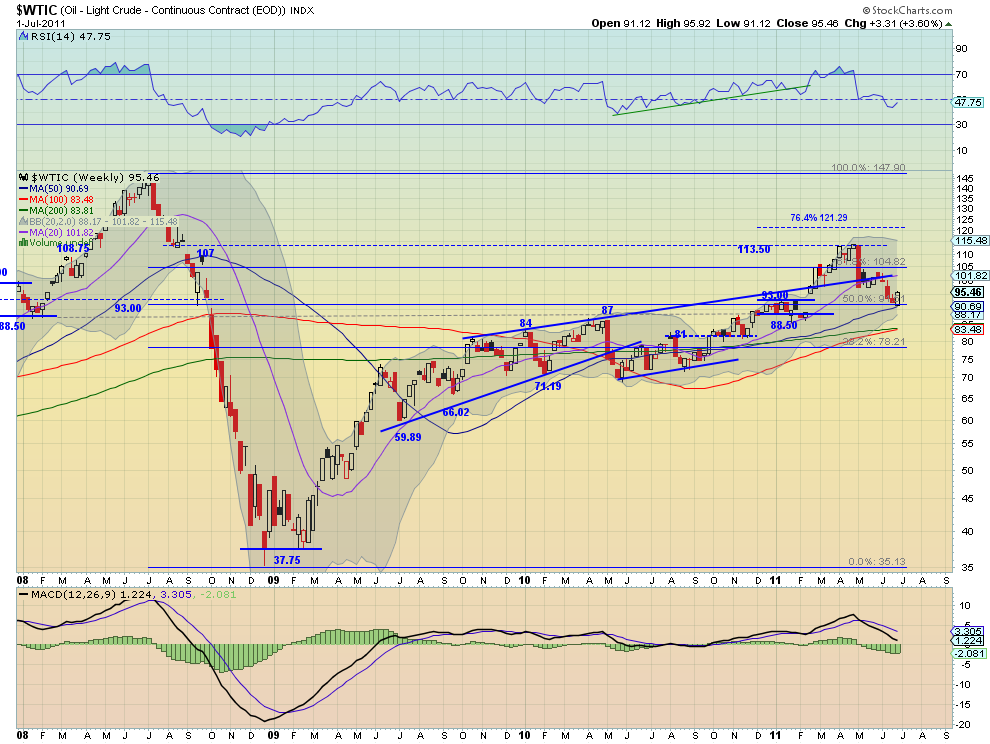
Crude Oil caught a bid in the previous channel between 88.50 and 93 and bounced higher, only to fail at the falling 20 day SMA. The RSI on the daily chart hit the mid line and rejected at the same time, but the MACD having just crossed positive suggests there may still be some upside. The weekly chart shows that the bounce happened near the 91.51 Fibonacci level, midway of the 2008 move lower. The RSI is curling higher and the MACD is leveling. Mixed signals in the short term downtrend. If the move lower Friday continues look for support at 88 and if it proves to be just a consolidation, my bias, then a test of the rising trend line at 102.

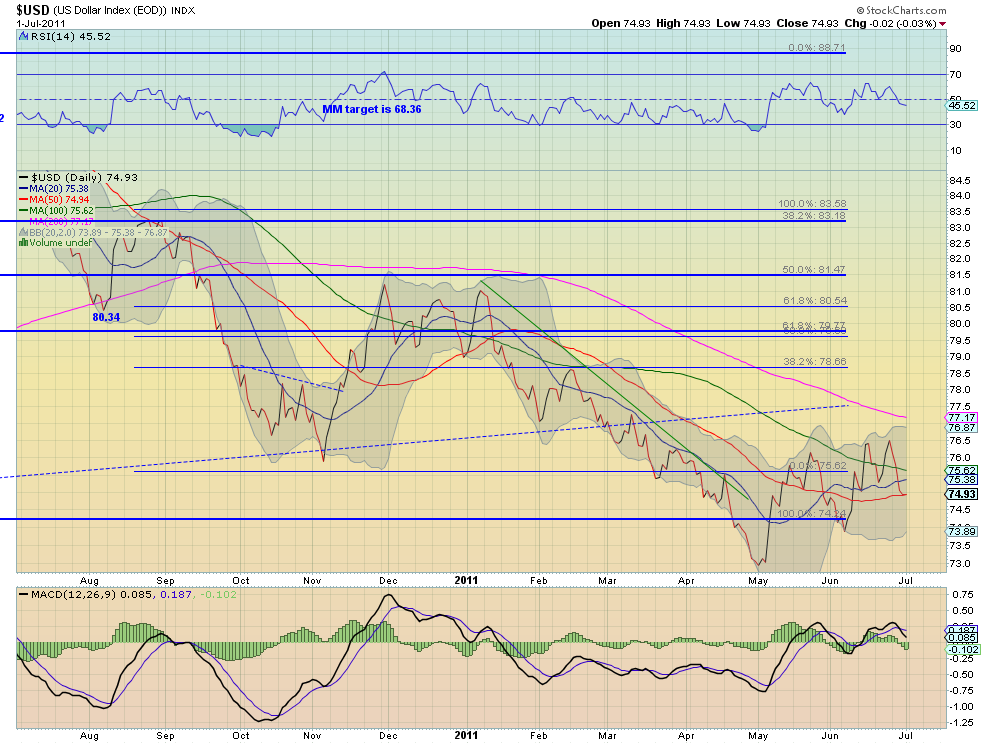
US Dollar Index Daily, $DX_F
usd d stocks
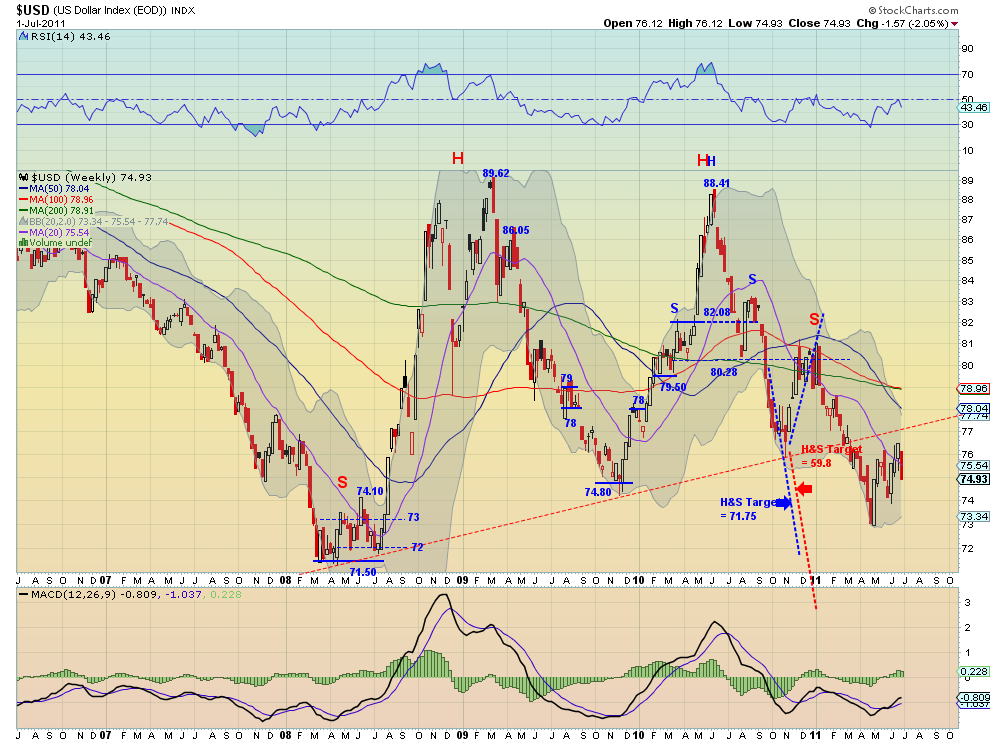
US Dollar Index Weekly, $DX_F
usd w stocks
The US Dollar Index found resistance again at 76.50 and kicked lower. On the daily chart it is building a bear flag with the RSI making a lower low and through the mid line pointing lower. The MACD on that chart is also pointing lower. The weekly chart shows that flag more clearly. It also shows the RSI rejecting off of the mid line and the MACD starting to fade. The bear flag could continue to test the 77.20 trendline break without impacting the long term trend and this still looks likely, unless it breaks below 74. In that case prepare for a test of 73 and the previous low at 71.50.

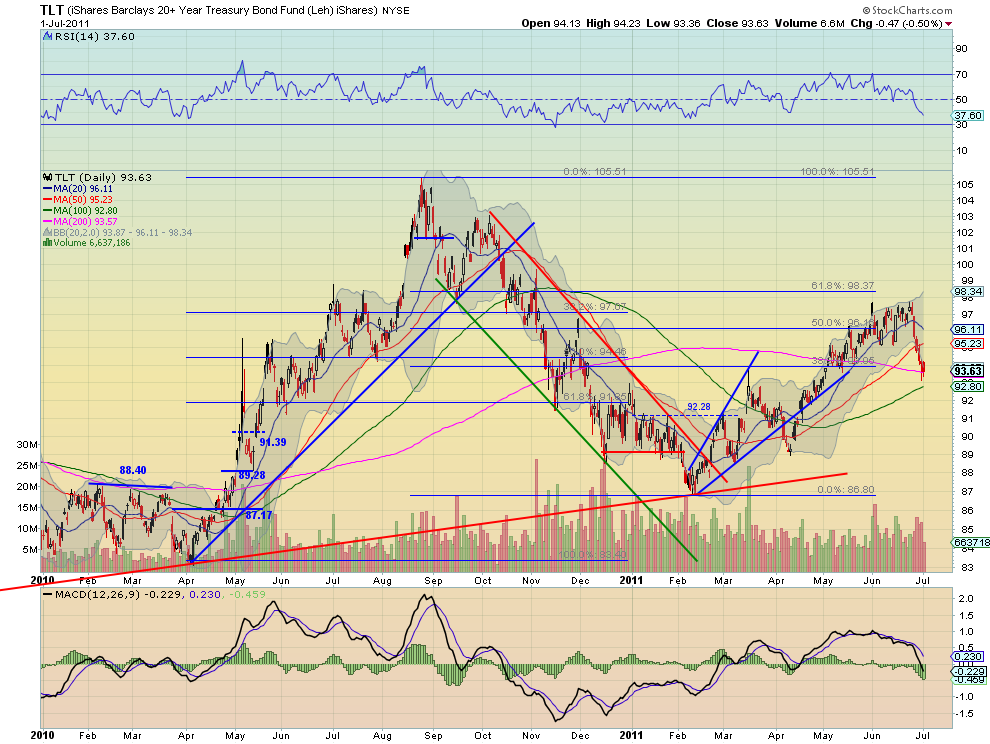
iShares Barclays 20+ Yr Treasury Bond Fund Daily, $TLT
tlt d stocks
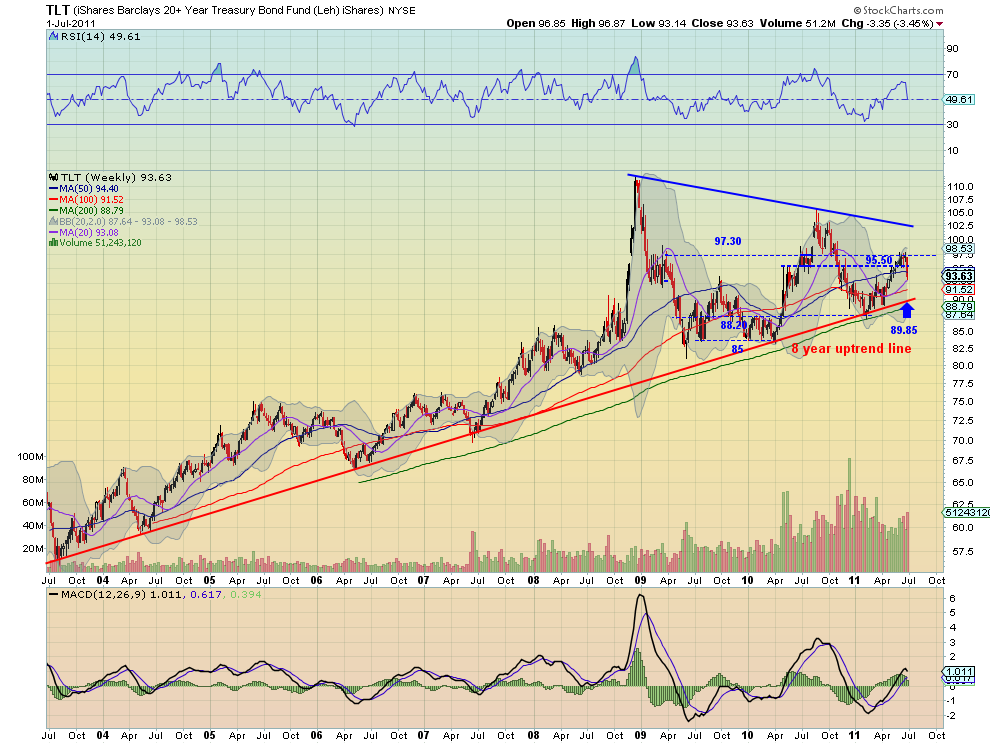
iShares Barclays 20+ Yr Treasury Bond Fund Weekly, $TLT
tlt w stocks
US Treasuries, measured by the ETF TLT, crashed out of the resistance at the 97.30 area and began to build a bear flag at the end of the week on the 200 day SMA. The daily chart shows the RSI and MACD suggesting more downside. The weekly chart shows the rejection area was the middle of the symmetrical triangle formed between the 8 year rising support trendline and the two and a half year falling resistance trend line. With rising volume, a RSI pointing sharply lower and a MACD fading to a negative cross quickly, it looks like more downside. Look for the TLT to continue lower next week with support at 93 and the rising trend line near 90. 

Shanghai Stock Exchange Composite Daily, $SSEC
ssec d stocks
Shanghai Stock Exchange Composite Weekly, $SSEC
ssec stocks
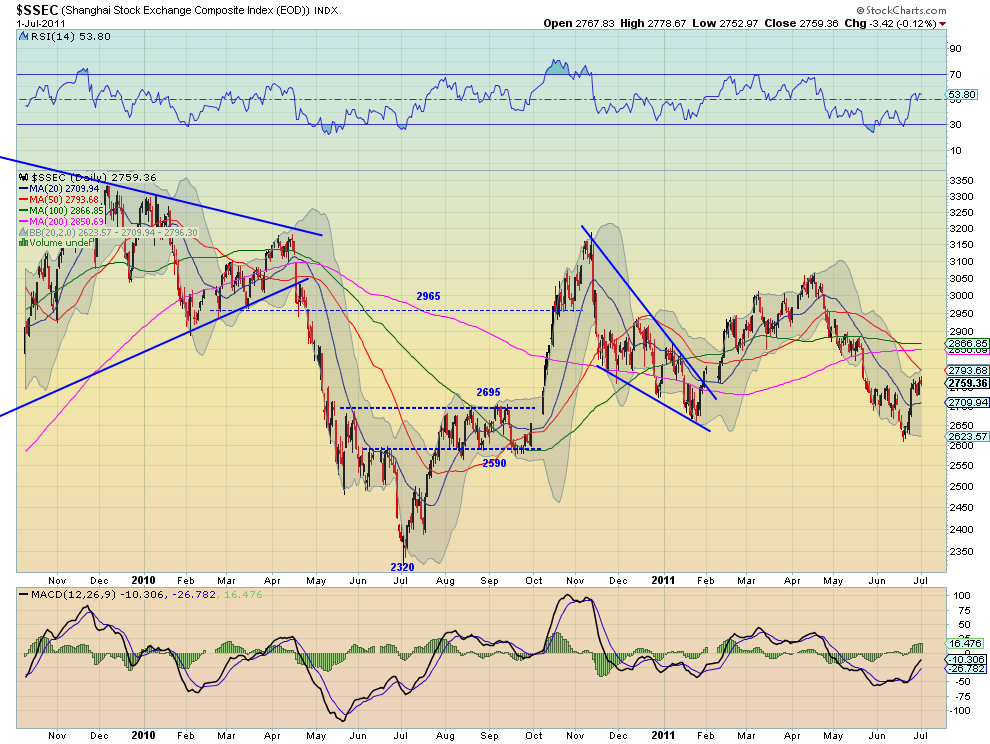
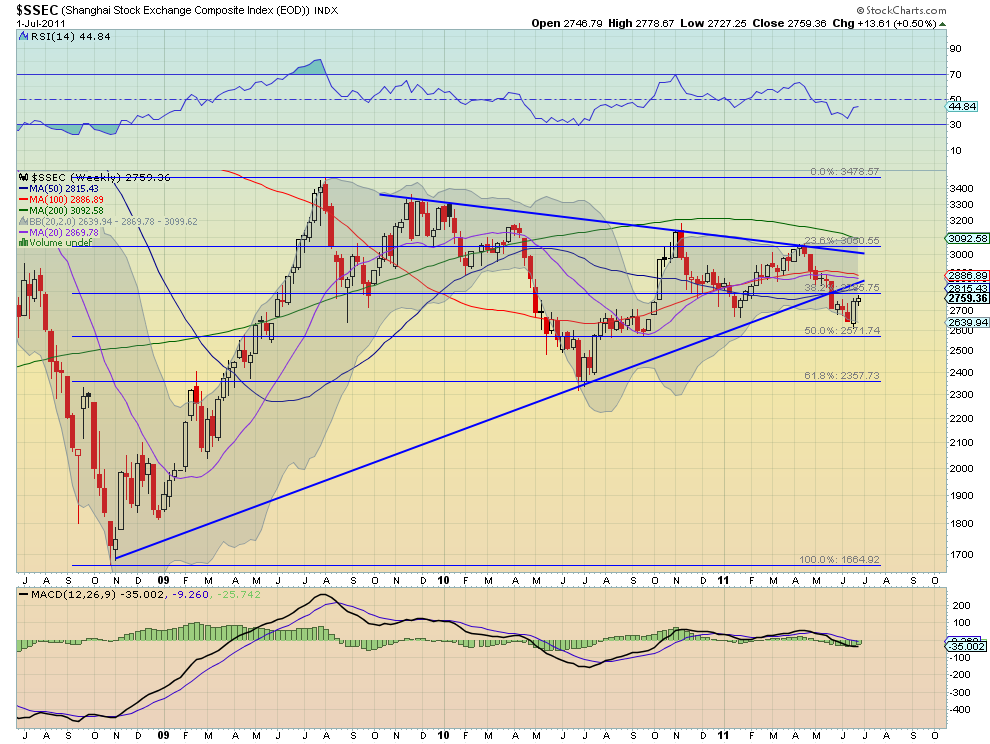
The Shanghai Composite consolidated higher this week with a drift above the early June highs. The daily chart shows that the RSI tested the mid line from above, held and reversed higher. The MACD crossed positive and has been increasing. Both are bullish. The weekly chart shows the consolidation occurring just below the Fibonacci level at 2795, with a rising RSI and a MACD that is moving north towards zero. But the SMA’s are rolling lower suggesting a top is near. Look for more upside in the Shanghai Composite next week with resistance in the 2795-2800 area.

iShares MSCI Emerging Markets Index Daily, $EEM
eem d stocks
iShares MSCI Emerging Markets Index Weekly, $EEM
eem w stocks
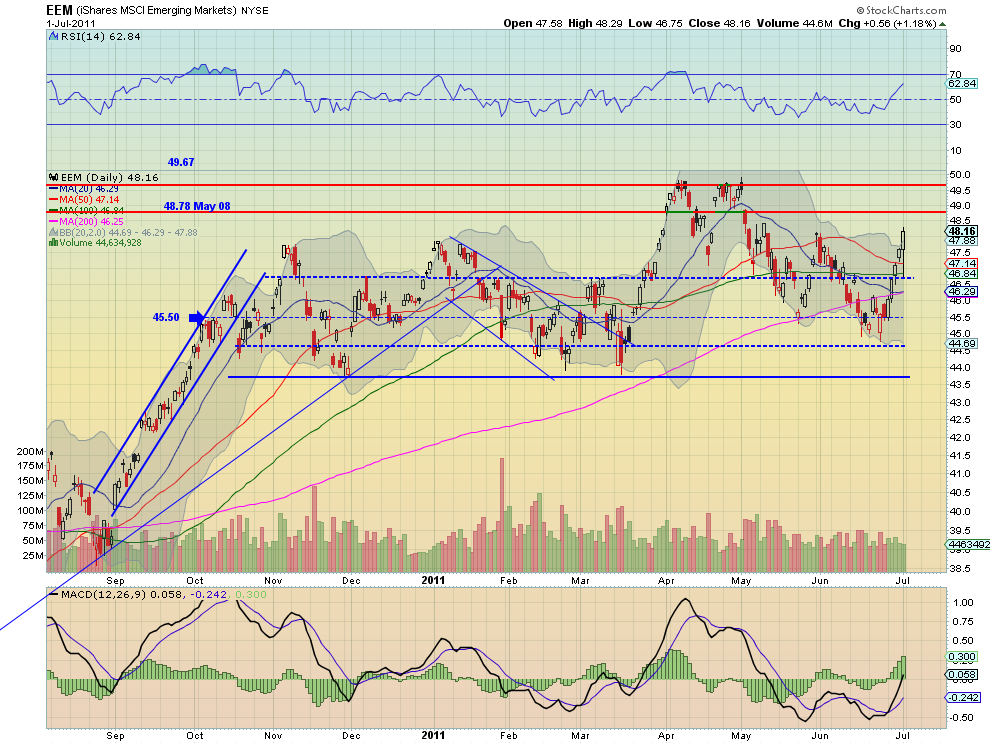
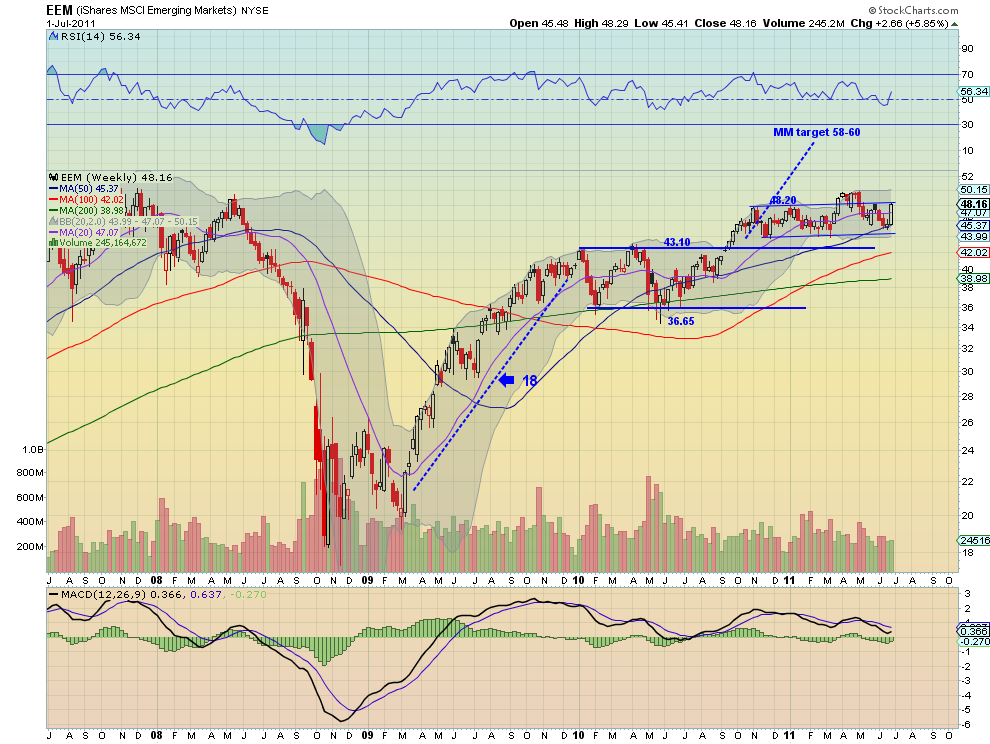
Emerging Markets, measured by the ETF EEM, rocketed higher this week. The daily chart shows the RSI is rising rapidly and the MACD growing quickly as well. Strong. The weekly chart shows that strength ended right at channel resistance. The RSI and MACD on the weekly suggest that it has more upside left in it. Look for a continued move higher next week with resistance at 48.78 and then 49.67-50 above that. 

VIX Daily, $VIX
vix d stocks
VIX Weekly, $VIX
vix w stocks
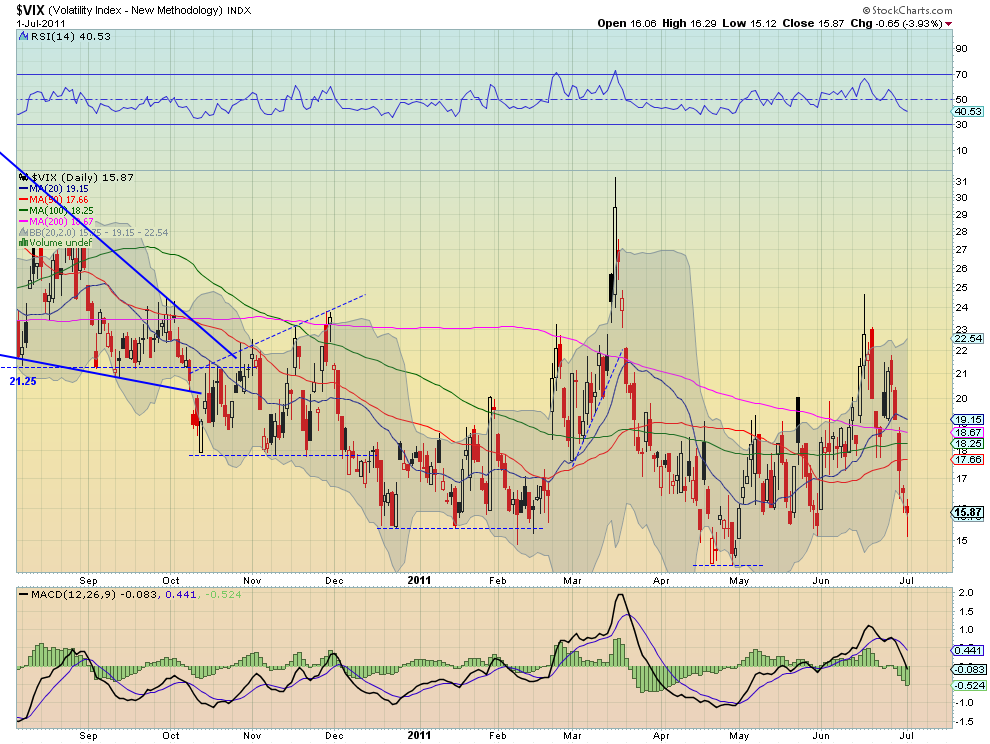
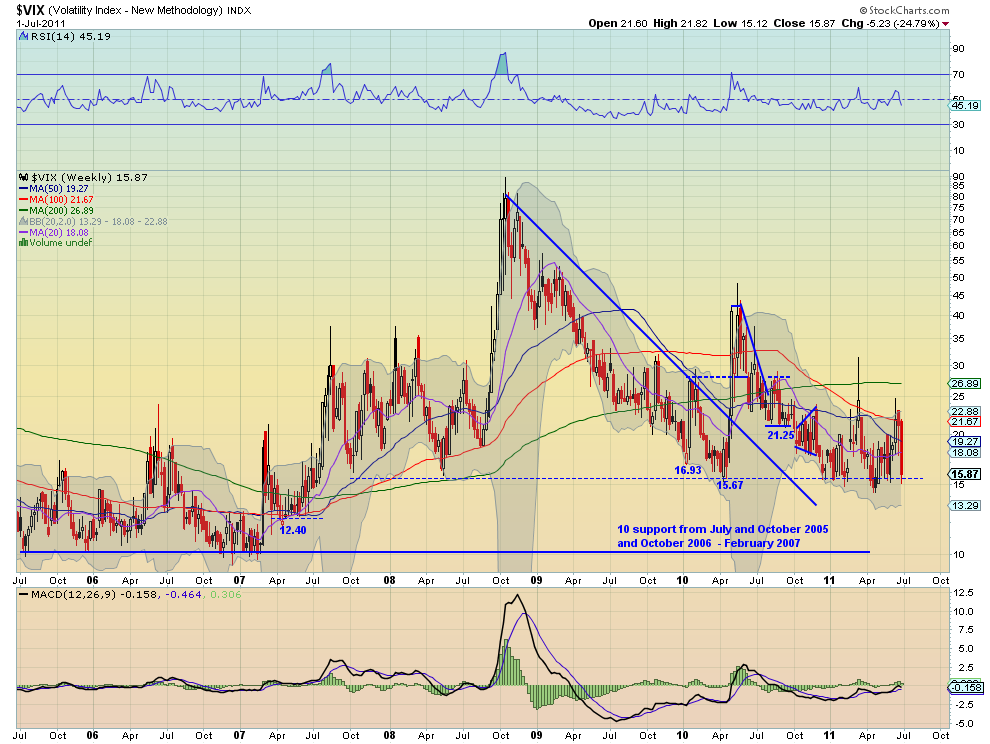
The Volatility Index teased that it was going higher and then trended lower all week, finishing at the lowest level in a month. The RSI is back below the mid line after spending most of June above it hinting of a bullish move, and the MACD now pointing to more downside. The weekly chart shows an expanding wedge which could mean a bottoming, but it is following two previous expanding wedges that did not mark bottoms. The weekly RSI is also running lower with the MACD flat but hinting at a cross lower. All this means to look for continued stability in the Volatility Index in the coning week, with a range between 15.50 and 23.

SPY Daily, $SPY
spy d stocks
SPY Weekly, $SPY
spy w stocks
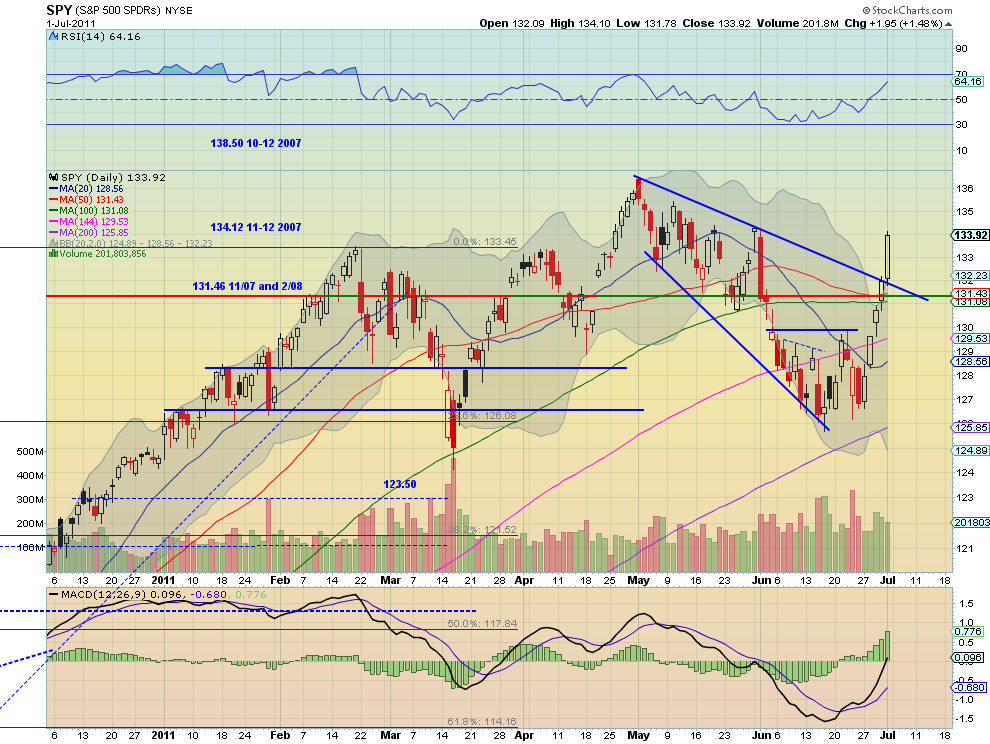
The SPY broke the descending wedge to the upside Friday and ran big to the high from the end of May. The RSI is rising sharply on the daily chart and the MACD increasing, boding for more upside. But the volume has been decreasing on the run higher and it is now well outside of the upper Bollinger band. The weekly chart shows the RSI turned sharply higher with the MACD moving back toward zero, but also highlighting the light volume. It is also still below the rising trend line resistance from the March 2009 lows. The strength of the bullish weekly Marubozu candle trumps all at the moment. Look for more upside in the coming week with resistance higher at 134.20 followed by 135.4 and finally 136.50 before a new leg higher can be expected. Any pullback should find support at 131.46 or 130 else the move higher comes into question.

IWM Daily, $IWM
iwm d stocks
IWM Weekly, $IWM
iwm w stocks
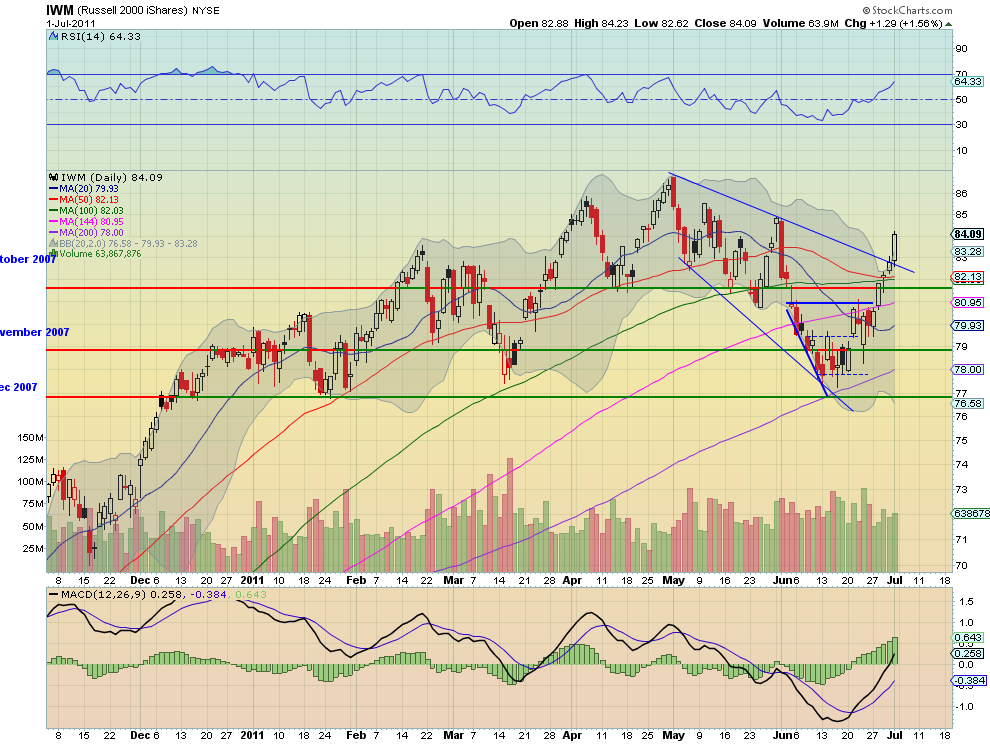
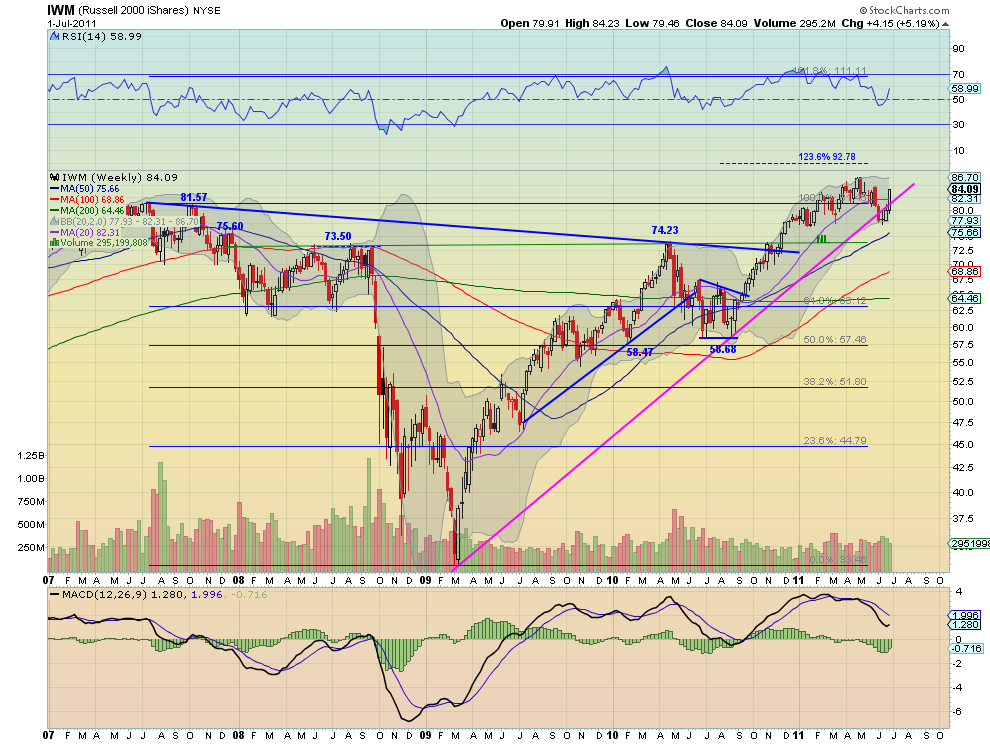
The IWM also broke the descending wedge to the upside Friday and ran big to just under the high from the end of May. The RSI is rising sharply on the daily chart and the MACD increasing, boding for more upside. Unlike the SPY the volume has been increasing on the run higher, but it is also well outside of the upper Bollinger band. The weekly chart shows the RSI turned sharply higher with the MACD moving back toward zero. It has moved above the rising trend line resistance from the March 2009 lows. The strength of the bullish weekly Marubozu candle is reinforced by the other indicators. Look for more upside in the coming week with resistance higher at 85 followed by 85.60 and finally 86.80 before a new leg higher can be expected. Any pullback should find support at 81.57 or 81 else the move higher comes into question.

QQQ Daily, $QQQ
q d stocks
QQQ Weekly, $QQQ
q w stocks
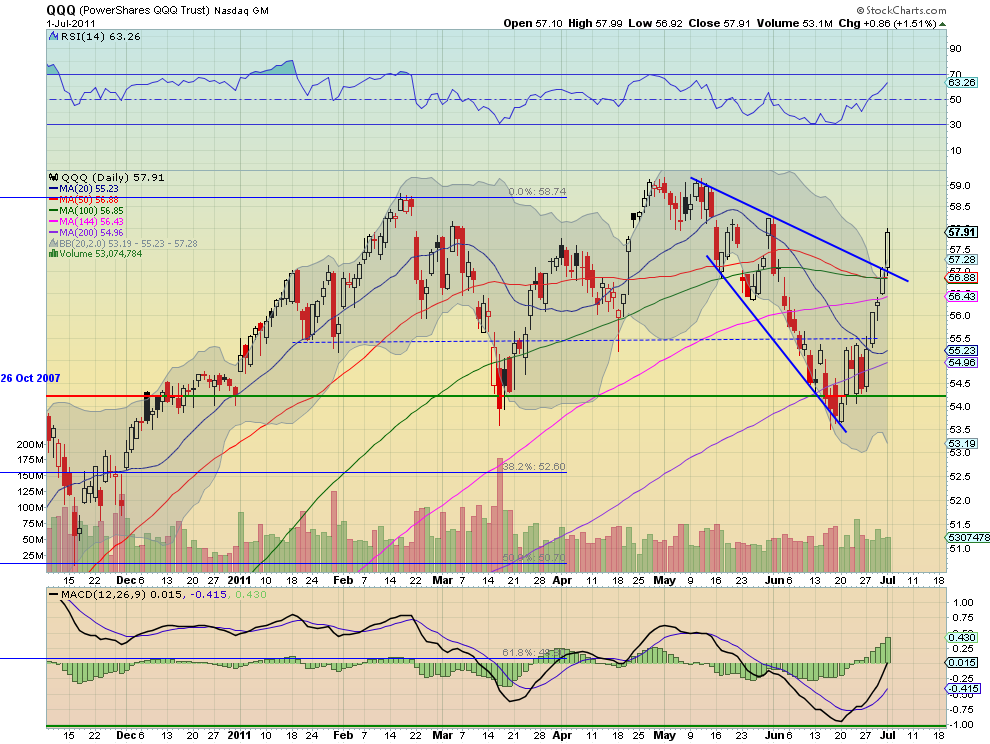
The QQQ broke the descending wedge to the upside Friday and ran big to just under the high from the end of May. The RSI is rising sharply on the daily chart and the MACD increasing, boding for more upside. But the volume has been decreasing toward the end of the run higher and it is now well outside of the upper Bollinger band. The weekly chart shows the RSI turned sharply higher with the MACD moving back toward zero. It is also at resistance of the rising trend line from the March 2009 lows. The strength of the bullish weekly Marubozu candle trumps yet again. Look for more upside in the coming week with resistance higher at 58 followed by 58.74 and finally 59.21 before a new leg higher can be expected. Any pullback should find support at 56.40 or 55.50 else the move higher comes into question.

The coming week looks for Gold to continue lower with Crude Oil biased to the upside but defined by the range between 88 and 102, I know that is big stay away from the middle. The US Dollar Index still looks headed higher to test the trend break in a bear flag, while US Treasuries continue lower. The Shanghai Composite is headed higher towards a test of the breakdown while Emerging Markets continue higher to resistance. The Volatility Index looks to remain stable allowing a run higher by the Equity Indexes toward previous highs from April. Remain cautious on any move lower that does not hold support from near Tuesday’s highs as this could trigger a major down move and a Head and Shoulders top. Use this information to understand the major trend and how it may be influenced as you prepare for the coming week ahead. Trade’m well.

The Dollar Speaks While Gold, Silver, Oil, & the S&P 500 Listen


Investors and traders alike were watching the action unfold across the pond earlier this week. It was seemingly a foregone conclusion that Greece would get the bailout they desired in order to prevent a potentially catastrophic default. The Greek default situation increased volatility in financial markets around the world. In addition to the Greek dilemma, the end of the 2nd quarter and the customary window dressing by institutional money managers only heightened the volatile situation.

For the past week or so, I have been sitting in cash, watching the price action and waiting for setups that have defined risk and solid rewards. With the heightened volatility I did not want to get involved because a trade in the wrong direction would wreak havoc with my portfolio. As this week evolved, the validity of those concerns was unquestionable.


Commodity investors have faced some tough price action recently as gold, silver, and oil have traded significantly lower quickly. Now that we have witnessed some heavy selling pressure set in particularly in the silver and oil markets investors want to know where price is heading in the short term.


U.S. Dollar Index

For the past several months I have been monitoring the U.S. Dollar Index futures in order to gauge the price action in commodities and the S&P 500. The Dollar is currently trading at a key support level and the price action in coming days will be telling. While I do not trade solely on analysis pertaining to the Dollar, I do look for setups where an underlying is dramatically impacted by its price movements.


When the planets align, I will take a trade with a directional bias that is supported by the price action in both the underlying that I’m trading and the U.S. Dollar’s price action as well. At this point in time, the U.S. Dollar Index is trading right at a key support level marked by the 20 & 50 period moving averages as well a recent low. The daily chart of the Powershares U.S. Dollar Index Bullish Fund UUP is shown below:
UUP Daily Chart
Chart12 economy
Gold & Silver

The recent bounce higher in the U.S. Dollar has been a factor in pushing gold, silver, oil, & the S&P 500 lower. Silver and oil were impacted in the harshest manner, but all four asset classes were negatively impacted. Precious metals tend to weaken during the summer and then pick back up in the fall. However, the selloff in silver the past few months has been breathtaking. For precious metals bulls who entered silver late in the rally the only outcomes were dismal. Late comers to the silver bull market were either stopped out or are currently experiencing significant pain.


While I remain a longer term bull as it relates to precious metals, in the short term I expect lower prices to continue. A major factor in my analysis stems from a longer term standpoint; the U.S. Dollar has likely put in an intermediate to long term low. There are a variety of reasons as to why, but suffice it say that from a market cycle standpoint the Dollar has likely achieved a major low and a reflex rally is likely.


Issues in the Eurozone are far from over and as time passes I expect the impact of fiscal issues rising in countries like Ireland, Portugal, and Spain to have a major impact on U.S. Dollar prices. If the sovereign fiscal issues in Europe result in a default or even a more mild technical default, the impact will likely be bullish for the U.S. Dollar.


The daily chart of the SPDR Gold TR ETF GLD and the Ishares Silver Trust SLV shown below illustrate the key areas which may be tested before the bull market in precious metals continues:
GLD Daily Chart
Chart22 economy
SLV Daily Chart
Chart32 economy
I am of the opinion that if precious metals investors are patient, an outstanding buying opportunity will present itself in both gold and silver in weeks ahead. Looking at the daily chart of the two shiny metals and identifying key levels that make sense to acquire positions is important in the trade planning process.


I like to have a trading plan in place should my expectations unfold because it removes emotion from my trading. Planning a trade and trading a plan are extremely helpful when investing in volatile markets like silver and gold. In the longer term, I continue to believe that gold and silver will shine, but in the short term more price weakness may be ahead.


Crude Oil

I am a long term gold and silver bull, but the single asset class that I am the most bullish about is energy. Oil prices in the long term have only one direction to go – HIGHER. I realize that a slowdown in the economy will put downward pressure on oil prices, but as the world’s demand for oil increases and the supply level plateaus or decreases oil prices will be forced higher. If the Dollar does rally as I expect, oil prices would likely be negatively impacted and a buying opportunity would be forged.


The daily chart of the United States Oil Fund ETF USO is shown below with my future price expectations and current key price levels illustrated:
Oil Daily Chart
Chart42 economy
S&P 500

The S&P 500 is in a very tricky spot for traders. Right now price action is testing the underbelly of a major descending trendline on the daily chart shown below:
SPX Daily Chart
Chart5 economy
However, if we take a look at a weekly chart note the massive head and shoulders formation that many traders have totally missed. A rally to the S&P 500 1,340 price level would complete the pattern. While head and shoulders patterns have failed several times in recent history, this is a major head and shoulders pattern on the weekly chart which holds more credence than shorter time frames such as the hourly or even the daily charts. The weekly chart of SPX illustrates the head and shoulders pattern.
SPX Weekly Chart
Chart6 economy
In the short run I think the S&P 500 can work higher, but if I’m right about higher prices for the U.S. Dollar in the future I expect to see much lower prices in the S&P 500 in the intermediate term, particularly if the weekly head and shoulders pattern plays out. If the S&P 500 struggles to breakout above key resistance levels, I will be of the opinion that the bear may have stopped hibernating and an impending recession may be thrust upon us in short order. There are signs pointing in that direction, but right now it remains too early to call.

Conclusion

In closing, my analysis reveals that the U.S. Dollar is poised to push higher, particularly if current support holds. If the Dollar can push above key resistance levels overhead, I expect the resulting price action in gold, silver, oil, & the S&P 500 to be dismal for the bulls.

I will be watching the Dollar closely looking for clues about price action. If I’m wrong and the Dollar breaks to new lows I would expect a massive rally in precious metals, energy, and domestic equities. With the recent price action that we have seen in the U.S. Dollar, I find it much more likely that the U.S. Dollar extends higher in coming weeks. As usual, time will tell.

Follow Us