| Como un lobo Parece que |
| Como un lobo Parece que |
by Tyler Durden
Do you believe in miracles? Morgan Stanley's Adam Parker does, having given up on his sane bearish case long ago, he now predicts S&P to 3,000 because "if we get EPS growth of 6% per year from 2015-2020, that would drive S&P500 earnings to near $170; a 17x multiple would translate into a peak level for the S&P500 near 3000 under this scenario." So, just some simple math, eh? But he does add, "of course, no one can predict unforeseen shocks to the economy," but they will never happen, right?
To back up this simple statement of mathematics, Parker produces 27 pages of fluff that in now way supports the actual thesis with long-term projections, simply shrugging away the fact that this would be the longest period of expansion (with no recession) in history.

Parker's Bottom line is a little less exuberant than the headline-makers would like you to believe...
Business cycles don't die of old age, they die of overheating. Debt dynamics, particularly in the US, paint the picture of a more prudent household sector and well-managed corporate sector, both of which remain far from the heights of leverage typically associated with risks to business cycle expansions. Moreover, volatility in the economy has trended lower over time, owing in part to technological advances that have helped companies remain nimble when sudden changes in aggregate demand occur, and in part to a rising share of companies that carry no inventory.
The current expansion is more than five years old, and with little evidence of global synchronicity, there are no signs as yet that the global economy is overheating. The current US expansion has already lasted longer than the average expansion in the post-WWII period, but the factors we monitor and have discussed here lead us to conclude that it isn't unreasonable to expect that this expansion could be the longest on record. In a scenario where the cycle does extend for several more years, earnings could grow modestly as well. The US Equity Strategy team notes that EPS growth of 6% per year from 2015-2020 would drive S&P500 earnings to near $170. A 17x multiple would translate into a peak level for the S&P500 near 3000 under this scenario.
Of course, no one can predict unforeseen shocks to the economy - be it fiscal or monetary policy missteps domestically, geopolitical events abroad, or even major natural disasters. But our title, “2020 Vision”, is our tongue-in-cheek way to desribe the idea that the current US expansion could prove to be the longest ever and perhaps last until 2020.
There are a number of ways the current expansion could get derailed. Europe and China are already slowing and near recession in some parts. Japan is highly dependent on the success of policy. US reforms on key issues like the budget, taxes and entitlements, and immigration seem a long way off and are likely to cause much angst in the coming years. And after a prolonged period of unprecedented monetary policy accommodation, we are on the cusp of removal of that accommodation - also in an unprecedented way. So by no means can we say that six or seven more years of expansion are an obvious outcome. But, all else being equal, the metrics we analyzed in this note are unlikely to be the root cause if this expansion were to be cut short.
By Lance Roberts
The Missing Ingredient
I have been in the "money game" for a long time starting with a bank just prior to the crash of 1987. I make this point only to say that I have seen several full market cycles in my life, and my perspectives are based on experience rather than theory.
In 1999, there was a media personality who berated investors for paying fees to investment advisors/stock brokers when it was clear that ETF's were the only way to go. His mantra was "why pay someone to underperform the indexes?" After the subsequent crash, he was no longer on the air.
By the time the markets began to soar in 2007, there was a whole universe of ETF's from which to choose. Once again, the mainstream media pounced on indexing and that "buy and hold" strategies were the only logical way for individuals to invest. Why pay someone to underperform the indexes when they are rising. Then came the crash in 2008.
Today, we are once again becoming inundated with articles bashing financial advisors, money managers, etc. for underperforming the major indexes during the Fed induced market surge. It is once again becoming"apparent" that individuals should only be using low-cost indexing strategies and holding for the "long term."Of course, the next crash hasn't happened yet.
My point here is this. There is a "cost" to chasing "low costs." I do not disagree that costs are an important component of long-term returns; however there are two missing ingredients to all of these articles promoting"buy and hold" index investing: 1) time; and, 2) psychology.
As I have discussed previously, the most important commodity to all investors is "time." It is the one thing we can not manufacture more of. Individuals that experienced either one, or both, of the last two bear markets now understand the importance of "time" relating to their investment goals. Individuals that were close to retirement in either 2000, or 2007, and failed to navigate the subsequent market drawdowns have had to post-pone their retirement plans, potentially indefinitely. While the media cheers the rise of the markets to new all-time highs, the reality is that most investors have still not financially recovered due to the second point of "psychology."
Despite the logic of mainstream arguments that "buy and hold" investing will work, given a long enough time frame, the reality is that investors generally don't invest "logically." Almost all investors are driven by"psychology" in their decision-making which results in the age-old pattern of "buying high" and "selling low."This is shown in the 2013 Dalbar Investor Study, which stated "psychological factors" accounted for between 45-55% of underperformance. From the study:
"Analysis of investor fund flows compared to market performance further supports the argument that investors are unsuccessful at timing the market. Market upswings rarely coincide with mutual fund inflows while market downturns do not coincide with mutual fund outflows."

What the mainstream media misses, because the majority have never actually managed money, with respect to the "buy and hold, low-cost indexing" theory is that individuals can not, and do not, invest that way. If you are paying an investment advisor to index your portfolio with a "buy and hold" strategy, then"yes" you should absolutely opt for buying a portfolio of low-cost ETF's and improve your performance by the delta of the fees.
However, the real goal of any investment advisor should not be to "beat the index" on the way up, but to protect capital on the "way down." It is capital destruction that leads to poor investment decision making, emotionally based financial mistakes and destruction of financial goals. It is also what advisors should be hired for, evaluated on, and ultimately paid for as their real job should be to remove the emotional biases from your portfolio management.
Biggest Support Of Bull Run Is Fading
No, I am not talking about the inflow of liquidity from the Federal Reserve's ongoing QE program, although it too has been a major source of support for asset prices, but rather the decline in corporate share buybacks.
According to a recent Financial Times article:
"The boom in buybacks also owes much to the Federal Reserve’s suppression of long-term interest rates via quantitative easing and stagnant growth in Europe, an important foreign market for many S&P 500 global companies.
Record low interest rates in the corporate bond market have helped fund large buybacks, but with the central bank on course to conclude buying bonds under QE in October,fuel for buybacks is ebbing and non-financial debt issuance has slowed.
Andrew Lapthorne at Société Générale says companies have exploited the generosity of financial markets to fund their share buybacks and as that fades, the equity bull market faces losing a key source of support."
Share buybacks have grown by $1.56 Trillion since 2011, but those repurchases peaked during the first quarter of this year at 159.28 billion before sliding back to $120.21 billion in Q2. The risk for the markets here is that with the Federal Reserve reducing the flow of cheap liquidity, and potentially raising borrowing costs in 2015, two of the major supports of the markets will be removed.
This will leave the markets depending on the underlying fundamental drivers of the markets which are by no means cheap.

This Won't Last
Both stocks and bonds can not be right. While stocks have risen to new all-time highs in recent days, bond yields have fallen toward the lows of the year. As shown in the chart below, there has historically been a correlation between interest rates and the financial market from a risk on/risk off indication.

It makes some sense given that when the markets have a preference for risk, asset allocations are shifted from bonds to equities and vice versa. As the demand for bonds falls, and the demand for stocks rise, yields rise. However, the current decline in yields, amidst a very low volume ramp-up in stock prices, suggests that the demand for safety is outweighing the demand for risk.
If historical correlations reassert themselves, the deviation between stock prices and bond yields will be corrected and likely not to the favor of the bulls.
Art Cashin summed this concern up well noting that this week is historically a very light trading week with a mild-upward bias. He also noted that the 1929 high was made the day after Labor Day.
"Thin markets can be tricky..stay wary, alert and very, very nimble."
By Lance Roberts
Il presidente della BCE, Mario Draghi, oggi deve sentirsi all'incirca come i jeans tra i due cavalli nel logo della Levi's. Non me lo immagino Mario con i jeans, nemmeno a 15 anni, ma va là che anche lui li avrà portati, come noi tutti.
Da una parte lo tirano i teutonici, la cancelliera Merkel ed il ministro delle finanza Schäuble, il Re dei topi, by phone: «Sull'austerità ci hai ripensato?». Agghiacciante, mi immagino, dalla sua posizione. E lui che avrà detto, il governatore "colomba" della BCE? Avrà abbozzato. Perché in effetti è vero che ci aveva ripensato, a Jackson Hole.
Aveva detto: «Nessuna quantità di aggiustamenti fiscali o monetari può sostituire le necessarie riforme strutturali: la disoccupazione strutturale era già molto alta nella zona euro prima della crisi e le riforme strutturali nazionali per affrontare questo problema non possono più essere ritardate». Che poi significa concedere più margine di manovra sui bilanci in cambio di sempre più improrogabili riforme.
E questo è l'altro cavallo che traina a testa bassa in opposta direzione, con in groppa due cristiani – non templari invero – il presidente francese Hollande ed il nostro Matteo, che ormai la Merkel presumibilmente non distingue più dal rompipalle bambino Fritz dello Schiaccianoci.
Perché l'italiano non può andare a mettere in discussione l'austerity proprio quando alla destra della CDU sta ottenendo crescenti consensi il partito anti-euro Alternative für Deutschland (9,7% in Sassonia) per la prima volta in un Parlamento Regionale. E nei prossimi giorni si vota in Brandeburgo e Turingia, ci manca solo che si ripeta la cosa!

E allora mostra i denti all'Europa tutta il Re dei topi dalle sette teste, dalle sette corone dai sette dolori (altrui) ed allunga le grinfie sui balocchi e ci dice che la medicina che dobbiamo bere «per un po' è amara, ma se fa bene, è buona». Dobbiamo disperare? Forse no.
Della spada che potrebbe servire a Matteo e a François per sconfiggere la noncurante tracotanza della Germania almeno l'ombra, all'orizzonte, si intravede, ed è la contrazione dello 0,2% del Pil registrato dalla stessa economia tedesca nel secondo trimestre, peggiore delle previsioni. E dal momento che essa è sbilanciata sulle esportazioni non potrà che nei prossimi mesi peggiorare, basti considerare l'effetto delle sanzioni economiche contro la Russia, che peseranno per il 3% dell'export complessivo, che valgono 36 miliardi di euro: di questi tempi giocati sui decimali, una cifra importante.
Il dato di ieri della produzione manifatturiera dell'area euro è il peggiore da 13 mesi. Lo spettro della deflazione è sempre meno evanescente e allora Mario il coraggio di fare qualcosa lo deve trovare – pianga pure il telefono – siano questo qualcosa le operazioni di finanziamento a lungo termine delle banche (Tltro) vincolati a crediti a famiglie e imprese, siano acquisti di titoli cartolarizzati (Abs) o sia un ulteriore taglio dei tassi, che in verità sui depositi bancari presso la Bce sono già negativi.
Mi sbaglierò, ma questa volta, e per la prima volta, la cosiddetta "ortodossia dei trattati" potrebbe essere superata da un'urgenza di crescita senza la quale pensare a un futuro di coesione europea è divenuto impossibile.

Bottiglie a 3092 metri per un anno: un esperimento della Maison Henriet-Bazin
Povero Champagne, non lo lasciano più riposare (e affinare) in santa pace! Non contenti di averlo inabissato, come abbiamo raccontato qui, al largo di Saint-Malo, e di averlo ripescato dopo un anno per vedere come era diventato, non inventandosi nulla di nuovo in verità, ma ripetendo quello che in Italia, al largo di Portofino, era stato fatto con l’esperimento del metodo classico ligure Abissi di cui aveva parlato perfino il New York Times, ora, come leggo sul blog Champagne un monde de bulles, appendo che dalle profondità lo hanno spedito sulle vette.
Il domaine Henriet-Bazin di Villers-Marmery, con larga parte delle proprie vigne collocate nella zona della Montagne de Reims, nome che non deve fare certo pensare ad un’atmosfera stile Vallée d’Aoste, visto che si tratta di una zona collinosa e boschiva, il cui punto più alto arriva a 286 metri d’altezza, Montagne de Reims che é regno del Pinot noir, con Grand cru di Champagne di grande potenza come Verzy, Verzenay, Mailly Champagne, Louvois, Ambonnay, Bouzy, Ay, ha deciso di tentare un’altra forma estrema di affinamento dei propri Champagne.
Si é così pensato di portare 18 bottiglie di differenti cuvées, Blanc de blancs (100% Villers-Marmery), Blanc de noirs (100% Verzy et Verzenay) e una speciale cuvée Selection de Parcelles, presso il Refuge du Promontoire, che si trova nel Massiccio des Écrins sull’éperon du Promontoire nel versante sud della Meije, a 3092 metri d’altezza, e lasciarle riposare per un anno.
Il prossimo anno, sperando che nel contempo qualche frequentatore del Refuge non le abbia stappate…, queste bottiglie verranno messe a confronto con altre che saranno restato nella calma e nel buio della cantina.
Sarà sufficiente un anno di tempo per consentire agli Champagne di sviluppare un tipo di affinamento diverso e caratteristiche particolari rispetto ai vini conservati non in altezza ma nella cantina della Maison o nelle normali cantine ? E i tremila e passa metri d’altezza eserciteranno un’influenza (positiva o negativa ?) sulle cuvées ?

FOR THE ENGLISH VERSION CLICK HERE
Strano ma vero ma anche nella mitica Champagne la strada delle “bollicine” sembra prendere strade alternative.
Non basta più affinare i vini nelle storiche caves o crayères scavate in epoca romana nella craie, e dotate di lunghissime e chilometriche gallerie per visitare le quali serve una guida o un navigatore satellitare, ora qualcuno sembra studiare altre ipotesi di milieu dove lasciare lungamente riposare i “méthode champenoise”.
Proprio come sta accadendo in Italia, e precisamente in una regione solo recentemente approdata alla produzione di metodo classico, la Liguria, dove da un lato, come ho scritto, si affinano i vini in caverna, e dall’altro si sono calati i vini negli abissi, come si apprende da una news pubblicata dal sito Internet specializzato britannico The Drink Business, una celeberrima Maison de Champagne come Drappier, dotata di secolari caves in quel di Reims, ha deciso una sperimentazione molto particolare.
L’azienda ha difatti immerso cinquanta casse di Champagne nel canale della Manica per studiare gli effetti delle correnti, delle maree e della pressione dell’acqua nel corso del processo di maturazione. 600 bottiglie di Brut Nature e 60 della cuvée Grande Sendrée 2005 sono state calate a 17 metri di profondità (non certo abissale) al largo di Saint-Malo, dove rimarranno per un anno.
Drappier ha dichiarato di aver preso ispirazione dagli esperimenti fatti con successo da un cliente bretone, Yannick Heude proprietario della Cave de l’Abbaye Saint-Jean nella località turistica a partire dal 2004.
Come racconta sul sito Internet della Cave, Heude ha posto in immersione diversi vini, tra cui Champagne di note Maison, rimanendo impressionato dai risultati quando le bottiglie sono state stappate e degustate dopo un anno di permanenza in profondità. Secondo il caviste, a 15 metri di profondità e con una temperatura stabile di dieci gradi, il movimento delle maree e delle correnti “culla” le bottiglie.
Come racconta, “non immaginavamo di riscontrare una tale differenza tra le bottiglie immerse e quelle rimaste nelle cantine aziendali. Il colore non mostrava una differenza particolare, diventando forse un po’ più intenso”, ma il naso “era più potente, aromatico e fruttato, la bocca aveva un maggiore volume, più aroma e dava l’impressione di una sorta di completamento del vino che finiva con una nota fresca e minerale”.
Secondo Heude, “se il mare è una cantina perfetta è evidente che la diversa evoluzione del vino è dovuta al fenomeno delle maree. Il flusso e riflusso del mare sulle bottiglie, l’attrazione della luna provocata dalle maree e della corrente costituiscono degli elementi biodinamici di sicura influenza”. E come ha dimostrato la degustazione comparativa dei vini, “realizzata per più di cento persone, appare evidente che un anno di permanenza in immersione basta a trasformare positivamente il vino”. Quanto alla pressione esercitata sulle bottiglie non è superiore a 6-8 atmosfere e non c’è il rischio di danneggiarle o che l’acqua possa annacquare lo Champagne.

Michel Drappier, patron della Maison champenoise, pensa ad una degustazione comparativa, cui sarebbe interessantissimo partecipare, da organizzare nel giugno del prossimo anno, tra le bottiglie immerse e altre sottoposte a dégorgement lo stesso giorno dell’immersione a attualmente in affinamento in cantina.
E pensa inoltre di destinare buona parte dello stock delle bottiglie “inabissate” ad un’asta i cui ricavati verranno destinati alla Société Nationale de Sauvetage en Mer. Nobili intenzioni, chapeau!
Riemerso dalla baia di Saint-Malo lo Champagne rimasto negli abissi un anno
Ricordate, l’avevo raccontato qui lo scorso agosto, il singolare caso delle 660 bottiglie, 600 Brut Nature zéro dosage e 60 Grande Sendrée 2005, della celebre Maison champenoise Drappier, che proprio come fa da anni un produttore ligure, Bisson, con il suo Abissi, aveva scelto il fondo del mare, a 15 metri di profondità, a 9-10 gradi costanti, nella baia di Saint-Malo, per un singolare affinamento fatto sfruttando gli effetti delle maree?
Esperimento fatto per verificare se la permanenza in acqua avrebbe o no avuto l’effetto di accelerare la maturazione dei vini? Bene, dopo un anno di immersione, le bottiglie sono state ripescate con una forma di vendemmia subacquea. Drappier era stato convinto a compiere questa esperienza da Yannick Heude, proprietario della cave l’Abbaye Saint-Jean à Saint-Malo e presidente di un’associazione, “Immersion”, che studia l’evoluzione dei vini in ambiente marino.
E’ ancora presto per sapere quali risultati daranno le prove di comparazione tra i vini rimasti sott’acqua ed gli stessi vini affinati in cantina. Per ora pare che i vini immersi presentino un colore più scuro e su toni più gialli e un’effervescenza più contenuta, ma secondo Michel Drappier bisognerà attendere che il vino si riposi per un periodo significativo perché eventuali differenze possano farsi notare in maniera più chiara.
by William Lazonick
"Plunderers of the world, when nothing remains on the lands to which they have laid waste by wanton thievery, they search out across the seas. The wealth of another region excites their greed; and if it is weak, their lust for power as well.
Nothing from the rising to the setting of the sun is enough for them. Among all others only they are compelled to attack the poor as well as the rich. Robbery, rape, and slaughter they falsely call empire; and where they make a desert, they call it peace."
Tacitus, Agricola
"Five years after the official end of the Great Recession, corporate profits are high, and the stock market is booming. Yet most Americans are not sharing in the recovery. While the top 0.1% of income recipients—which include most of the highest-ranking corporate executives—reap almost all the income gains, good jobs keep disappearing, and new employment opportunities tend to be insecure and underpaid. Corporate profitability is not translating into widespread economic prosperity.
The allocation of corporate profits to stock buybacks deserves much of the blame. Consider the 449 companies in the S&P 500 index that were publicly listed from 2003 through 2012. During that period those companies used 54% of their earnings—a total of $2.4 trillion—to buy back their own stock, almost all through purchases on the open market. Dividends absorbed an additional 37% of their earnings. That left very little for investments in productive capabilities or higher incomes for employees."
by Tyler Durden
When it comes to keeping track of China's economy, one can listen, and ignore, the official goalseeked and made-up-on-the-fly data released by the government, or one can simply observe the price dynamics of the all-important Chinese commodities sector (because with fixed investment accounting for well over 50% of GDP, the marginal price of the commodities that are used in capital investment tell us all we need to know about the true state of the Chinese economy). It is here where we find that contrary to the recent performance of the Shanghai Composite, which has been trading exclusively on the coattails of the most recent unofficial QE by the PBOC, commodity prices in China are actually crashing across the board, which in turn suggest that the real GDP is most likely anywhere between 20% and 60%, if not more, below the "official" 7.5% GDP print.
Here are the charts, alongside some commentary from Bank of America:
Last week, Qinhuangdao (QHD) 5,500k thermal coal price was at RMB480/t, unchanged from the week prior. QHD coal inventory decreased to 5.6mt, down 0.5% wow.

In August, growth of daily coal consumption at 6 major IPPs dropped by 22.5% yoy, down from the -16.3% yoy in July.

Rebar price was RMB3,058/t, down 1.1% wow. Rebar inventory in 34 major cities was at 5.47mt, down 1.9% wow. Concerns about the property market and relatively high steel production are still weighing on steel prices.

Iron ore price was US$88.0/t, down 1.9% wow. Iron inventory at Chinese ports was 112mt, up 1.4% wow. Iron ore prices have been under immense pressure since the beginning of the year and are likely under continuous pressure from the weak housing market.

National average cement price was RMB347.5/t, down 0.9% wow.

That said, for the inflation watchers, there is some good news: pigs are flying! "Last week, national average pork prices increased by 2.3% from the previous week to RMB23.3/kg. Meanwhile, the hog-to-corn price ratio edged up to 5.57 compared to a breakeven point of 6 for pig farmers."

Actually did we say, "good news"... in a contracting economy, the last thing China can afford is surging food prices from the most prevalent protein. Keep a close eye on this as should pork prices approach or take out 2011 highs just RMB5 higher from here, the events from the Arab Spring will be due for a quick and violent comeback.
* * *
Finally, for the data purists, here are the three most "representative" charts: electricity, rail and autos.


A message Japan began delivering Monday is a bit unusual, but true enough: Don't wait until it's too late to think about toilet paper.
The government and paper companies kicked off a "Let's stockpile toilet paper!" campaign to mark Disaster Prevention Day, warning of a possible crisis because nearly half of the supply comes from one of Japan's most earthquake-prone areas.
Officials said people immediately think of food and water as emergency supplies, but easily forget toilet paper, and get desperate when it's too late.
"After running out of toilet paper, people start using tissue, and that could clog up precious workable toilets," said Toshiyuki Hashimoto, an industry ministry official in charge of paper products.
As part of the campaign, makers are offering a tightly rolled, 150-meter- (490-foot-) long, single-layer toilet paper that lasts more than twice as long as a regular roll.
A family of four should be able to survive for a month on a six-roll pack, priced at 460 yen ($4.40) and with a five-year expiration date, said Satoshi Kurosaki, chairman of the Japan Household Paper Industry Association.
Government and industry officials said 41 percent of the country's toilet paper supply comes from Shizuoka prefecture in central Japan, where experts say there is a higher than 80 percent chance of a major offshore quake in the next 30 years.
Officials warned of a nationwide toilet paper shortage for about a month in such a disaster, based on lessons learned from the deadly March 2011 earthquake and tsunami in northern Japan.
Nine months after that disaster, toilet paper was added to a list of recommended items that included food, water, portable toilets and a first-aid kit, under the government's Basic Disaster Management Plan.
"Along with food, toilet paper was among the first items that disappeared from store shelves during the disaster, even outside disaster-hit areas," Hashimoto said in front of a public display in the ministry entrance hall, decorated with campaign posters, including one saying "Be prepared and no regrets!"
The campaign involves nearly 40 toilet paper companies, including industry leaders Nippon Paper Crecia Co., Oji Nepia Co. and Mitsubishi Paper Mills Ltd.
"Toilet paper is an indispensable part of daily life," Kurosaki said. "And yet 41 percent of the supply comes from the extremely high-risk zone. So we should be prepared."
Japan takes disaster preparedness seriously, especially since the 2011 earthquake and tsunami, which killed about 19,000 people.
Hundreds of thousands of people take part in an annual drill every Sept. 1, the anniversary of the 1923 Great Kanto Earthquake, which killed more than 140,000 people in Tokyo.
by Bradford DeLong
BERKELEY – First it was the 2007 financial crisis. Then it became the 2008 financial crisis. Next it was the downturn of 2008-2009. Finally, in mid-2009, it was dubbed the “Great Recession.” And, with the business cycle’s shift onto an upward trajectory in late 2009, the world breathed a collective a sigh of relief. We would not, it was believed, have to move on to the next label, which would inevitably contain the dreaded D-word.
But the sense of relief was premature. Contrary to the claims of politicians and their senior aides that the “summer of recovery” had arrived, the United States did not experience a V-shaped pattern of economic revival, as it did after the recessions of the late 1970s and early 1980s. And the US economy remained far below its previous growth trend.
Indeed, from 2005 to 2007, America’s real (inflation-adjusted) GDP grew at just over 3% annually. During the 2009 trough, the figure was 11% lower – and it has since dropped by an additional 5%.
The situation is even worse in Europe. Instead of a weak recovery, the eurozone experienced a second-wave contraction beginning in 2010. At the trough, the eurozone’s real GDP amounted to 8% less than the 1995-2007 trend; today, it is 15% lower.
Cumulative output losses relative to the 1995-2007 trends now stand at 78% of annual GDP for the US, and at 60% for the eurozone. That is an extraordinarily large amount of foregone prosperity – and a far worse outcome than was expected. In 2007, nobody foresaw the decline in growth rates and potential output that statistical and policymaking agencies are now baking into their estimates.
By 2011, it was clear – at least to me – that the Great Recession was no longer an accurate moniker. It was time to begin calling this episode “the Lesser Depression.”
But the story does not end there. Today, the North Atlantic economy faces two additional downward shocks.
The first, as Lorcan Roche Kelly of Agenda Research noted, was discussed by European Central Bank President Mario Draghi while extemporizing during a recent speech. Draghi began by acknowledging that, in Europe, inflation has declined from around 2.5% in mid-2012 to 0.4% today. He then argued that we can no longer assume that the drivers of this trend – such as a drop in food and energy prices, high unemployment, and the crisis in Ukraine – are temporary in nature.
In fact, inflation has been declining for so long that it is now threatening price stability – and inflation expectations continue to fall. The five-year swap rate – an indicator of medium-term inflation expectations – has fallen by 15 basis points since mid-2012, to less than 2%. Moreover, as Draghi noted, real short- and medium-term rates have increased; long-term rates have not, owing to a decline in long-term nominal rates that extends far beyond the eurozone.
Draghi’s subsequent declaration that the ECB Governing Council will use “all the available unconventional instruments” to safeguard price stability and anchor inflation expectations over the medium-to-long term is telling. The pretense that the eurozone is on a path toward recovery has collapsed; the only realistic way to read the financial markets is to anticipate a triple-dip recession.
Meanwhile, in the US, the Federal Reserve under Janet Yellen is no longer wondering whether it is appropriate to stop purchasing long-term assets and raise interest rates until there is a significant upturn in employment. Instead, despite the absence of a significant increase in employment or a substantial increase in inflation, the Fed already is cutting its asset purchases and considering when, not whether, to raise interest rates.
A year and a half ago, those who expected a return by 2017 to the path of potential output – whatever that would be – estimated that the Great Recession would ultimately cost the North Atlantic economy about 80% of one year’s GDP, or $13 trillion, in lost production. If such a five-year recovery began now – a highly optimistic scenario – it would mean losses of about $20 trillion. If, as seems more likely, the economy performs over the next five years as it has for the last two, then takes another five years to recover, a massive $35 trillion worth of wealth would be lost.
When do we admit that it is time to call what is happening by its true name?
by Tobias Bunde, Dominik P. Jankowski, Martin Michelot
BERLIN – Some months ago, NATO Secretary General Anders Fogh Rasmussen referred to Russia’s annexation of Crimea as a “wake-up call” for the West. Since then, Europeans and Americans have slowly but steadily tightened the economic screws on Russia.
But, in striking contrast to the overall cohesion displayed on the sanctions front, the West’s military response to Russia’s new assertiveness in its so-called “near abroad” has been uncoordinated and reluctant. As a recent report of the Defense Committee of the United Kingdom’s House of Commons argued, “NATO is currently not well-prepared for a Russian threat against a NATO Member State.” Given that this is a source of grave concern to NATO members close to Russia, the Allies must send an unequivocal message to Russian President Vladimir Putin when they meet in Wales next week: NATO territory is inviolable.
To be sure, as Rasmussen repeatedly emphasizes, every ally contributes to the reinforcement of collective defense in one way or another. But, while some allies have markedly stepped up their commitments by sending soldiers or additional fighter jets, others have limited themselves to offering only minor capabilities. Thus, the United States is bearing the main burden of reassuring NATO’s Central and Eastern European members.
Speaking in Warsaw earlier this year, President Barack Obama presented his European Reassurance Initiative, a $1 billion program aimed at supporting the defense of NATO allies close to the Russian border. While his announcement fell short of what many in Poland and the Baltic states had hoped for, Obama promised that these allies would have US “boots on the ground” – rotating units that would conduct regular exercises.
In other words, there is nothing particularly “European” about the initiative. It is not merely “led” by the US, but is essentially a US-only initiative without any Europeans, except for the host countries, participating. Although an American contribution remains indispensable for credible deterrence against Russian aggression, the absence of clear European commitments to put boots on the ground highlights the long-standing question of burden-sharing between the US and Europe. If Europeans cannot step up to this kind of challenge on their home turf, how can Americans expect them to become reliable partners for challenges elsewhere?
The upcoming NATO summit offers an opportunity to demonstrate Europe’s commitment to collective defense, to a stronger European defense posture, and to the transatlantic alliance. Instead of adding a few sparse cosmetic capabilities, NATO’s European members should at least match the US effort and provide an additional €1 billion ($1.3 billion) for reassurance measures. For perspective, this amount more or less equals what Germany alone has spent annually on its contribution to the International Security Assistance Force in Afghanistan in recent years.
The countries of the so-called Weimar Triangle – France, Germany, and Poland – are well suited to lead such an effort. The three big countries in the middle of Europe should thus staff a regional headquarters, which would serve as the basis for defense planning and exercises and support the rotating US troops.
Poland has long called for more allied troops on its territory and would be ready to provide the headquarters for such a European contribution. This would most likely mean upgrading the headquarters of the Multinational Corps Northeast in Szczecin, which could also host a French contingent, in addition to the Danish, German, and Polish forces that currently form the kernel of the Corps. Although this would not fulfill all Polish wishes, it would constitute an important step toward more equitable burden-sharing among NATO countries.
Though Germany, long accused of being a “bear hugger,” has recently become much tougher on Russia, German politicians continue to oppose new bases or permanent structures in Poland or the Baltic states for fear of adding fuel to the fire. Without its two important neighbors at its side, Germany is unlikely to take part in a mission involving the permanent deployment of rotating units.
German participation, however, would send a strong signal not only to the Kremlin, but also to its allies. This visible defense commitment would also allow Germany, sometimes suspected of seeking neutrality, to pursue new diplomatic engagements with Russia.
France, finally, has been a target of harsh criticism, owing to its determination to deliver two Mistral warships built for the Russian government. By making a significant contribution to European reassurance by participating in the enhanced NATO presence in Szczecin, it would demonstrate that it remains committed to the defense of its allies in the Russian neighborhood. It would also cement its perceived European leadership on defense issues and help to forge a larger coalition to provide additional support to the Weimar Triangle. Indeed, such a European force could be an important step toward a Europe de la défense, an idea that France has been committed to for a long time.
Most important, such a European initiative, which should be open to other countries as well, would clearly underline that Europe is ready to contribute its fair share to collective defense – a signal that the US would greet enthusiastically. Given a world in turmoil, with several serious crises in Europe’s neighborhood, this would be one of the few positive developments of 2014.
by Simon Black
Imagine this scene:
“Everyone in the country was in shock. People’s net worth had devalued more than 53% overnight.”
“The value in savings accounts dropped in half and neither merchants nor consumers knew how to react because they had never been through something like it before…”
This is how an American business executive described living through Mexico’s devaluation of the peso exactly 38 years ago on September 1, 1976.
Looking back, it was so obvious.
Mexico had a mounting debt, destructive policies, and a woefully unsustainable fixed exchange rate with the US dollar. All the writing was on the wall.
But most people ignored the warning signs and kept their money in pesos.
Mexican President Luis Echevarria even went out on the radio to reassure people that the currency was safe.
Finally, under intense fiscal pressure, the government reached its breaking point. And on August 31, 1976, they made the decision to devalue the peso.
People woke up the next morning on September 1st to a 50%+ decline.
Coincidentally today is also the 75th anniversary of the Nazi invasion of Poland, the event that ultimately dragged the world into war.
Germany had already invaded Austria and Czechoslovakia in the months before.
By May 1939 Hitler had stated very plainly, “the decision remains to attack Poland at the first opportunity.”
Even a week before the invasion, Hitler told his military commanders, “I have prepared . . . my ‘Death’s Head’ formations with orders to kill without pity or mercy all men, women, and children of Polish descent or language.”
Germany had 60 divisions massed on the Polish border ready to invade.
Yet people in Poland were told to keep calm, remain in place, and have confidence in their leaders.
Finally, on August 30, the Polish government ordered a partial mobilization to meet the German threat.
Needless to say, it was too little, too late. Germany invaded only hours later.
This is a familiar story that repeats across history. Despite obvious warning signs, people almost universally allow themselves to ignore reality.
It’s human nature to want to believe that everything is going to be OK. And when our political leaders whisper soothing words of hope and optimism, we take the bait.
Looking back, it was plain as day that Mexico was going to devalue the peso. Everything about the economy and currency was totally unsustainable. Deep down people knew it.
Similarly, it was plain as day that Hitler was going to decimate Poland. And people knew it.
Yet millions allowed their confidence to be misplaced in leaders who assured them that everything was OK.
Are we so different today?
The raw numbers tell us that most banks in Europe are insolvent. Bank in the US are dangerously illiquid.
Most western governments are bankrupt. Pension and social security funds are insolvent.
Financial markets are at precarious valuations. And the dollar is beginning to unravel as the dominant reserve currency.
These are data-driven assertions. And my guess is, deep down, your instincts are also telling you that something is seriously wrong with the system.
Yet we’re all told to keep calm by our leaders. There’s nothing to see here, nothing to worry about.
Looking back, it’s all going to seem so obvious. If a major, global currency crisis hits within the next 12-months, people will think, “duh, how did I not see that coming?”
Unfortunately by then it will be too late.
It takes only a little foresight and planning to insulate yourself from an event that can have disastrous consequences.
If you knew the Mexican peso was at an unsustainable level, why would anyone continue to hold pesos?
Similarly, if all the objective data suggests that the dollar is in store for an epic decline… and that the entire world is on a path to shift away from the dollar, why in the world would any rational person base his entire life savings in dollars?
It takes little effort to actually do something about it. Hold stronger currencies overseas. Own real assets. Move your retirement account abroad where your bankrupt government can’t steal it.
These are common sense steps, just like putting on a seatbelt when you get into a car.
The time to act is now. Why play Russian roulette when the odds are clearly in favor of the house?
Don’t try to time it. Nobody has a crystal ball. It’s irrelevant whether the trend unfolds over weeks, months, or years. It’s pretty clear where this is all headed.
The preliminaries are over; the lowest volume week in ages is behind us.
There’s a chance the next six weeks can define the next year. Realize we don’t have a crystal ball. Gann is not a crystal ball. Some people think market cycles are static, a nine-month cycle, 13-month, even a 39-month cycle. I’ve never seen these work. Why? Markets are not linear which is why economists get it wrong most of the time.
Markets respond either to specific Fibonacci or golden spiral windows (161, 261) or by a squaring of price and time. So it turns out as the holiday completes we welcome the month of September and with it the biggest time window I’ve seen in the 15 years I’ve been doing this work. If all windows have a margin of error of plus or minus 1, then the 987-month window starts as soon as the overnight session begins. It’s also 144 months off the 2002 bottom by Oct. 10.
We have one very interesting calculation to start this window. With a 2009 low of 1265.62, September starts in the Nasdaq with a percentage change reading of 261.89%.

This is rare but I’ve seen charts turn right at 161 and 261%. It’s early in time window season and this is a good early indication if we can get the turn right here or whether it lingers into October. So just as the young NFL season kicks off this week, the young cycle season kicks off right here with this golden spiral percentage change test.
As I said, we don’t have a crystal ball but from my experience we are likely to continue this rally into October. That being said, I realize September is the toughest month of the year. So what is the theme coming into September? There are a handful of stock market minds that grace our televisions every day. Last week Art Cashin was asked about his concerns for the market. What did he say? I’m not quoting because it’s too long but this is crux of what was said. He said he was concerned about the complacency that has created a condition where every pullback which comes as a result of a geopolitical event. His feels it’s possible that one of these events will be big enough we won’t be able to come back from it. Where else have you heard that? This has been the year of the geopolitical surprise. Nothing new, you read that here just about every week.
This week it appears the situation in the Ukraine is escalating with the EU putting out an ultimatum which has the feel of a state of war existing between Russia and the West. Don’t worry, the West isn’t sending troops in, there’s a precedent for this situation. Remember when the Nazis invaded Poland? From September 1939 into the spring of 1949 they had a condition known as ‘the phony war.’ The French sat in their World War I style trenches all winter with very few shots getting fired. There is also a NATO meeting this week where Mr. Obama seeks to put together a coalition of nations to fight the barbarian in the Middle East. Art Cashin isn’t that old but he must be a darn good student of market history to take this stuff as serious as he does. It’s a shame more people don’t.
The British have already figured out an attack may be imminent. Last week we discussed the possibility of a new secular bull market for the dollar(NYBOT:DXZ4). I believe if we can destroy the barbarian it would restore American prestige to the world and one of the spoils would be a growing Greenback. We don’t believe news events drive the overall price of an instrument. As the inflection hits so does the news event. What we see here from the long term Dollar is a collision with the very long term Andrews channel line. As you can see the line has repelled the action every time it has been touched going back to 2005. Back in 08 I told you that as long as the price action stayed in a trading zone above the 08 low but wouldn’t take out that Andrews line the economy would continue to heal. That was based on the mountain of debt from the housing crisis and the potential for a deflationary depression. Its 6 years later and I believe that condition has abated to a great degree. Now the descending line is no longer at 89, its right here at 84.
What I think can happen is a major geopolitical inflection point with either Russia or ISIS can come to a boil at the point the greenback tests that 84 line. Who knows? When the greenback hits 84 a coalition might go in to clean the barbarians out. Or something significant could happen in the Ukraine or under the worst case scenario, it’s possible there is a terrorist attack. Our guidelines are to look for important news events to manifest as the instruments hit key points in their respective patterns.
As the calendar turns, it’s time for another interesting stock market season. Nobody knows exactly what is going to happen but with cycle windows on a monthly scale chances are something is going to happen.

by Marketanthropology.com
For lack of a better name, we call it Sunday night feeling in our house. It usually hits the kids around two or three in the afternoon and spreads with doleful interactions up the chain of command, eventually reaching its peak just before dinner.
"I don't want to go to school tomorrow."
"I wish it was Friday."
"Where did the weekend go?"
Whether it's the food for the kids or a glass of wine for mom and dad, the apathy is slowly swallowed and accepted by the time dinner is through. With the end of summer officially crossed this Labor Day weekend with a final crawl up the Garden State Parkway, we find ourselves sitting with a severe case of Sunday night feeling - here this Monday evening. Adding to our general indifference, we also find the markets situated with a mixed bag of performances through the summer months that leaves more questions than answers from both a tactical and strategic point of view. Granted, the markets are rarely an easy read or a fat pitch down the center of the plate, but the continued shift and loosening in inter-market correlations have muddled the waters considerably and allowed ebullient markets to remain buoyant as greater uncertainty abounds. Yes, uncertainty. In our experience, the old Wall Street adage that markets hate uncertainty, is about as accurate as your data is safe in the cloud... Perhaps a better truism would be: a market that stays in motion remains in motion - of course, until everyone is certain it will remain in motion. Let's just call it the Minsky coefficient.

Looking back at the summer through July and August, we've experienced enough cross currents and strange bedfellows of performance pairs to collectively leave certainty in short supply. Just to name a few: Strong dollar - strong emerging markets and Chinese equities; strong dollar - strong bond market; strong bond market - weak yen; weak small caps - strong Nasdaq; strong bond market - weak precious metals; weak gold - firm gold miners. From a cross asset point of view, one of the primary outlier influences over the summer appears to have been at the hands of a weak euro. For all of our cynicism directed at the ECB and Draghi this spring, the currency markets pivoted sharply thereafter, cutting the euro over 4 percent through July and August. This in turn placed a strong bid beneath the US dollar index which maintained pressures on the commodity markets that weaken throughout the better part of summer.
That being said, the same market dynamics in which traders lean on the perception that the only clear path for the euro is lower - because of what the ECB can and will bring to the table, are even more stretched than where they were historically at the beginning of summer. To that end, gross short euro positions are in spitting distance of the record set in July 2012, when the actual fate of the currency union was very much in doubt. Furthermore, when you factor in the futures positioning of both the euro and the dollar, a rather extreme picture is brought to light (Courtesy of Nordea Markets savvy currency strategist Aurelija Augulyte and Reuters Ecowin). When it comes to the euro, certainty is certainly not in short supply these days.
At the end of the day we still believe the euro is primarily motivated and supported in the long-term by strong deflationary forces - compounded by its flawed structure, which at times present real existential catalysts for the markets to react on. In this sense the euro is unique, although we still look towards the Japanese yen of yesteryear for guideposts in the road and similarities in burgeoning deflationary trends. In the summer of 2012 when Draghi threw down the gauntlet and declared whatever it takes, those existential concerns were addressed and the euro pivoted sharply higher. With Draghi once again stepping up to the podium this week with hints and hopes of more or less whatever it takes already greatly factored into positioning, we can't help but feel the euro's outlier influence in the markets this summer is drawing to a close. From our perspective we don't expect that Draghi will get off this easy with Europe's considerable deflationary concerns. Japan certainly didn't - and they only had one economy and political system to navigate. It's back to school and reality for the euro.


Hold your applause for the latest central bank rescue, please.
The European Central Bank this week is expected to announce a bond-buying campaign. Recent weeks have brought a pronounced shift by the often-hawkish institution, a reversal that has been greeted enthusiastically by investors around the globe scrambling to buy government bonds.
Lost in the reports of fractional German 10-year bond yields is an unpleasant but inescapable fact: The ECB’s move underscores the abject failure of Western governments to deal meaningfully with difficult economic and demographic challenges. That abdication has left central banks such as the U.S. Federal Reserve and ECB to play an ever-larger role — one they can’t fulfill indefinitely without compromising their own integrity or the health of financial markets.
In the U.S., where a gridlocked Congress has imposed all manner of fiscal drags on growth, the Federal Reserve has similarly had to play a driver’s role. It is part of what John Llewellyn, a former Organization for Economic Cooperation and Development economist who now heads up London-based Llewellyn Consulting, describes as monetary policy’s evolution from “subservience to fiscal policy” in the 1960s to “prominence” in the inflation-wracked 1970s to becoming “the principle means of fine-tuning the economy.”
How a government taxes and spends has profound economic effect. Sound fiscal policy can add to growth, poor policy will detract from it. In the euro zone, the latter occurred in tragic fashion: The region’s unemployment rate stands at 11.5%, far higher than any industrialized country outside the zone, while youth unemployment is twice that. In Spain the jobless rate is twice the euro zone average and youth unemployment is more than twice that again – at 53.5%.
Problematically, “fiscal policy has been relegated to a budgetary matter,” Mr. Llewellyn says.
Others are more direct in their criticism of government inaction.
“There is no way other than to say that the policies have failed,” says Joseph Stiglitz, the Nobel laureate economist from Columbia University, who has calculated that euro-zone GDP is now 18% below where it would be if the 1980-2008 growth trend had continued. “They are trying to put the best face they can on this, but the numbers are much worse even than people are talking about.”
While a Cold War-like conflict brews with Russia, a key supplier of Europe’s natural gas needs, this dismal economic performance now leaves the weight of the world on Mario Draghi’s shoulders.
The ECB president’s speech at the Kansas City Fed’s Jackson Hole confab has raised talk of a Fed-like “quantitative easing” program, prompting a buying frenzy in euro-zone sovereign debt markets. But it’s now imperative, says David Kotok, chief investment officer at Cumberland Advisors, that Mr. Draghi “put his money where his mouth is.”
If he doesn’t have the political support to launch aggressive stimulus, disappointed markets will tank, businessmen will become even more pessimistic, and the region’s economies and finances will collapse, Mr. Kotok says. And he warns that Russian President Vladimir Putin could then seize on Europe’s vulnerability to impose a winter gas blockade — making Mr. Draghi an “enabler to Putin.”
That’s a tough label to pin on the one guy trying to do something. And it seems very unlikely the ECB will fail to deliver. But it’s a fair reminder of what’s at stake.
While we’re talking about inaction, let’s recap that of the governments of the European Monetary Union.
For one, they failed to provide nearly enough fiscal support to households and small businesses hit hard by the euro debt crisis. They mistakenly thought that by committing to fiscal discipline they would restore confidence and spur growth. Plunging German business expectations now expose the folly of that theory.
Governments also did too little to forge greater political unity, leaving in place the structural flaws in the monetary union that fostered the crisis.
First: the area of banking. A new European Banking Authority was created to stress-test large banks and the ECB gained more centralized oversight of bank supervision, but bank policing power was left in the hands of compromised national central banks. Portugal’s failed Banco Espirito Santo highlights that model’s flaws.
And in the continued absence of a shared deposit insurance scheme, banks in crisis countries such as Greece, Portugal and Spain have unstable sources of funding as both depositors and investors doubt the sufficiency of EU backstop funds. Facing higher costs of capital, they rein in lending.
Other failures: no agreement to issue mutualized euro-zone bonds, which would have allowed every member to borrow at the same low rate; too little done to resolve the competitiveness imbalances that left Germany supplying everyone else’s goods.
This is the hand Mr. Draghi has been dealt. Let’s hope he plays it well.
by Alex Gurr
The silver market has been fairly active over the past week, and it’s likely to find some new direction in the coming week; even after a slow start with Labor Day in the USA.

The chart above says a lot about the silver market as of late, trending and consolidating. At present the silver market can’t seem to make its mind up other than trending lower, and there is still plenty of room to trend lower. But, more importantly, there are large patches of consolidation for traders – even after the false breakout we had last week. What this indicates is that even when there is little trending in the market, there are still movements to play.
At present, momentum has dissipated from the market, and traders are now starting to look for some direction. When it comes to trading direction, a shift lower seems more likely on the surface of things; after all you never go against the trend.
In the event of a breakout (which I deem to be highly unlikely, but still possible) markets will look for confirmation before trying to push higher. Candles with large wicks and strong pull backs are likely and volatility will certainly be strong in the market. I would look for at least two bullish candles before changing my view away from bearish in this market. Even then I would still be questioning if there was room for some bullish momentum in the silver market, or if this was just a bump from fundamental data, or silver trying to follow gold on the charts.
Either way you look at it, silver is set for a move and markets will be watching as a result, albeit with baited breath as there is plenty of opportunity for this precious metal, with a lot less of the crazy moves of gold.
by Agrimoney.com
Corn and soybean futures will "experience further downside" – but not too much - Rabobank said, while foreseeing revivals ahead in cotton and sugar futures.
The bank acknowledged the prospect of huge US harvests of both corn and soybeans, estimating the yield of the grain at 170-175 bushels per acre, above a US Department of Agriculture forecast of 167.4 bushels per acre.
For soybeans, if pegged the yield at 46.5 bushels per acre, and harvest at 3.985bn bushels, compared with USDA forecasts of 45.4 bushels per acre and 3.816bn bushels.
"As the record large US grains and oilseeds harvest progresses, conditions remain idea to realise the long-anticipated build in stocks," the bank said.
"Grain and oilseed prices are expected to experience further downside through 2014 as the new crops flow."
Above the curve
However, while cutting its forecast for average soybean futures prices in the October-to-December quarter by $0.20 a bushel to $10.00 a bushel, that remains above expectations among many observers for single-digit prices ahead.
Values retain some premium to account for the risk of an early frost, which remains a threat for the next couple of weeks, and are seen typically finding a seasonal bottom later in the autumn, under the weight of harvest supplies.
And Rabobank was marginally more upbeat than investors on the prospects for a post-harvest rebound in prices, seeing them average $10.60 a bushel in the first three months of 2015 and $10.75 a bushel in the April-to-June period, both figures above the futures curve.
For corn, the bank stuck with a forecast for prices to average $3.50 a bushel in the October-to-December period, reviving to $3.90 a bushel in the April-to-June period of 2015.
Last week, Bill Tierney, at Chicago-based AgResource, forecast corn prices averaging $3.40 a bushel this season, before falling below $3 a bushel from 2015-16 to 2019-20.
Sugar recovery
For sugar, Rabobank cut it price forecast for New York futures by up to 1.0 cent a pound, reducing its estimate for values in the October-to-December quarter to 17.5 cents a pound.
"Physical off-take remains tepid," contrasting with "heavy" near-term supplies, the bank said.
However, heading into 2015, its price forecasts remained above the futures curve, amid concerns over the viability of prices remaining at levels which have "traded below the cost of production for the last two years", at "unsustainable levels".
"The lack of area expansion and declining agricultural yields across key producers will continue to drive a tightening of the supply and demand balance in the upcoming seasons, as consumption growth outstrips that of production, supporting the longer term price outlook."
'Resurgence in physical demand'
In cotton too, Rabobank forecast a revival in prices beyond that investors are factoring in, highlighting that a tumble in prices since mid-June "has attracted a considerable resurgence in physical demand".
Inventories of old-crop cotton, outside China, "remain tight, and commercial participants have taken advantage of" the lower prices to purchase supplies.
And even in China, the bank forecast a "pick-up in domestic mill demand throughout 2014" as the state stops auctions from its huge state reserves,
The forecast for Chinese cotton imports in 2014-15 was upgraded to 10m bales, while the forecast for US production this year was maintained at 16.9m bales, below a USDA forecast for 17.5m bales, reflecting continued dryness in Texas, the top growing state.
by Rambus
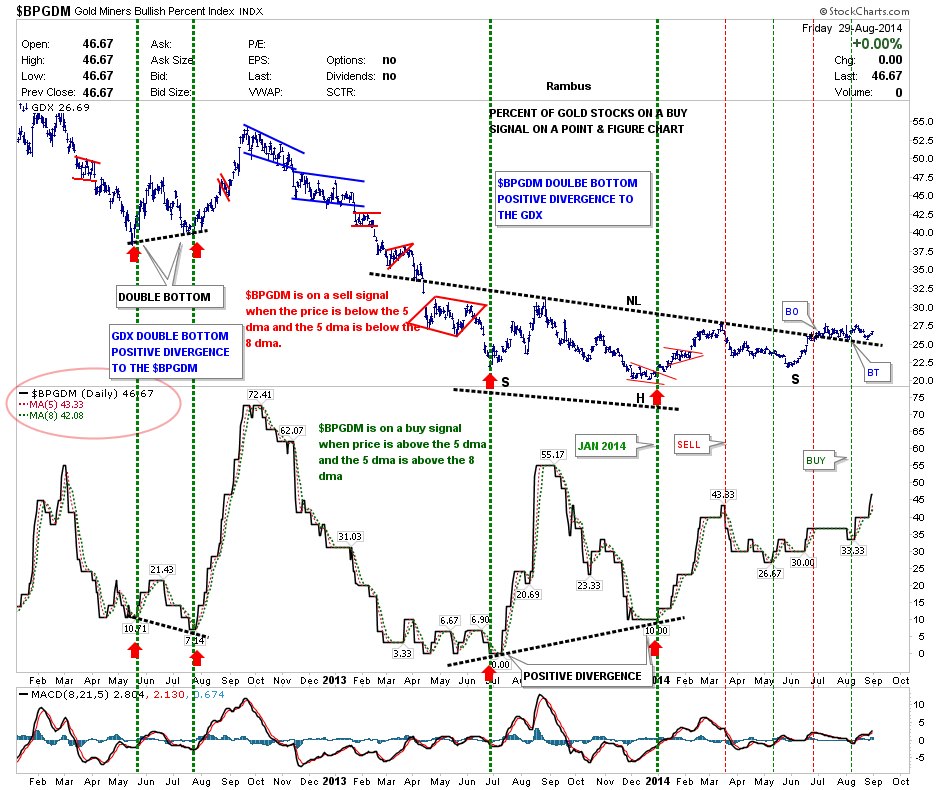
In this Weekend Report I’d like to look at some of the Precious metals stock indexes as there was a fairly strong reversal off of the previous lows made over the last two months. It was one of those inflection points where the PM stock indexes could have gone either way. It just so happened that they all had a decent bounce off the lows with the last two days being up. We’ll examine some of the PM stock indexes in a minute but I would first like to show you the BPGDM as it’s still on a buy signal that was generated three weeks ago.
The reading of 46.67 is the highest point the BPGDM has reached in about year so there is some underlying strength. The BPGDM is above the 5 dma and the 5 dma is above the 8 dma so the buy signal is in place. Also the price action is still finding support at the neckline of the potential one plus year inverse H&S bottom.
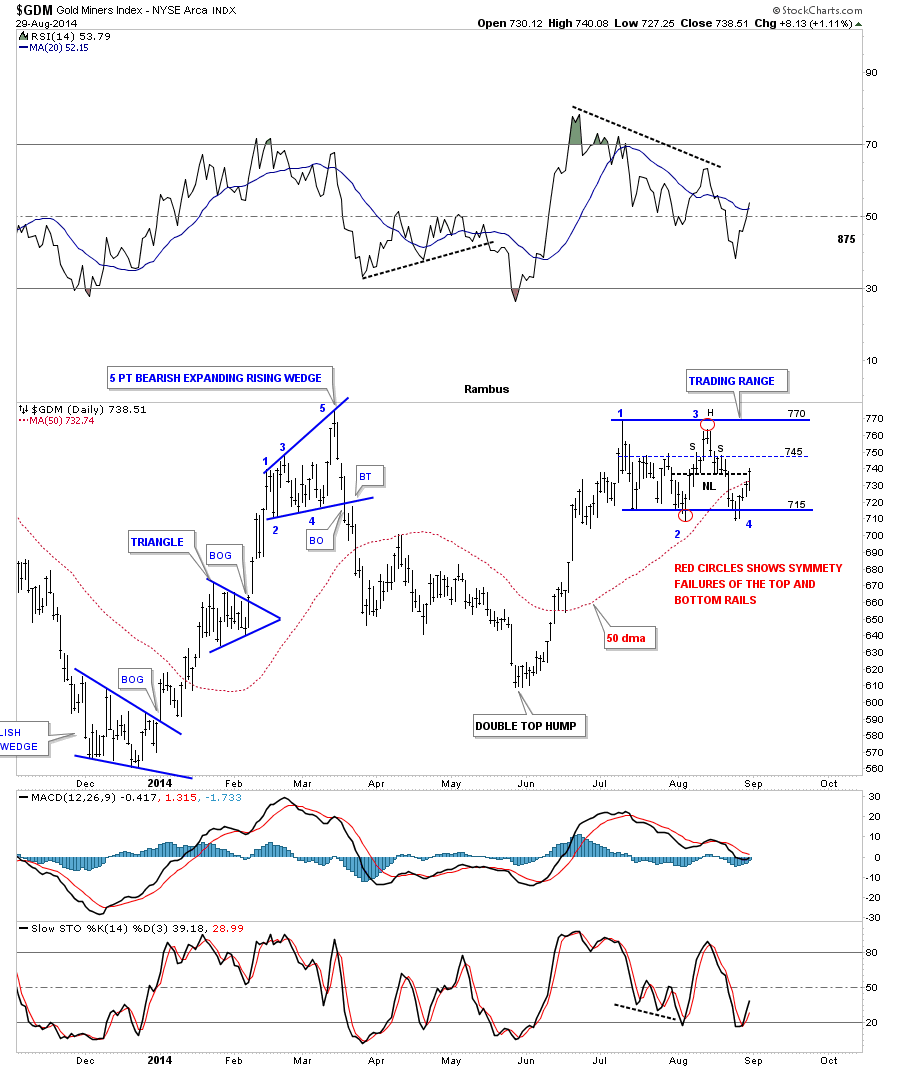
Lets look at the GDM which shows the price action this week hitting the bottom of the 2 month trading range and getting a nice little bounce. Reversal point #4 was the inflection point where GDM could have gone either way. Right now it’s finding some resistance at the neckline of the small H&S top that formed at the top of the trading range. Friday GDM close back above the 50 dma. We’re back to the same old question, is this 2 month trading range going to be consolidation pattern to the upside or will it end up being a reversal pattern to the downside. Since we don’t know I’m going to play the trading range until the true trend emerges. Sometimes these types of trading ranges can go on for a long time with several more reversal points taking place.
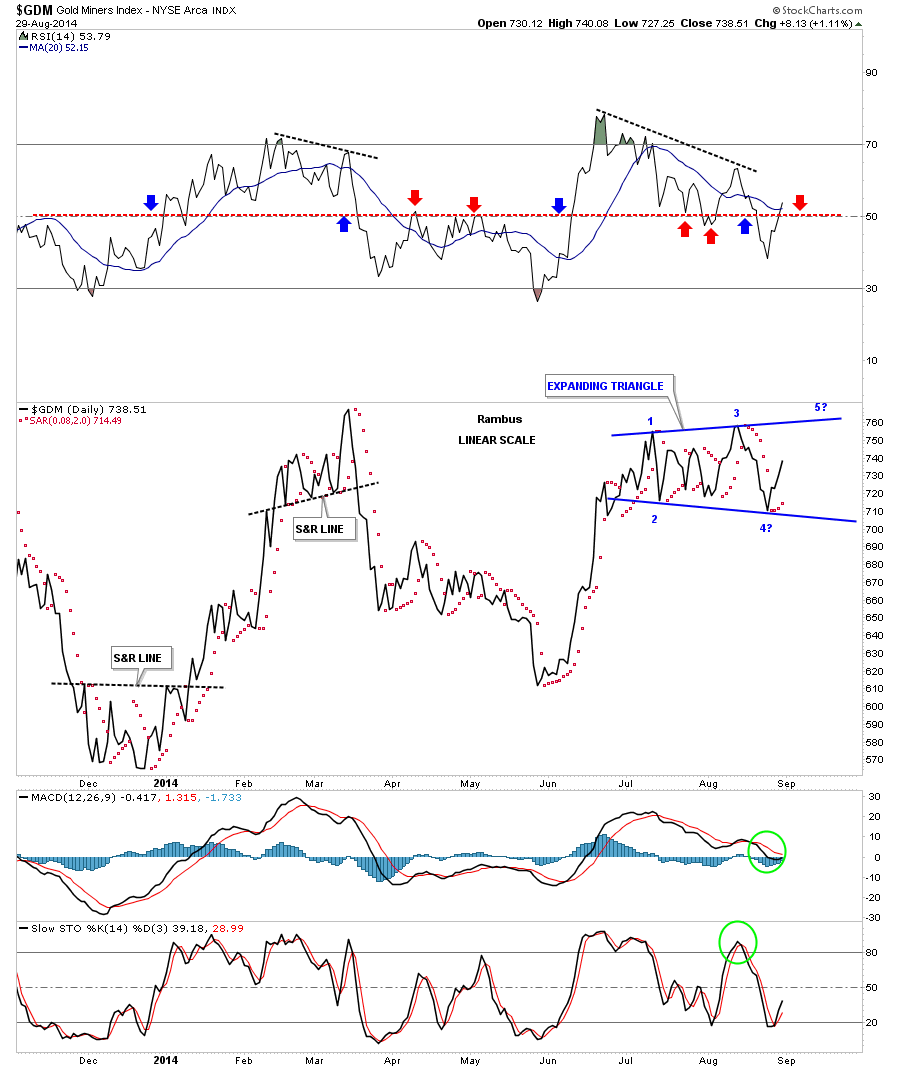
Below is a daily line chart that shows a potential expanding triangle forming with last weeks low breaking below the previous low as a possible 4th reversal point. Again this can be a consolidation pattern or a reversal pattern once we get some confirmation one way or the other. The expanding triangle won’t be complete until the top rail is hit at potential reversal point #5.
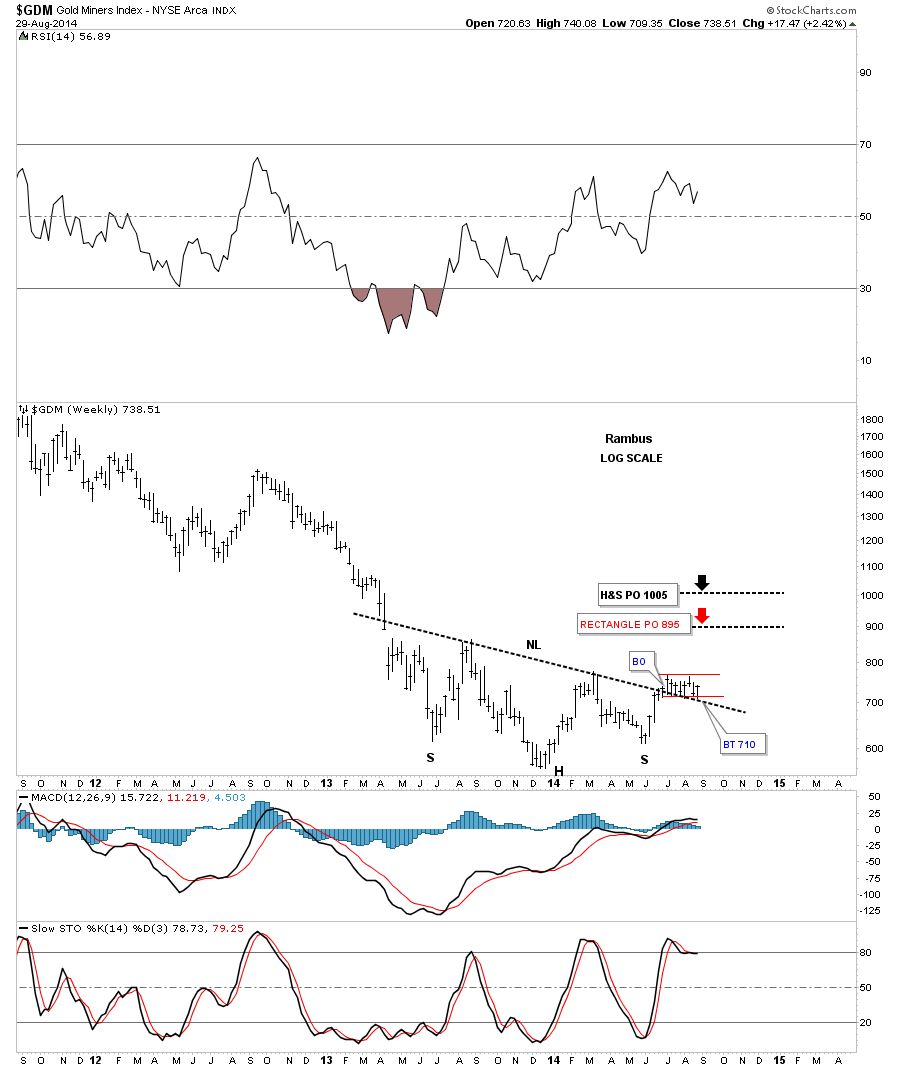
The weekly chart for GDM shows our potential inverse H&S bottom with the two month red trading range forming right on the neckline. The neckline held support again this week at 709 which is now a very important area to watch. I’ve added two price objectives if either the inverse H&S bottom or the red trading range plays out. Just keeping an open mind.
This next short term daily chart for GDM shows Sir Matrix’s four horsemen’s indicators that show the faster TSI and MACD crossing over with the longer term TSI and MACD getting close but not quite there yet.
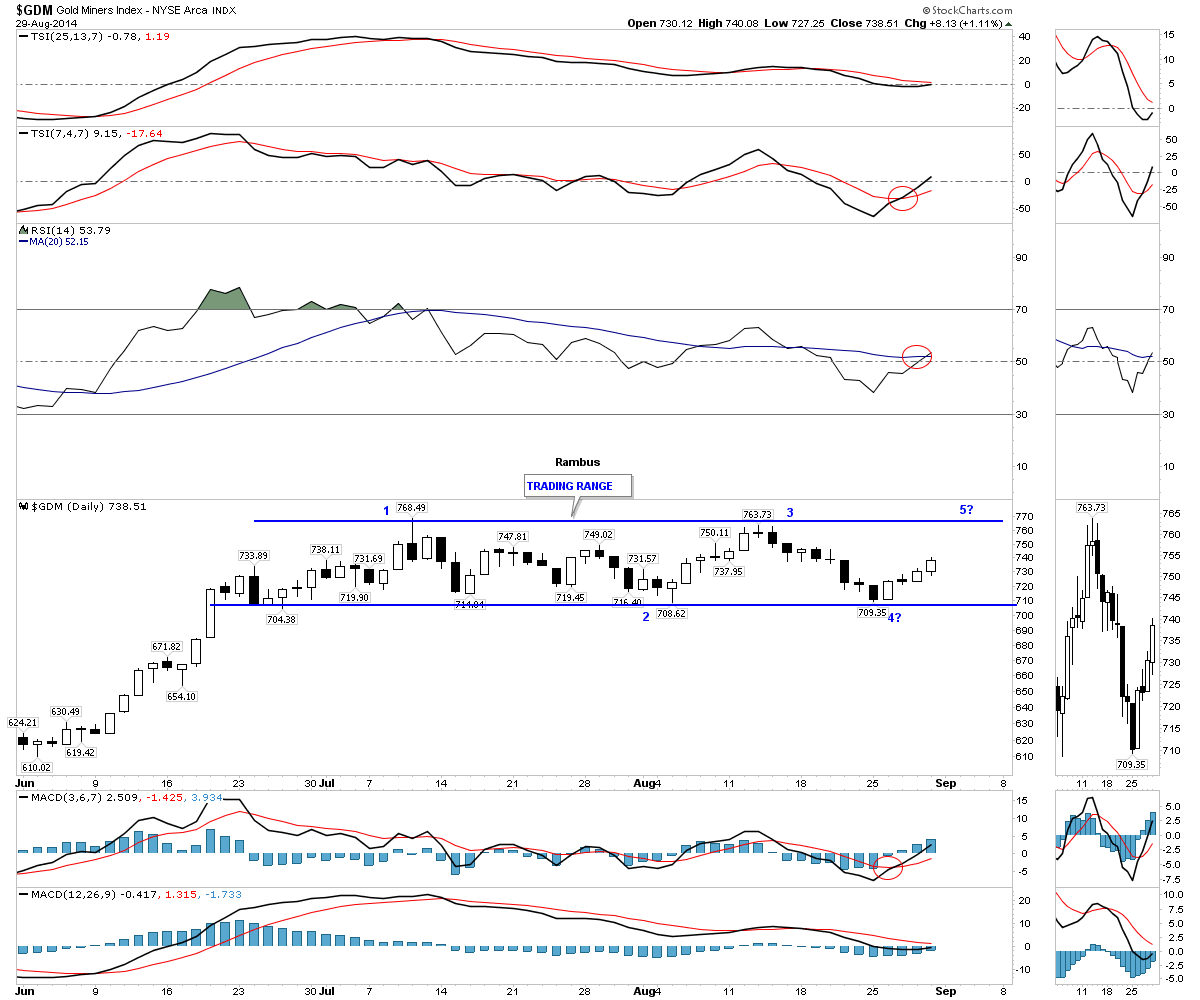
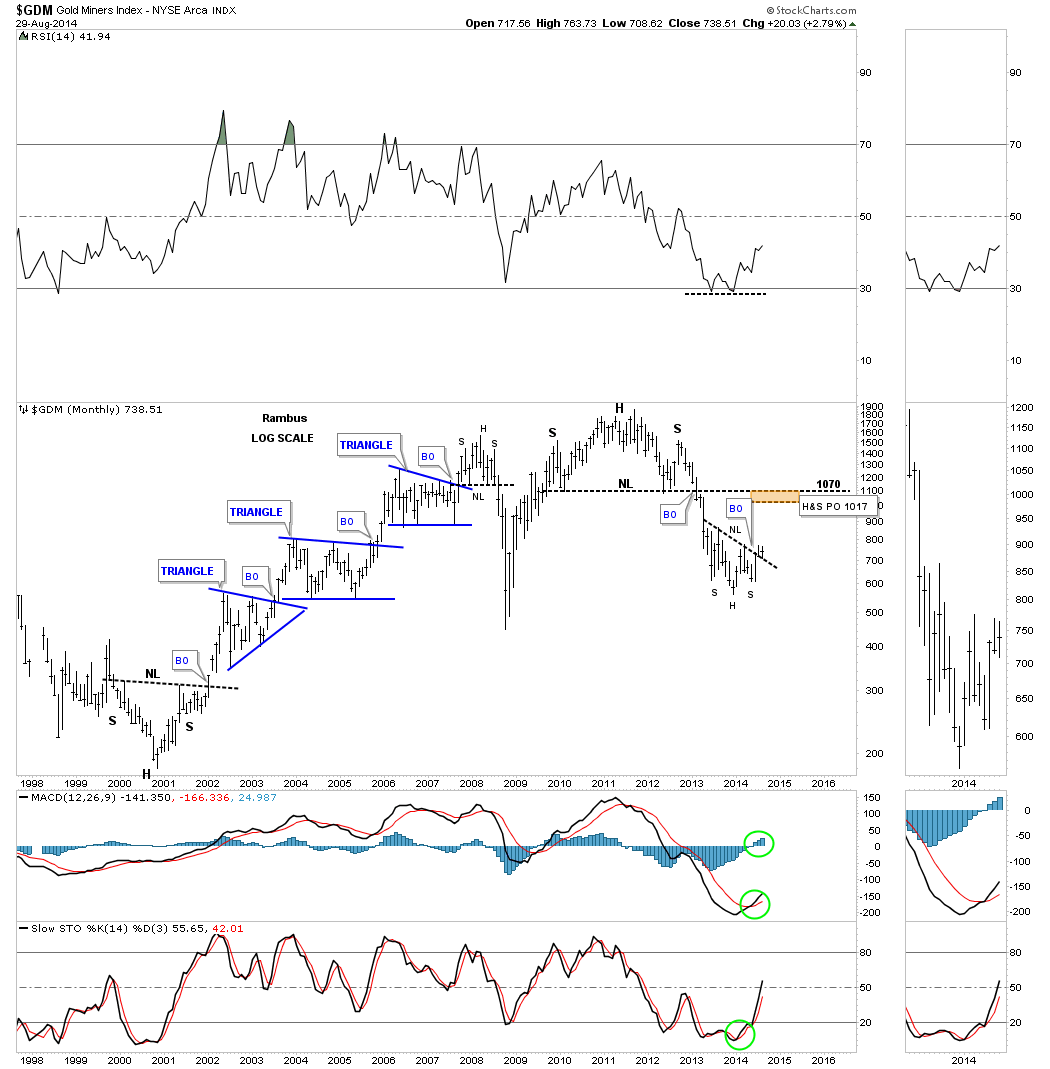
This long term monthly chart for GDM show how we could see the potential inverse H&S bottom play out to the upside that would take the price action back up to the old neckline around the 1070 area. If that were to occur the bulls would say the bull market is back while the bears would view this as a counter trend rally in a bear market which would be the camp I would be in. As you know anything is possible. I think most PM investors are either really bearish or really bullish leaving little room for compromise. If GDM breaks out of the 2 month trading range to the upside then I think this scenario would come into play. On the other hand if the PM complex stalls out right here and the GDM breaks below the bottom of the 2 month trading range, taking out the neckline at the same time, then the bearish scenario would come into play. Right now all we really have to work with is the 2 month trading range which we’ll trade until we get some confirmation of an impulse move either up or down.
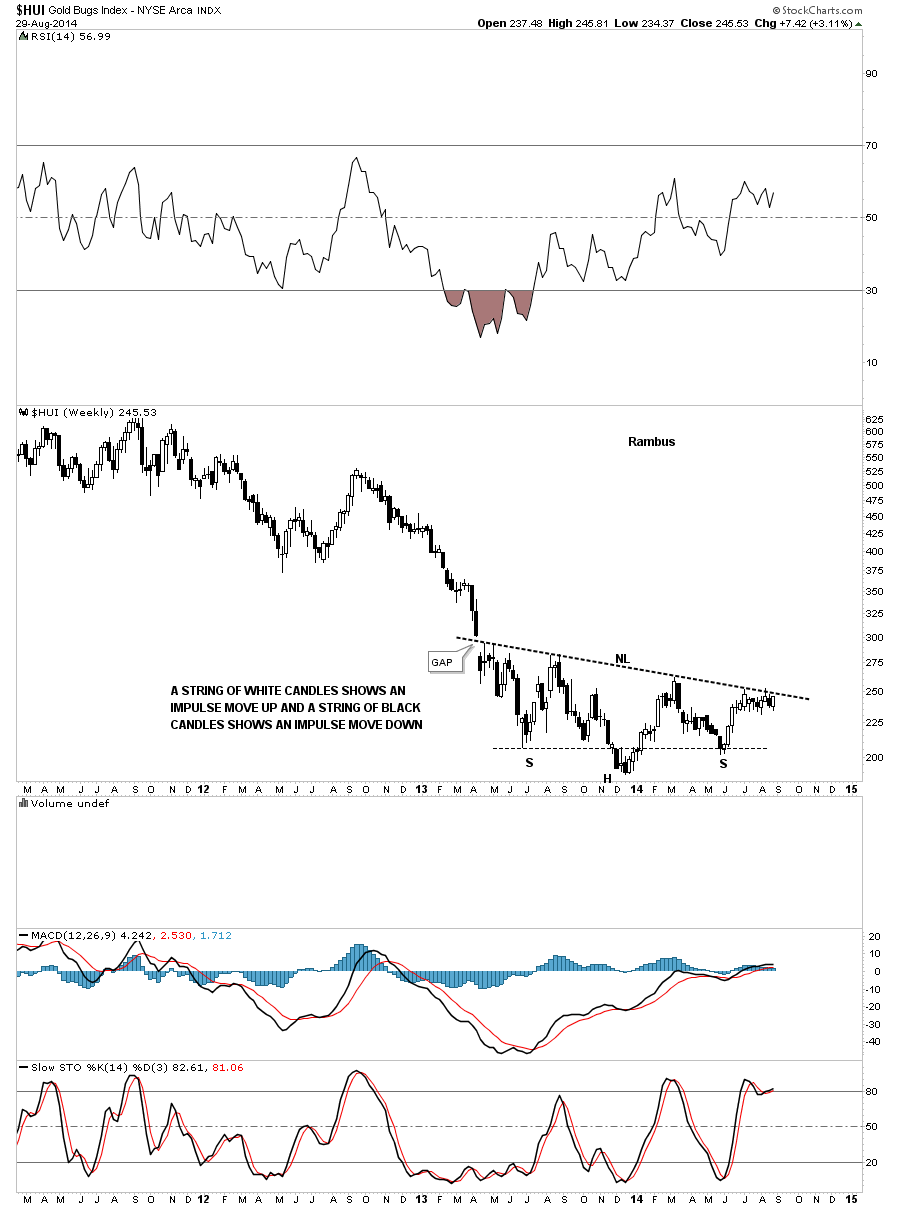
Next I would like to show you some weekly charts for some of the PM stock indexes that shows the potential inverse H&S bottoms we’ve been following for a long time waiting for some type of resolution. Lets start with just a simple weekly chart for GDM that shows its potential inverse H&S bottom. As you can see it has had a breakout and eight weeks of backtesting from the topside of the neckline.

The HUI has been one of the weaker PM stock indexes as it still hasn’t really broken above its neckline confirming a breakout. You can see the price action bunching up just below the neckline.
The XAU still hasn’t broken out yet either but it has tried several times to do so.

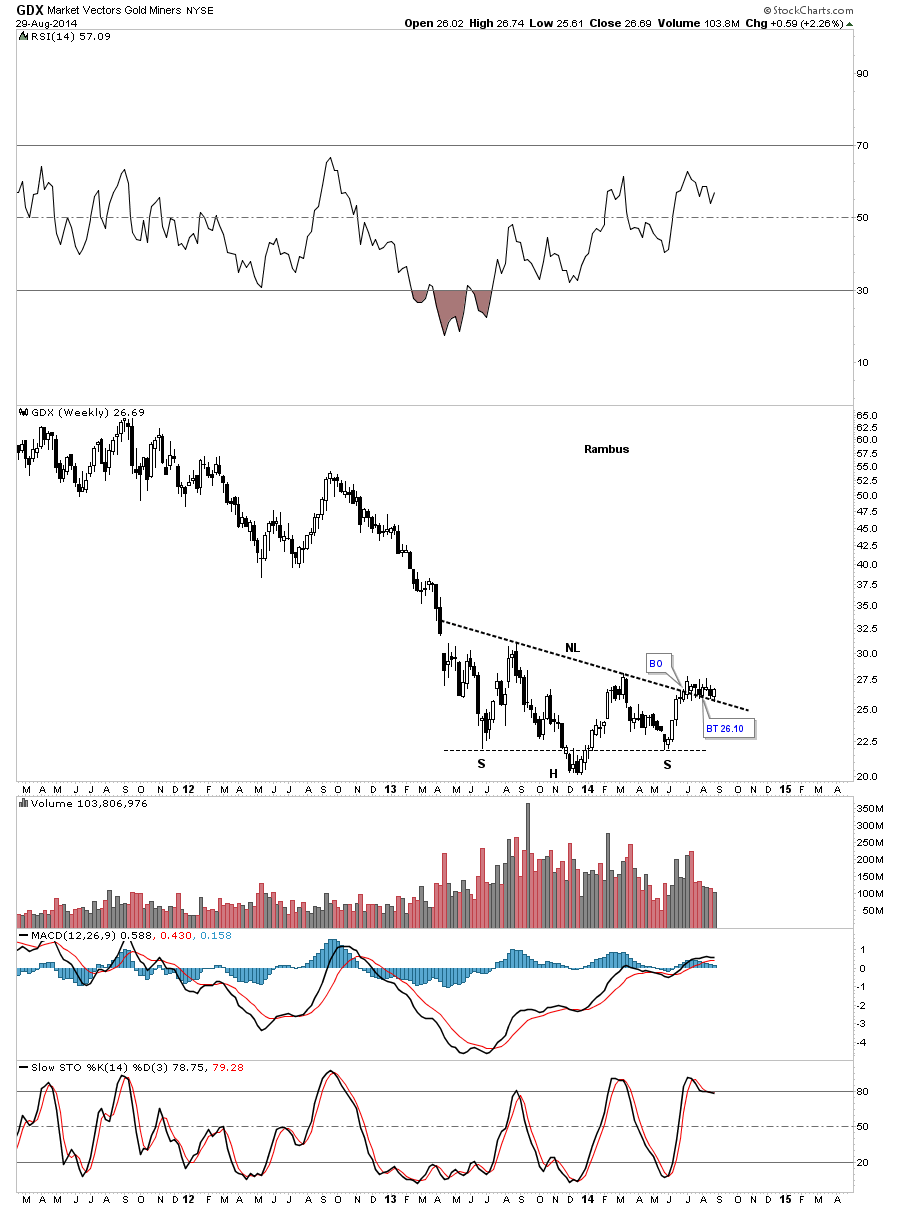
The GDX has broken out of its inverse H&S bottom in similar fashion to GDM and has been in backtest mode for 8 weeks now.
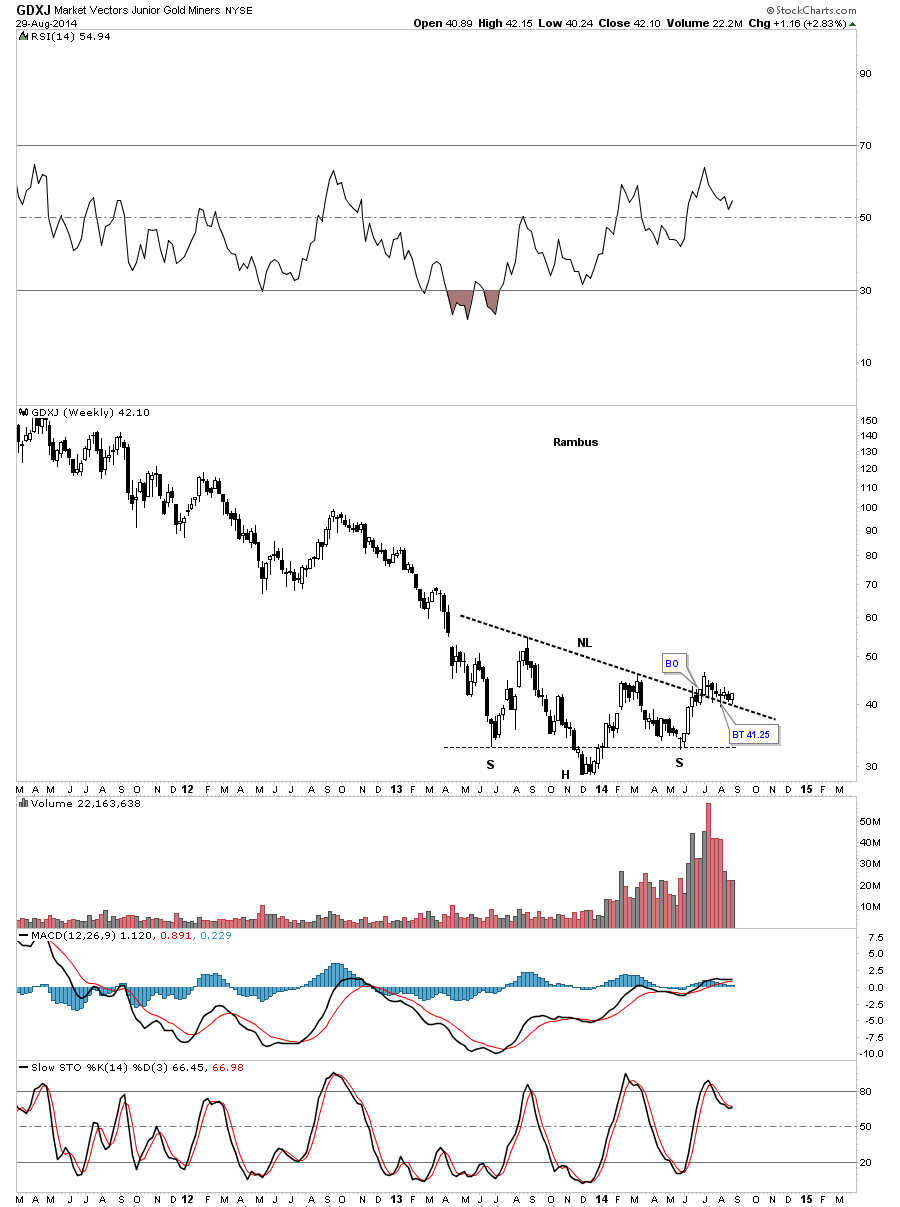
The GDXJ shows it too has broken out of its inverse H&S bottom and is still in the backtest mode.
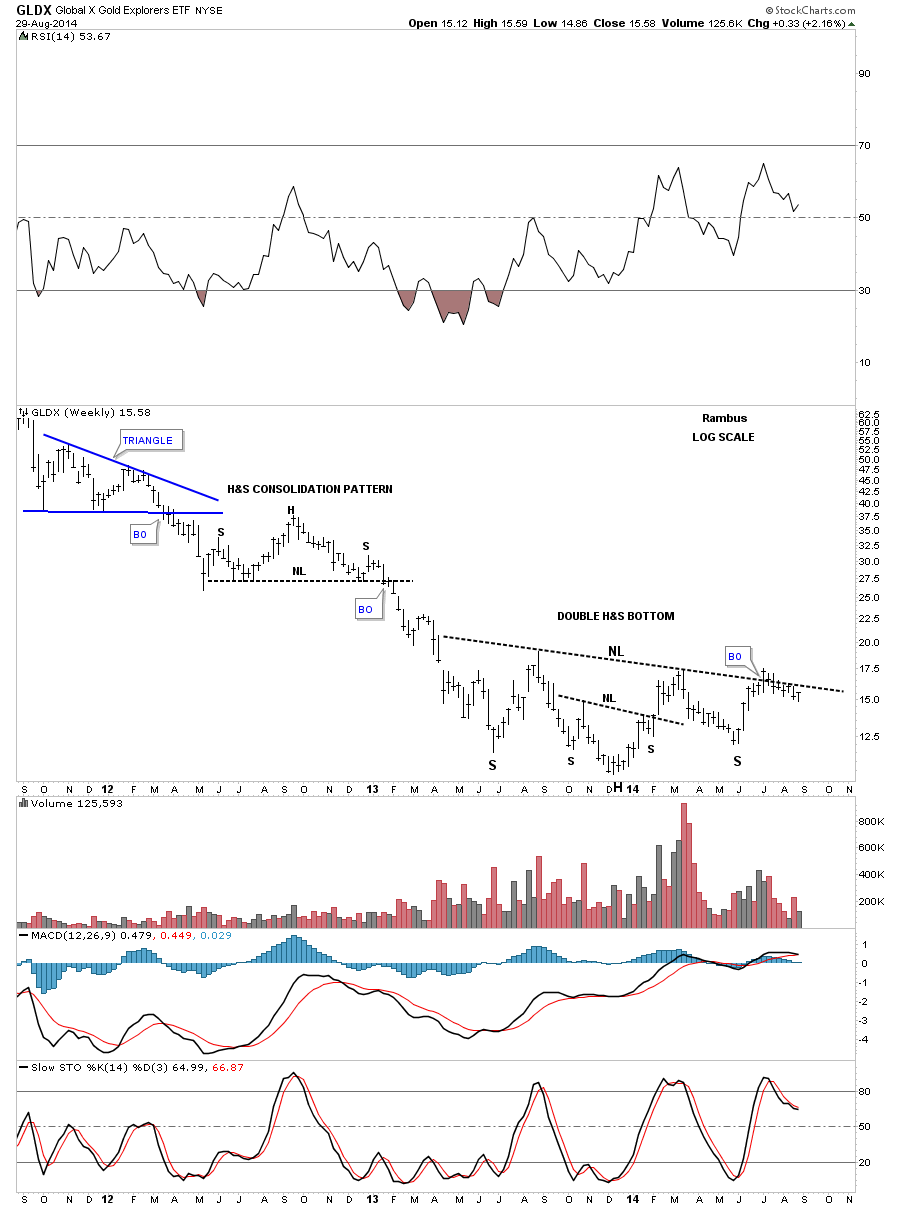
The GDLX, global gold explores etf, shows it has a potential double inverse H&S bottom but has failed to hold above it’s neckline so far.
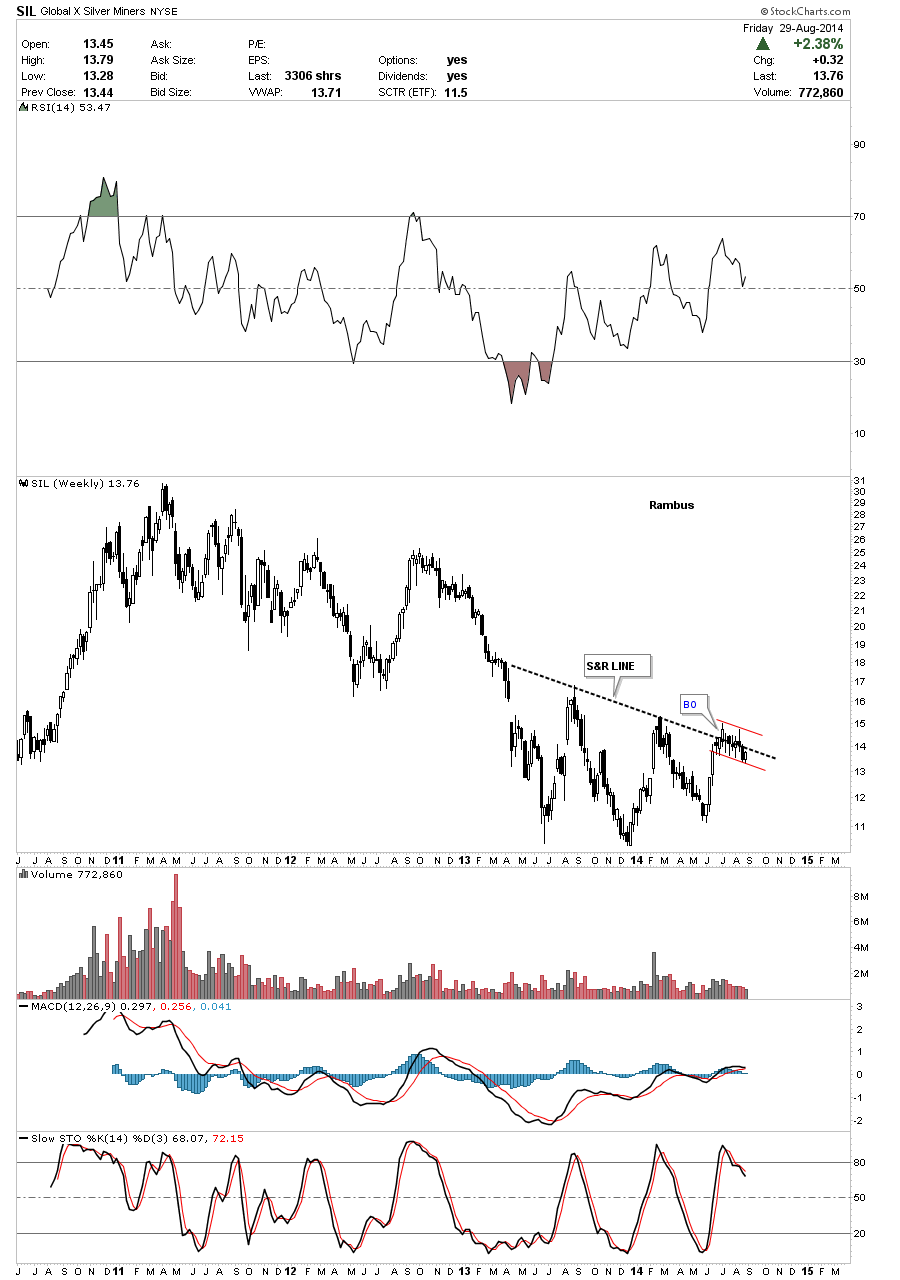
SIL shows what I call a 2 1/2 point double bottom with its 8 week consolidation pattern forming a red flag right on the S&R line.
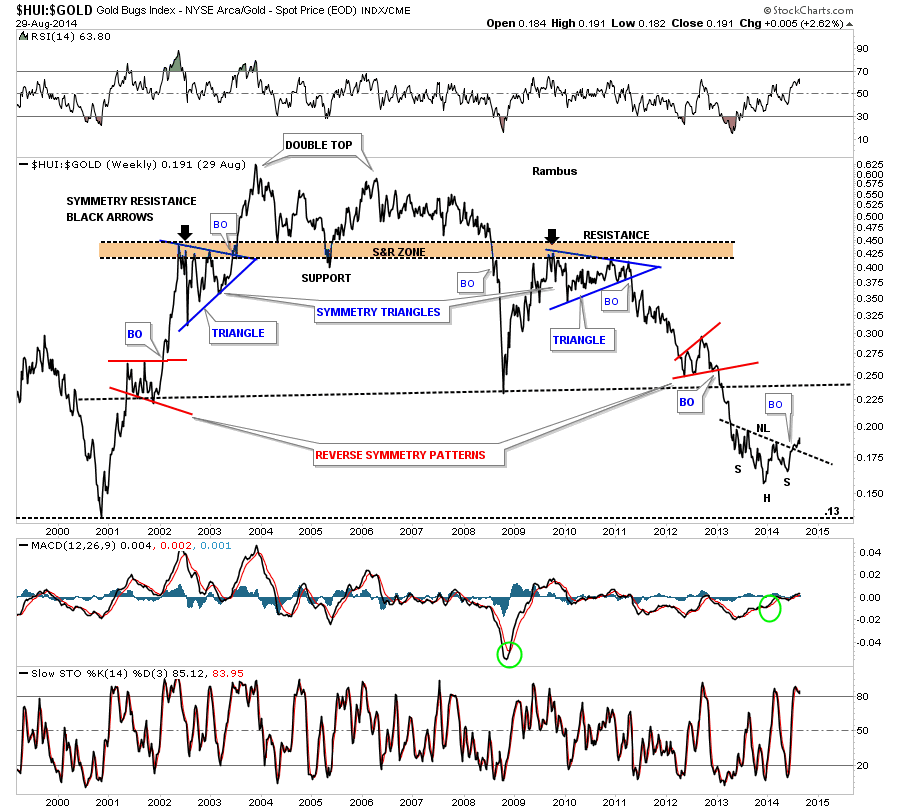
You may have become aware that the PM stocks have been acting stronger than gold lately. The HUI:GOLD ratio chart shows you why as it has formed an inverse H&S bottom. Keep in mind both can fall together but if gold falls faster than the HUI the ratio will still show a rising price trend so it can be a little deceiving at times.
The weekly chart for silver shows its been walking down the black dashed S&R line that has been holding support since it was broken to the upside earlier this summer, reversing its role from resistance to now support. The million dollar question is will it continue to hold support?
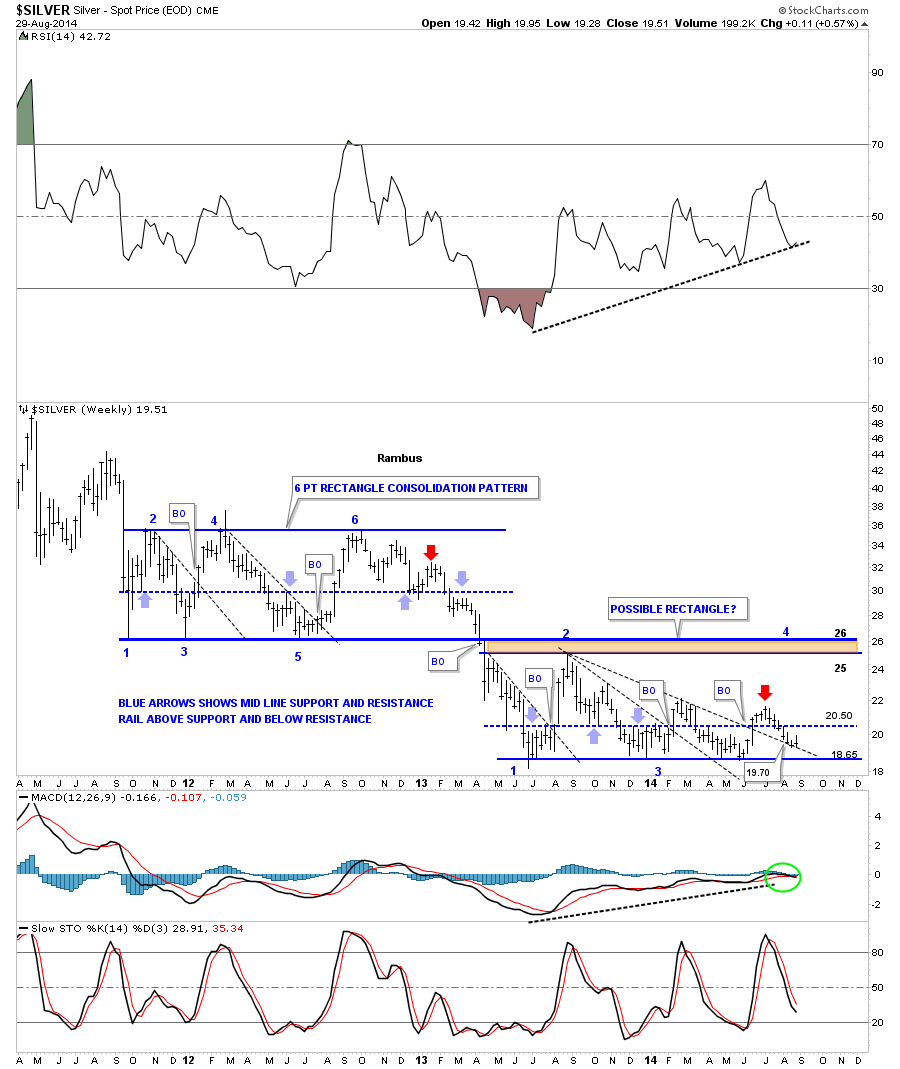
Silver’s inflection point. This is the point where silver has to start showing some strength in here or it could be bad news for this precious metal. The situation can still be saved if it can start to rally immediately.
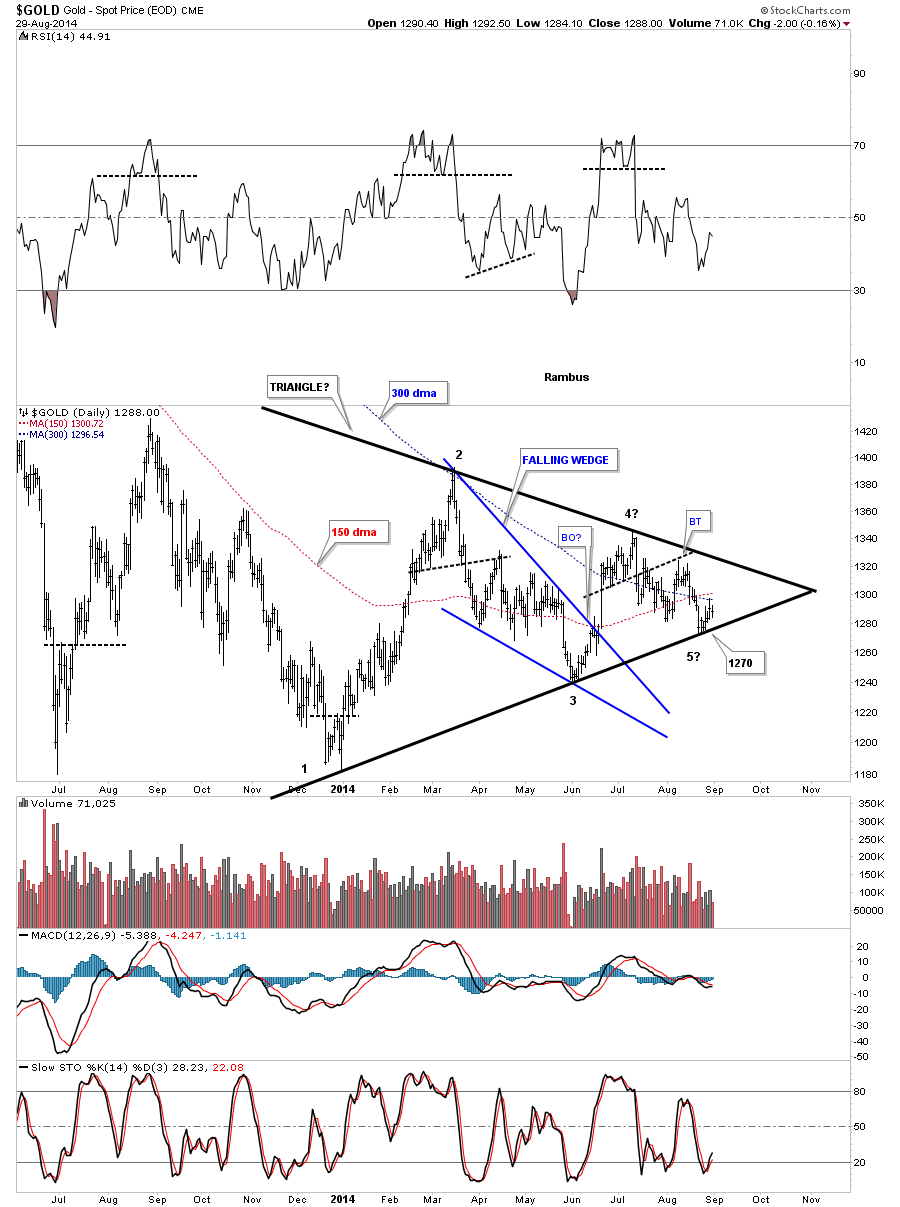
The daily chart for gold shows you the triangle we’ve been following in which I said to watch the potential 5th reversal point for a short term bounce and then the break of the bottom trendline. The other scenario was that if gold showed more strength, down at the inflection point at reversal point #5, it was possible to see gold rally back up to the top rail. So far we’ve gotten the initial bounce now we have to see how strong gold really is if it can keep on rallying.
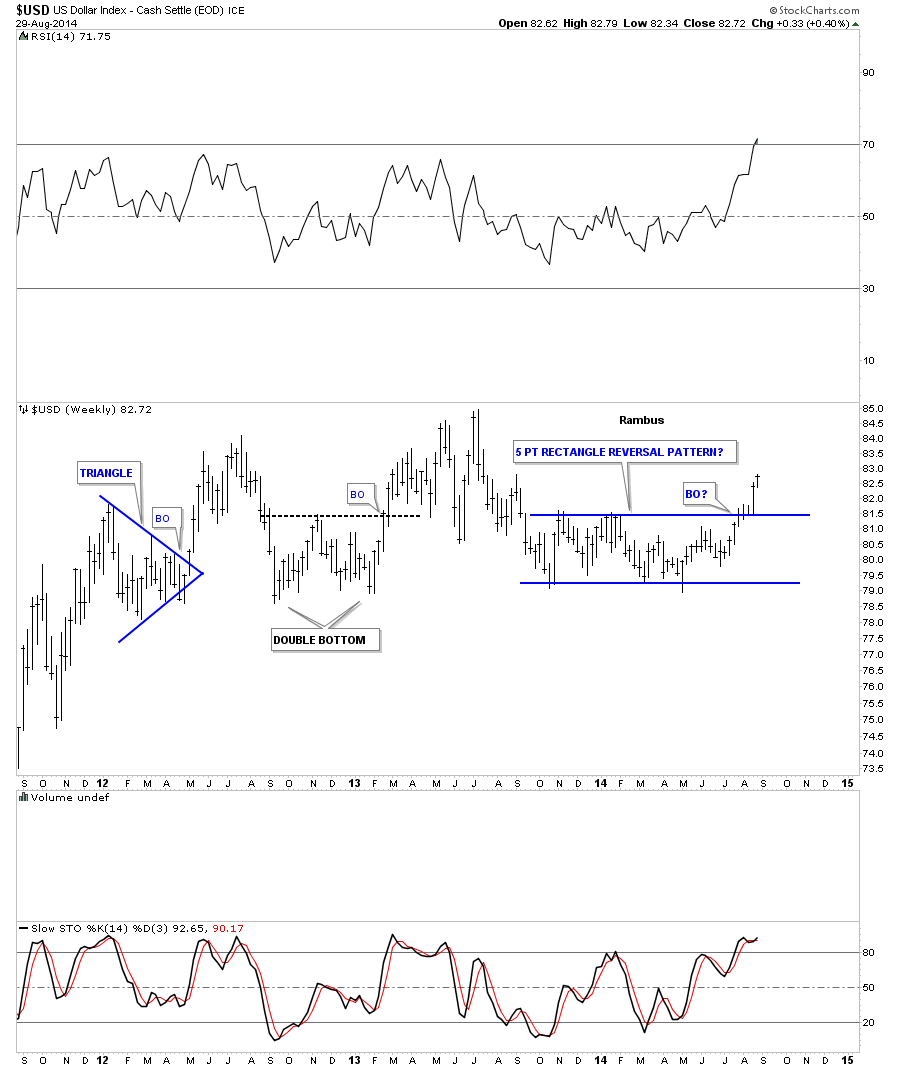
With the US dollar showing strength in here it will probably produce a headwind for the PM complex.
The Japaneses Yen is quite oversold right now and could see a backtest to the underside of the blue triangle it broke out of several weeks ago. This could give gold a little boost for awhile if that were to happen.
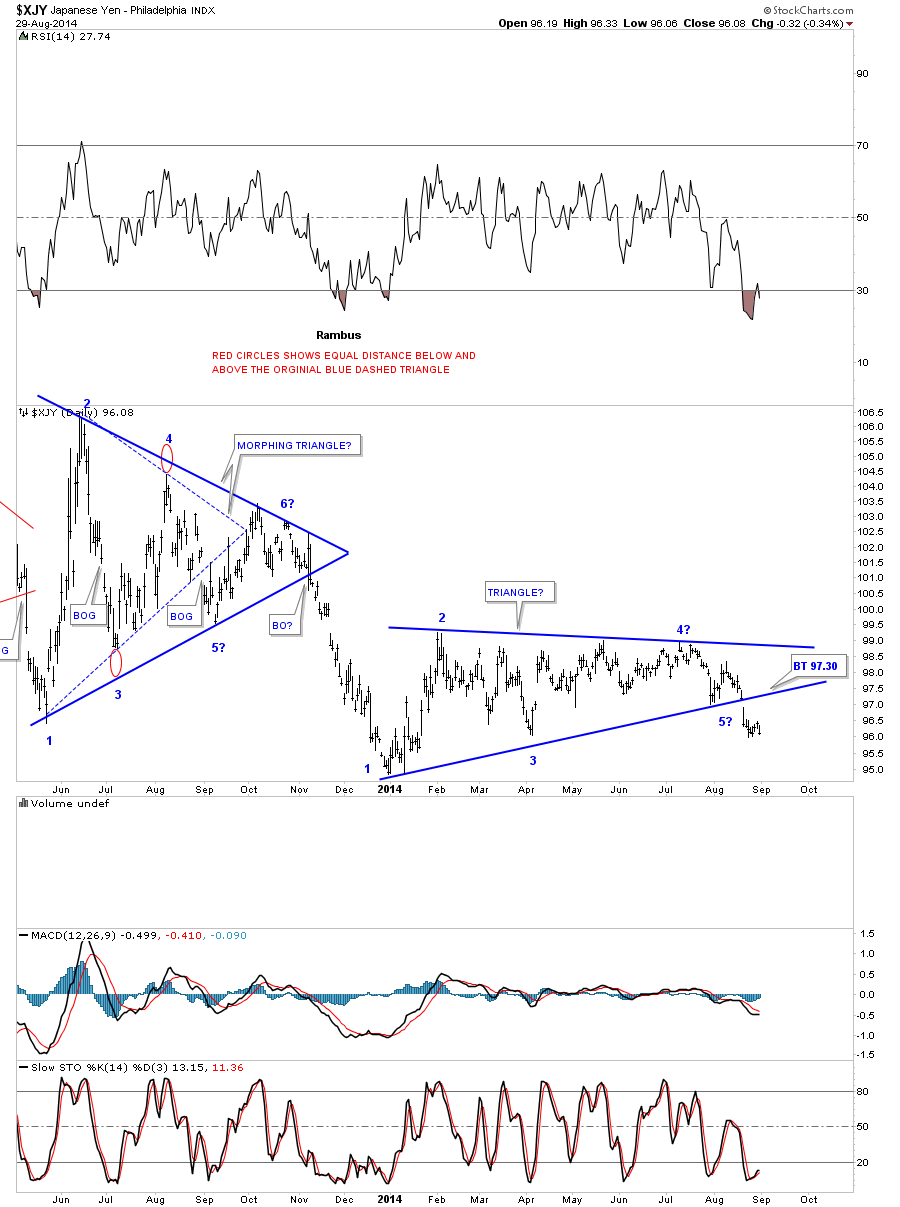
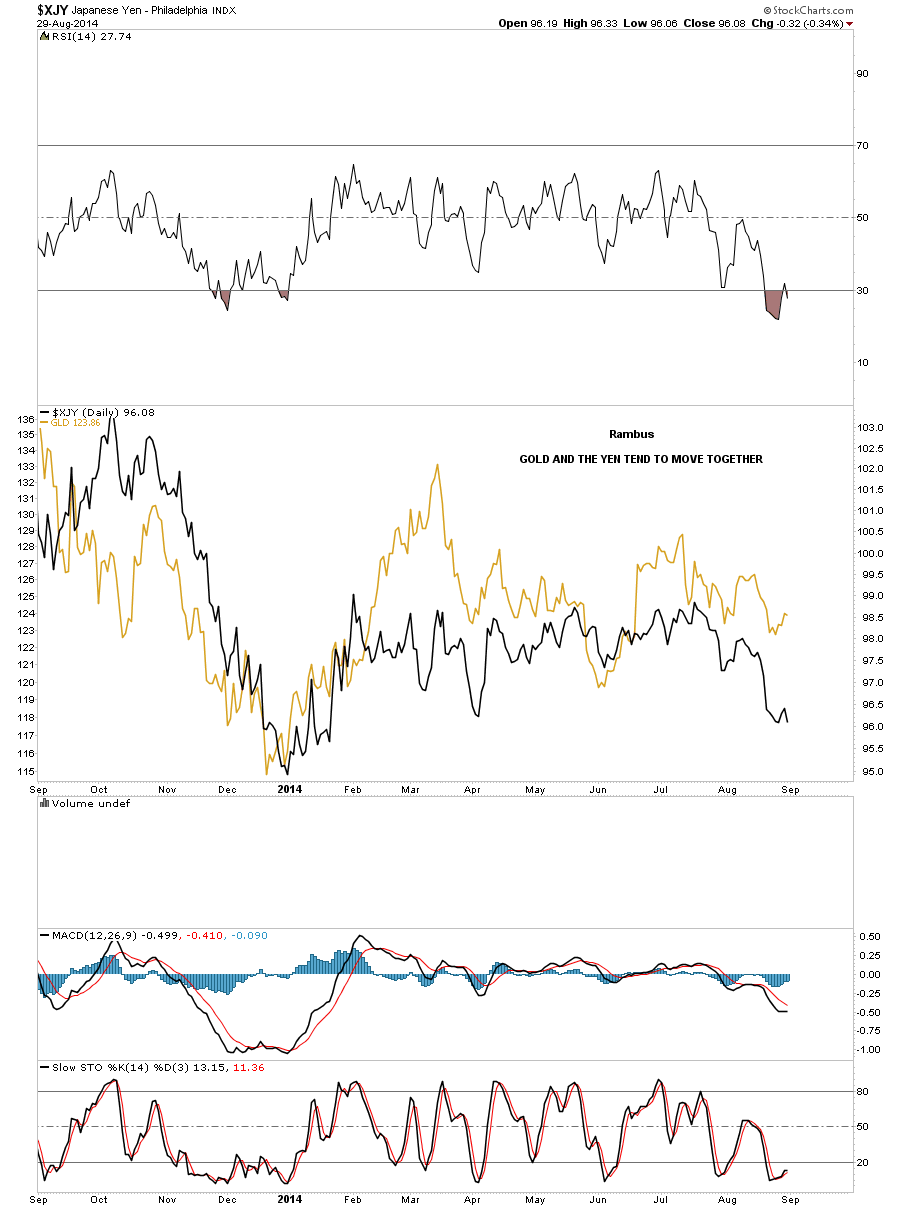
On this last chart for tonight I’ve overlaid gold on top of the yen. As you can see the correlation is pretty close. This past week tho the correlation wasn’t as good as it has been. As I said it’s not perfect but they generally run together.
I have spent a lot of hours this weekend going over many PM stocks from the juniors to the large caps. If, and this is a big if, if we see some strength this week in the precious metals stocks I will start posting some entry points for a short term trade. At this moment we are in the middle of the 8 week trading range so this is how we’ll trade the PM complex until we see confirmation of a move one way or the other.. We’ll sell at the top and buy the bottom. The stock markets are still in rally mode but with the SPX and the Dow trading at their all time highs we may see a little hesitation before going higher. It should be an interesting week as the summer doldrums should now be over. All the best…Rambus
By: Clive_Maund
Gold and silver are at a critical juncture - either they break down to new lows soon or a major new uptrend is about to start. Which is it? - while we cannot be 100% sure either way, we can certainly attempt to figure which way they are likely to break.
Many have been tempted to conclude, because of the dismal response to date by the Precious Metals to the growing geopolitical tensions in various regions of the world, that this is an indication of intrinsic weakness, and that they are therefore destined to break down soon, but there is another way of looking at it.
The vast majority of investors have no idea just how dangerous the worsening situation with Russia really is. The West is looking for trouble with Russia - and like most people who go looking for trouble, they are going to find it - this is a situation that could quickly lead to a World War. They have made it obvious that they are not interested in compromise - they want to overcome and subdue Russia, and the consequences are likely to be grave - especially for Europe which is on the front line. We have gone into this in detail on the site and will not look at it further here, but it deserves to be mentioned at the outset, because this could drive a meteoric rise in Precious Metal prices - and it could start with a big move that seems to come out of nowhere.
With this in mind let's now move on to look at the latest gold charts.
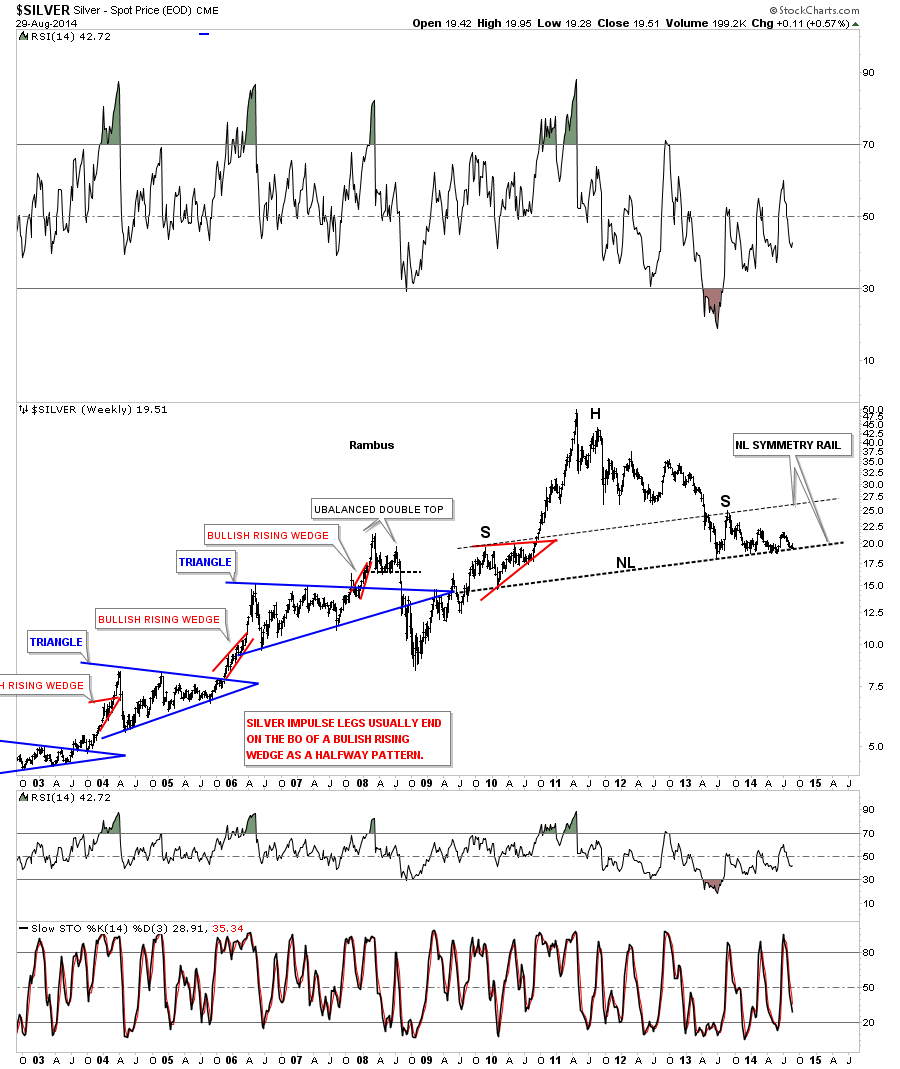
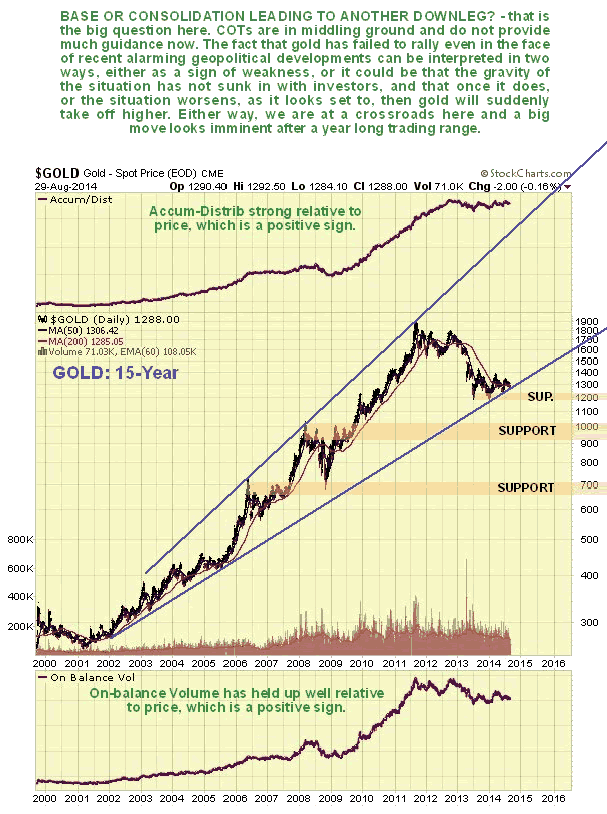
We will start by looking at gold's long-term chart, as we need an overall perspective from the start. On gold's 15-year chart we can see that despite the rough time it has had over the past 3 years, it still hasn't broken down from its long-term uptrend - and if this uptrend is valid, then it is clear that a huge upleg could be in prospect from here. If it were to run to the top of its major uptrend channel again, it would result in a massive increase in the price to the $4000 - $5000 area. Of course, the pattern that has formed over the past year could be a continuation pattern to be followed by a breakdown and another steep drop, but this doesn't look like it is on the cards as it would require a significant easing of geopolitical tensions, considered highly unlikely, and a deflationary implosion, which the money printers will "move heaven and earth" to avoid. Volume indicators on gold's long-term chart look positive relative to price, with Accum-Distrib line in particular looking strong. This chart makes plain that we are at a critical juncture here.
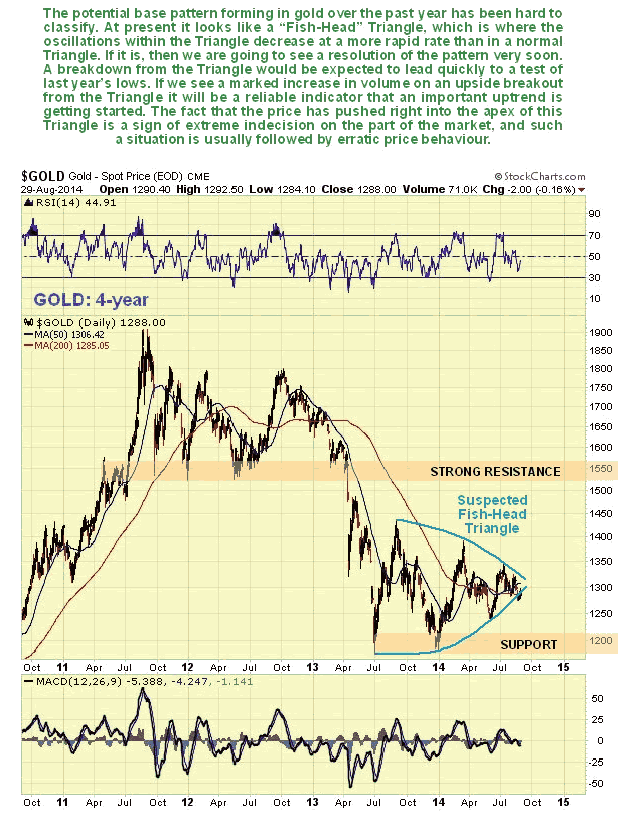
On its 4-year chart we can see that gold has pushed right into the apex of a "Fish Head" Triangle, which is a type of Symmetrical Triangle, where the boundary lines slope inward. The fact that it has pushed into the apex of the Triangle without a clear breakout is a sign of extreme indecision, and is often followed by a period of erratic price swings before a clear trend becomes established - what sometimes happens is that it breaks out in one direction, a false move, that is followed by a violent reversal in the other direction. At this point we are still in the overall neutral trend that began over a year ago.
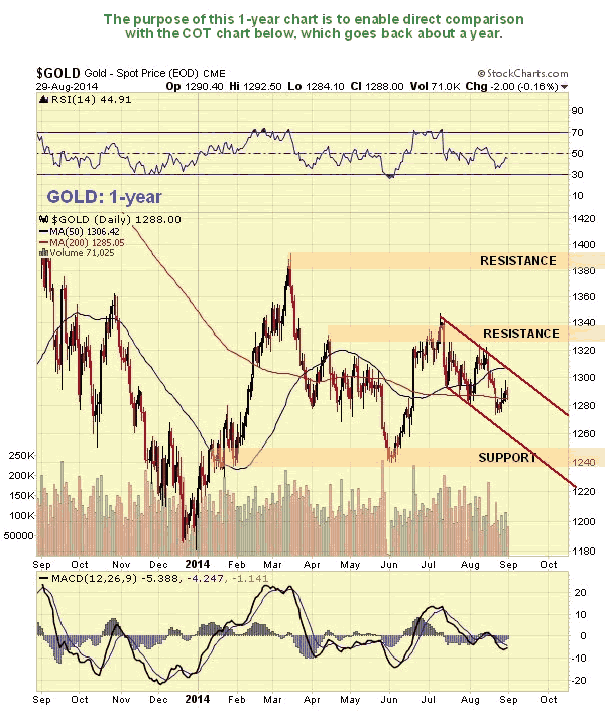
The main reason for the 1-year chart below is to enable direct comparison with the COT chart for gold shown immediately below it, which goes back about a year.
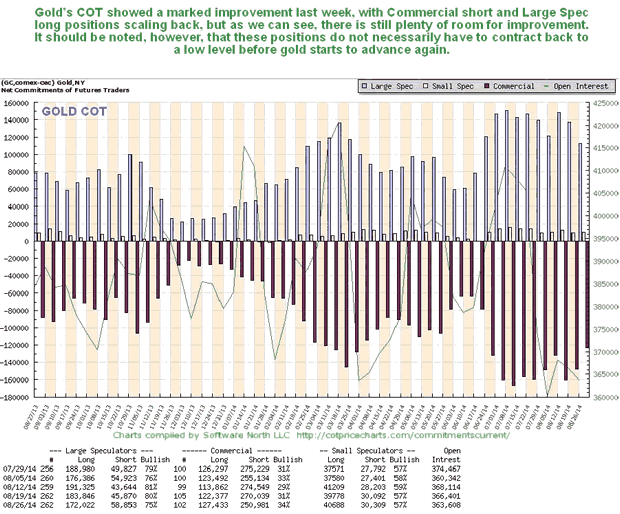
Gold's COT chart has been unfavorable for many weeks, as we can see below, which is a big reason, along with the strong dollar, why it has been so weak in the recent past. Last week we saw a marked improvement for the 1st time, and while there is clearly room for further improvement, we should keep in mind that it does not have to drop back to a low level before gold can turn up again.
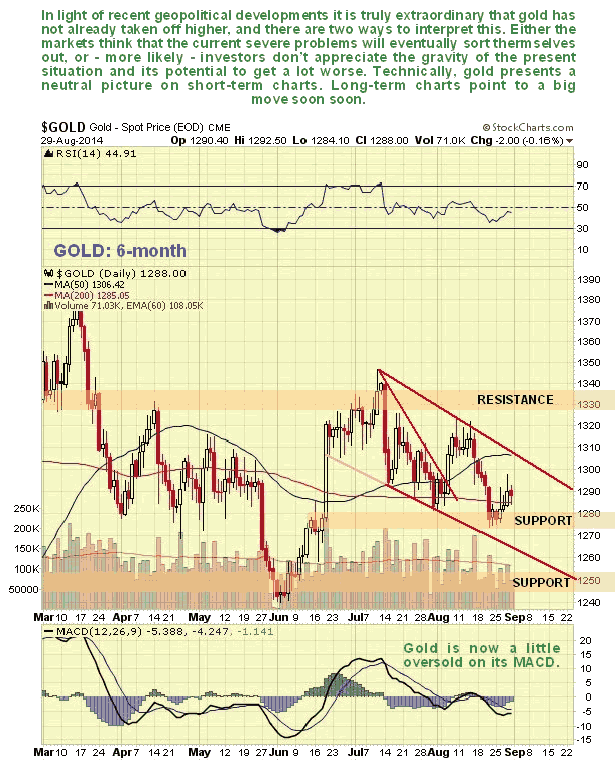
On the 6-month chart we can see that recent action has been rather messy and indecisive. We called the top in July to the day in a Gold Market update at the time, and also the later breakout from the Falling Wedge a few weeks later early in August, and said that it wouldn't get far before turning down again, and it didn't. Overall the action from early July doesn't look bearish, and looks like a reaction to correct the sharp advance in June, pending a more bullish setup for gold. This is still a neutral picture overall and a breakout above the downtrend will be clearly be a bullish development - and all the more so if it should with a big move on strong volume.
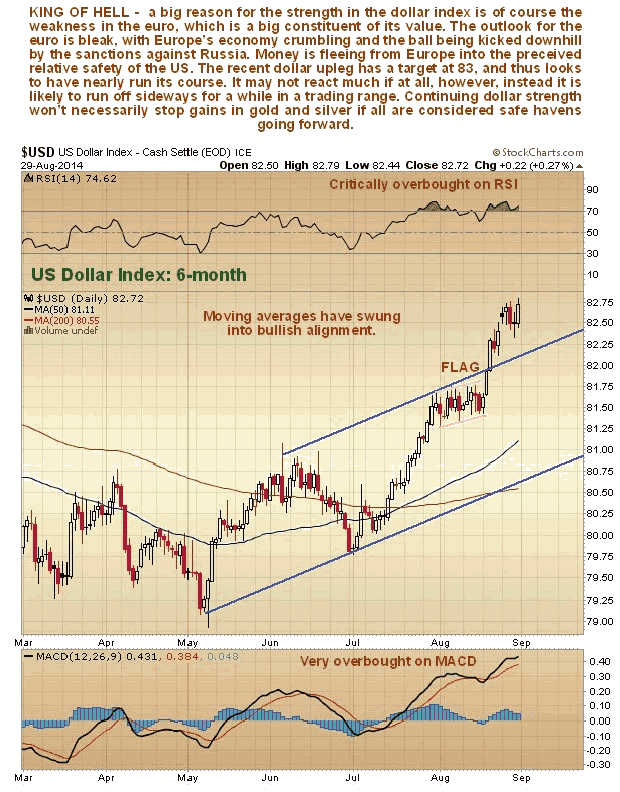
The dollar's recent strength is of course a big reason for gold's recent weakness, and while it doesn't look to be over, it might take a breather soon as it is overbought. It is a tragic irony that by doing Washington's bidding and going on the warpath against Russia, Europe is "digging its own grave" not just militarily, since it is in the frontline should a major war erupt, but economically as well - already mortally weakened by years of bureaucratic bungling and incompetence, it is facing the collapse of the euro and disintegration. This is a big reason for the dollar's strength as investors leg it out of Europe to the relative security of the US. On the 6-month chart for the dollar index we can see its robust rally of the past 2 months, and its latest advance out of a bull Flag, which has almost hit target. We didn't see this last upleg coming in the latest Gold Market update, but did in an update on the site before breakout from the Flag occurred. The dollar is heavily overbought here and thought likely to consolidate for a while - it is considered unlikely that it will react back much, if at all, because of funds fleeing beleaguered Europe. Here we should note that continued dollar strength is unlikely to stop gold advancing, as both will be considered safe havens as the global geopolitical situation continues to rapidly deteriorate.
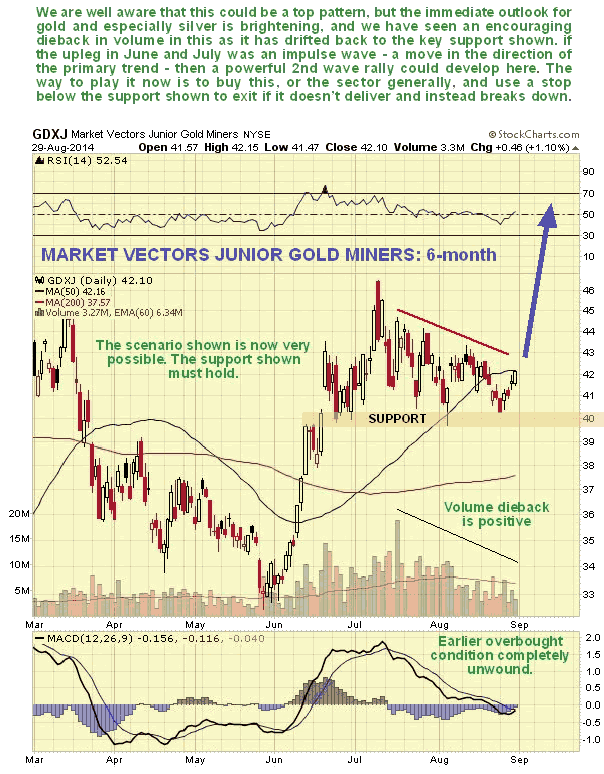
What about gold stocks? We have been concerned for some time that another top may be forming in PM stocks indices, partly because of the continuing high volume as they tracked sideways after their June - early July runup, but volume has dropped right back in recent weeks as we see on the 6-month for GDXJ below. This is a positive sign suggesting that the strong June - early July upleg was an impulse wave, i.e. a move in the direction of the primary trend. If it was then another strong upleg is likely to start soon. The support shown in the $40 area must hold, and it can be used as a general stop-loss.
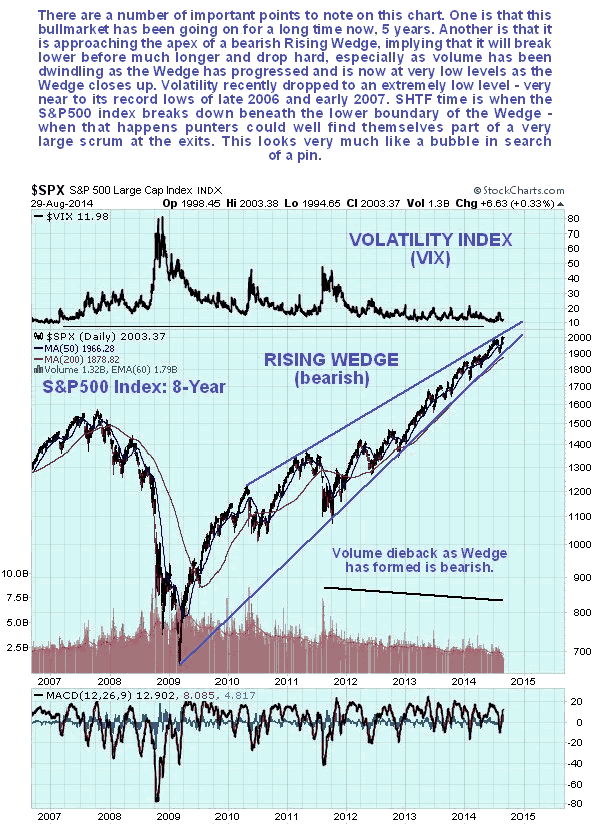
The long-term 8-year chart for the S&P500 index continues to look like a catastrophe waiting to happen, a huge bubble searching for a pin. We can see that the massive bearish Rising Wedge that has formed from the early 2009 lows is closing up and volume has continued to dwindle to a very low level - in this situation if heavy selling emerges there will be no bids, and the market will plunge vertically - you sure don't want to be around when that happens. It looks about done here and is considered to be at a good point for shorting/Puts. With Puts you adopt a "swing till you hit" mentality. You might see the 1st or 2nd tranche expire worthless and then hit the jackpot when it caves in. Go for cheap out-of-the-money ones, so you don't lose much if it doesn't work out.
Follow Us