by Greg Harmon
The Nasdaq 100 has a long history for being the index for technology stocks. This was a great assumption for the early 2000’s, but now the index is laden with biotech companies as well. This has been good over the last few years as the strength in biotechs has benefited the Nasdaq while tech stocks have weighed it down. This has propelled the Nasdaq 100 near the 2000 highs, the height of the tech bubble. This is the last major index that has not made a new all-time high. Perhaps a rally in tech names will get it there. But the chart suggest it might take a while.
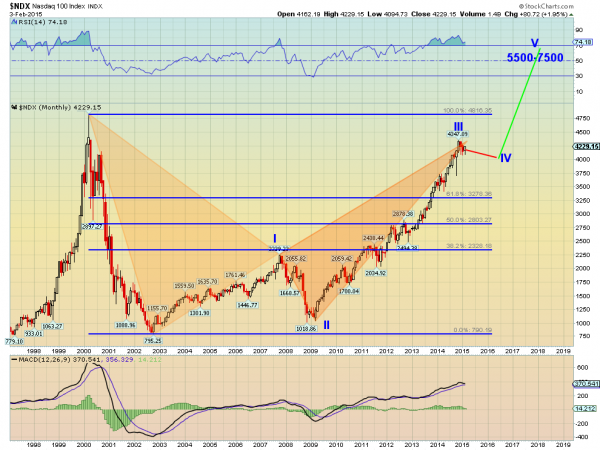
The monthly chart going back past the tech bubble peak is very clean. There are two main stories involved. The first is the harmonic Bat playing out, shown by the two triangles. This bearish Bat is just 11 Nasdaq points away from the Potential Reversal Zone (PRZ) at 4358. Close enough for chart art. A move lower from here would look for a retracement of 38.2% of the pattern, or to 3278.
But the funny thing about a harmonic Bat is that it can morph into a harmonic Crab. No magic spell involved, just a continuation over 4358. This would move the PRZ to 6350. There are a couple of ways this could happen. It could just continue higher. It could pullback, but less than 38.2%, and then move up to the new PRZ, or it could move sideways and then higher. Of the three, the last two carry a higher probability.
There are a couple of reasons for this. First, the index is overbought on the momentum indicators. The RSI has been running over 70 for over a year and a quick look at the price action shows that historically it has not behaved well when this ends. The MACD is not close to the extreme level in 2000 but it is well above all other levels when you pull that out. It is also starting lower towards a cross down. These could produce either a pullback or continued consolidation.
But Elliott Wave principles raise the probability of a flat move or small pullback. The price action from the 2002 low to the present looks like the first 3 waves of a 5 wave impulse higher. One of the Elliott Wave principles is that the two corrective waves in the 5 wave pattern often are of different character. That is if one if flat the other trends or zigzags for example. In this case Wave II trended lower, so Wave IV would be expected to be flatter.
Using that concept and a similar timeframe for Wave II could see Wave IV ending at 4000 in early 2016, before a final Wave V higher to between 5500 and 7500. The Crab PRZ is nearly in the middle of that range. All of the bullish cases for the longer term fail on a break below 3278 and a then a target of 2328 arises, or a 61.8% retracement of the original Bat pattern.


