Tuesday, December 10, 2013

Buy Low And Sell High? Our Super Commodity System Do This For You

The system allows to take position on the market well in advance of traditional methods and greatly benefit the investor in the subsequent management of the open positions. Super Commodity works with simple and effective rules and with fixed and not optimized parameters.

Test and evaluate for free our Super Commodity system


Top 10 rules of portfolio diversification
If there is one thing the 2008 financial meltdown taught us, it is the value of a properly diversified portfolio. The second thing is that if you think you are diversified, you may need to check again. At the time, many thought they were, only to see losses across the board as assets that previously were uncorrelated moved together and sunk many a portfolio.
Today, figuring out what constitutes a diversified portfolio and, more importantly, how to actually assemble one can be a difficult and at times frustrating ordeal; every analyst and investment advisor has a different idea. To help you navigate these treacherous waters, we offer the following 10 rules of portfolio diversification.

1. Start with the end in mind. A diversified portfolio is not a one-size-fits-all product. Instead, it should be personalized, focusing on your personal long-term investment goals while considering your current personal circumstances. According to Michael Loewengart, senior investment strategist at E*TRADE Capital Management, your personal circumstances should take into account your current financial situation, expected future expenses and how far away from retirement you are. "The goal of asset allocation is to make sure the level of volatility in your portfolio is in line with your goals, personal circumstances and tolerance for risk," he says. Additionally, consider your temperament. If high-risk assets make you overly stressed, perhaps it would be better to stick with comparably low-risk alternatives.
2. Aim to reduce overall risk. Portfolio diversification has two goals, this being the first and what most people associate with diversification. If you have multiple assets in your portfolio, even if one is not doing well, you have others that are outperforming. As such, this reduces the overall volatility of the portfolio. "[Diversification] reduces your risk. Instead of being stuck in just one sector that may not do well at times, a diversified portfolio can sustain you and keep you in business," Michael Clarke, CEO of Clarke Capital Management, says.
3. Aim to enhance overall returns. Being able to capitalize in markets that are outperforming and adding to your bottom-line is the second goal of a diverse portfolio. Not only does owning a range of assets protect you in the event that one does poorly, but it positions you to take advantage of ones that perform exemplarily. "We try to have a finger in each of the different sectors because in our experience usually something is working and that one may save the bill," says Clarke.

4. Invest in multiple asset classes. Traditionally, a portfolio was considered diverse if it had a mixture of equities and bonds. As investors are becoming more sophisticated, other assets such as commodities, real estate and foreign currencies are receiving more attention. In order to reduce risk and enhance returns, investments in numerous asset classes help keep correlations among assets in check. Each class has its own drivers and its own speed bumps. Taken together, they help smooth out the ride.

5. Invest in multiple sectors within the asset classes. Just as investing in multiple asset classes reduces risk and enhances returns, so too does investing in multiple sectors within those asset classes. Just including equities, bonds and commodities is not enough as equities have sectors reaching from healthcare to industrial metals, bonds have a variety of maturations and commodities include energies, metals and foods. "You want to be allocated amongst the various market sectors and industries. Across asset classes, you want to have further diversification into the different segments," Loewengart says.

6. Own assets that do well in bull, bear and sideways markets. This point really stresses the need for owning a diverse array of assets. You do not want to place all your eggs in a basket that does well when the stock market is moving up, because that also means your portfolio will do very poorly when that bull market turns into a bear. Instead, it usually is advisable to own assets with a negative correlation in which one asset moves higher while the other moves lower. Examples of this relationship include the U.S. dollar and crude oil as well as stocks and bonds. It is often true that in times of crisis all correlations go to 1.0, but some strategies are more resistant to this. It is wise to look broadly at how various assets perform in different environments.
Commodity Trading Advisor Salem Abraham pointed out following 2008 that nearly all asset classes were long the economy. Managed futures, which are diversified in their own right through being long or short disparate sectors like agriculture, metals, energies, interest rates and currencies, also perform well in periods of high dislocation. Other diversified asset classes had the same negative response to the economic crisis but managed futures did well by taking advantage of fat tail events rather than being punished by them.
7. Have a disciplined plan for portfolio rebalancing. If you have constructed your portfolio properly, it is to be expected that some assets will outperform others and over time begin constituting a larger percentage of your portfolio. That is the time to rebalance and bring your investments back in check with one another. "If you have a disciplined plan for rebalancing in place, then you can capitalize on the different movements that will take place from the different assets in your portfolio," Loewengart says.
He explains that that discipline will enable you to automatically sell out of your outperforming assets and buy into those underperforming. Consequently, you will naturally be selling high and buying low.

8. No "borrowing" among classes except during rebalancing. Trading can become emotional and that can cloud your judgment. It may seem like a good idea to abandon an investment decision that is not immediately paying off or to bolster ones that are doing well. Proceed with caution, because that is a move that catches many investors. The reason for having a rebalancing plan is to remove that emotional element. "When you look at your portfolio, rebalancing with a stated framework is going to give you the discipline that many investors inherently lack," Loewengart says. That discipline helps you do the things that you may not want to do, but are in your best interest.

9. Backtest your portfolio, but consider current market conditions. Backtesting can help you see correlations that exist in your portfolio and can allow you to see how it would stack up in various market conditions. There is a reason, though, that investment advisors are required to say, "Past performance is not indicative of future results." Also, remember there will be periods in the past in which your portfolio would not have fared well.
Past events can provide a framework, but also consider current market conditions to better position your portfolio for future events. We can learn a lot from the past, but current events are shaping
tomorrow’s markets.

10. Test asset correlations periodically. If there is one thing we can count on in the markets, it’s that they will never stay exactly the same. What was negatively correlated one year can move lock-step the next. Consequently, it is not enough to simply rebalance from time to time; you also need to test the asset correlations in your portfolio periodically to see if anything has changed. As markets change, you need to make informed decisions as to how you need to alter your portfolio to counter those changes. You can’t expect your portfolio allocation decisions to be a one-and-done event; as markets change, so to must your portfolio.

These rules leave a lot to personal judgment and that is the key to success. One additional item to point out is that any allocation to a less liquid asset should calculate that liquidity risk in addition to other risks to achieve the proper allocation.
Your portfolio should fit your needs. Unfortunately in the past not all potential asset classes were available to retail investors. Today, thanks to innovative exchange-traded funds (ETFs) and mutual fund structures, nearly every investor can access commodities, currencies, short and leveraged strategies as well as active strategies including managed futures. Now everyone truly can be diversified.

Should You Still Use Commodity to Diversify Investment Portfolio?
A new study from the Bank of International Settlements (BIS) raises doubts about the value of commodities as a tool for enhancing portfolio diversification. The paper’s smoking gun, so to speak, is that “the correlation between commodity and equity returns has substantially increased after the onset of the recent financial crisis.” Some pundits interpret the study as a rationale for avoiding commodities entirely for asset allocation purposes. But that’s too extreme.
In fact, this BIS paper, although worth a careful read, isn’t telling us anything new. That said, it’s a useful reminder for what should have been obvious all along, namely: there are no silver bullets that will lead you, in one fell swoop, to the promised land of portfolio design. The idea that adding commodities (or any other asset class or trading strategy) to an existing portfolio will somehow transform it into a marvel of financial design is doomed to failure. Progress in the art/science of asset allocation arrives incrementally, if at all, once you move beyond the easy and obvious decision to hold a broad mix of the major asset classes.
Correlations are a key factor in the design and management of asset allocation, but they’re not the only factor. And even if we can find assets and strategies with reliably low/negative correlations with, say, equities, that alone isn’t enough, as I discussed last week. You also need to consider other factors, starting with expected return. It may be tempting to focus on one pair of assets and consider how the trailing correlation stacks up today. But that’s hardly the last word on making intelligent decisions on how to build a diversified portfolio.
Perhaps the first rule is to be realistic, which means recognizing that expected correlations, returns and volatility are in constant flux—and not necessarily in our favor, at least not all of the time. Bill Bernstein’s recent e-book (Skating Where the Puck Was: The Correlation Game in a Flat World), which I briefly reviewed a few months ago, warns that the increasing globalization of markets makes it ever more difficult to earn a risk premium at a given level of risk. As “new” asset classes and strategies become popular and accessible, the risk-return profile that looks so attractive on a trailing basis will likely become less so in the future, Bernstein explains. That’s old news, but it’s forever relevant.
As more investors pile into commodities, REITs, hedge funds, and other formerly obscure corners, the historical diversification benefits will likely fade. Granted, the outlook for expected diversification benefits fluctuates through time, and so what looks unattractive today may look considerably more compelling tomorrow (and vice versa). But as a general proposition, it’s reasonable to assume that correlations generally will inch closer to 1.0. That doesn’t mean that diversifying across asset classes is destined to become worthless, but the expected payoff is likely to dim with the passage of time.
The good news is that this future isn't a total loss because holding a broad set of asset classes is only half the battle. Your investment results also rely heavily on how and when you rebalance the mix. Even in a world where correlations are higher and expected returns are lower, there’s going to be a lot of short-term variation on these fronts. In other words, price volatility will remain high, which opens the door (at least in theory) for earning a respectable risk premium.
Still, it’s wise to manage expectations along with assets. Consider how correlations have evolved. To be precise, consider how correlations of risk premia among asset classes compare on a rolling three-year basis over the last 10 years relative to the Global Market Index (GMI), an unmanaged market-weighted portfolio of all the major asset classes. As you can see in the chart below, correlations generally have increased. If you were only looking at this risk metric in isolation, in terms of history, you might ignore the asset classes that are near 1.0 readings, which is to say those with relatively high correlations vis-a-vis GMI. But by that reasoning, you’d ignore foreign stocks from a US-investor perspective, which is almost certainly a mistake as a strategic decision.

Nonetheless, diversifying into foreign equities looks less attractive today compared with, say, 2005. Maybe that inspires a lower allocation. Then again, if there’s a new round of volatility, the opportunity linked with diversifying into foreign markets may look stronger.
The expected advantages (and risk) with rebalancing, in other words, are constantly in flux. The lesson is that looking in the rear-view mirror at correlations, returns, volatility, etc., is only the beginning—not the end—of your analytical travels.
Sure, correlations generally are apt to be higher, which means that it’s going to be somewhat tougher to earn the same return at a comparable level of risk relative to the past. But that doesn’t mean we should abandon certain asset classes. It does mean that we’ll have to work harder to generate the same results.
That’s hardly a new development. In fact, it’s been true all along. As investing becomes increasingly competitive, and more asset classes and strategies become securitized, expected risk premia will likely slide. But what’s true across the sweep of time isn’t necessarily true in every shorter-run period. The combination of asset allocation and rebalancing is still a powerful mix—far more so than either one is by itself. And that’s not likely to change, even in a world of higher correlations.

Trading The Technical With BofA: S&P500, EURUSD, Treasurys And Crude

by Tyler Durden

Since fundamentals have been irrelvant for years, the only possible (short-term) guide in a market in which the only thing that does matter is the Fed's balance sheet, are trends (as Hugh Hendry put it so appropriately) here are some technical trade ideas from Bank of America, on the EURUSD, Treasurys, the S&P500 and WTI.

First, on FX:

Looking for the EURUSD Top:

As we recently wrote in our 2014 Year Ahead report, we are US $ bulls for the year ahead and look for €/$ to trade lower toward the Apr'12 lows, at 1.2746, and, potentially, the 200m avg. near 1.2173. In the nearer term, we continue to see the gains from the 1.3295 Nov 07 low as corrective and temporary. The impulsive decline from the 1.3833 high on Oct 25 says the trend has turned bearish for the 200d (now 1.3248) and, potentially, the 17m channel base at 1.3065. An impulsive decline below 1.3694 confirms the trend has resumed lower, while OUR BEARISH VIEW IS INCORRECT ON A BREAK OF 1.3833.

Next, on Treasurys :

Head and Shoulders base says stay bearish 5yrs.

Since the Friday NFP, we have seen a sizeable, bullish turn in US Treasuries. However, despite this turn, the bigger picture trend continues to say, "STAY BEARISH". Our point of focus remains very much on the 5yr, where the 2m Head and Shoulders Base remains intact. Indeed, it is quite common to see a "re-test" of a Head and Shoulders neckline following the formation's completion. That is likely what we are seeing here. With the neckline currently at 1.447%, further yield weakness, price strength should prove limited before the larger bear trend resumes. We have taken this counter-trend move as an opportunity to add to our TYH4 short (recall we recommended going short in last Thursday's Liquid Technical Alert) at 124-20+ for an average of 124-17+. Our stop is 125-08 and our downside target is 122-06+.

Next, on the S&P500 (via ESZ3):

Watch SP500

Turning to ESZ3, the break of 1799.75 alleviates the correction risk and points to bull trend resumption. A break of 1812.50 confirms, targeting 1847/1850. Below 1799 means renewed range trading, while bears gain control below 1773.25

And finally, on crude:

Get ready to buy a WTI pullback

The CLF4 impulsive advance from 91.77 says the near-term and, POTENTIALLY, medium-term trend has turned bullish for WTI. In the sessions ahead, we will look to buy a pullback into 95.74 for 102.95/103.00 and, POTENTIALLY, the multi-year range highs near 110.55 and beyond. WTI bulls, GET READY.

See the original article >>

Orange juice rises on demand, greening disease impact

By Jack Scoville

FCOJ (NYBOT:OJF14)

General Comments: Futures closed higher, but well off the highs as Nielsen reported increased demand. It remains very cold in parts of the U.S., but Florida remains warm. The state is being protected from the very cold temperatures to the north by a very strong jet stream that will not let the cold penetrate into the Deep South. Traders are expecting USDA to show unchanged production in its estimates this week, but to lower production even more in coming production reports. The greening disease has affected crops in a big way and could cause reduced production for the next few years. Growing and harvest conditions in the state of Florida remain mostly good. It has turned mostly dry, which is seasonal, and reports indicate that crops are in good condition. Irrigation water is available. Harvest is very active. Brazil is seeing near to above normal temperatures and scattered showers.

Overnight News: Florida weather forecasts call for mostly dry conditions. Temperatures will average mostly above normal. Nielsen said that US Orange Juice consumption was 41.47 million gallons for the four weeks ending on November 23, up 1.3% from the previous four week period but 7.9% less than last year.  

Chart Trends: Trends in FCOJ are up with objectives of 145.00 January. Support is at 141.00, 138.00, and 136.50 January, with resistance at 145.00, 148.00, and 149.00 January.

COTTON (NYBOT:CTH14)

General Comments: Futures closed little changed as traders waited for the USDA supply and demand estimates that will be released later this morning. Traders expect unchanged ending stocks estimates on increased production and demand. The bulls were encouraged by the good employment data released Friday. The data implied that demand for clothes can increase as more and more people go back to work. There are questions about demand in China as the government there has offered its supplies into the domestic market and as economic data there has been more mixed. Wire reports indicate that some production has been lost in China after some bad weather in some growing áreas, but weather is better again now. Brazil conditions are reported to be very good in Bahia. Harvest in the US should be about done now as winter moves south.

Overnight News: The Delta will be dry all week and Southeast should see some showers and snow through the middle of week, then dry conditions. Temperatures will average below normal this week and near normal this weekend. Texas will see dry conditions. Temperatures will average below normal this week and near normal this weekend. The USDA spot price is 77.15 ct/lb. today. ICE said that certified Cotton stocks are now 0.088 million bales, from 0.091 million yesterday.

Chart Trends: Trends in Cotton are mixed to up with objectives of 8310, 8690, and 8940 March. Support is at 79.60, 79.40, and 78.90 March, with resistance of 80.95, 81.70, and 82.20 March.

COFFEE (NYBOT:KCH14)

General Comments: Futures were higher in London, but lower in New York. It was mostly a quiet session with little interest showing from buyers or sellers. Roasters and others look for supplies and some have turned to Arabica, although not enough to move New York futures. Vietnamese keep holding out for higher prices, and futures in London have responded as the major roasters are reluctant to change the blends and add Arabica in a big way. The Arabica market is seeing only light offers, but buying interest for Arabica overall remains limited. Colombia and Peru remain the most active sellers. The Brazil market there remains quiet as producers wait for prices to rally above the cost of production. The rest of northern Latin America was quiet, but there is talk of a lot of Coffee there as well. Central America is showing light offers as the harvest progresses under mostly good conditions. New York is trading in a range and is testing support areas.

Overnight News: Certified stocks are near unchanged today and are about 2.669 million bags. The ICO composite price is now 102.52 ct/lb. Brazil will get scattered showers this week. Temperatures will average near to below normal. Colombia should get scattered showers, and Central America and Mexico should get mostly dry weather, but showers are likely in northern Mexico. Temperatures should average near to above normal.

Chart Trends: Trends in New York are mixed. Support is at 105.50, 104.00, and 101.00 March, and resistance is at 109.00, 111.00, and 113.00 March. Trends in London are up with objectives of 1840 and 1970 January. Support is at 1680, 1660, and 1630 January, and resistance is at 1730, 1750, and 1770 January. Trends in Sao Paulo are mixed. Support is at 129.00, 128.00, and 125.00 March, and resistance is at 133.00, 135.00, and 136.50 March.

SUGAR (NYBOT:SBH14)

General Comments: Futures were lower again and made new lows for the move again. The primary focus of the market remains big supplies. Increased offers from India and Thailand combined with news that Coopersucar will start to export from its Santos terminals next month to keep big supplies in front of everyone. Coopersucar said last week that it should have its export warehouse open in part again next month and expects to meet all export targets for this year and next year. The market needs some demand news, but has had trouble finding any demand outside of normal. Chart trends remain down in New York and London. Weather conditions in key production areas around the world are rated as mostly good.

Overnight News: Brazil could see showers and near to above normal temperatures.

Chart Trends: Trends in New York are down with no objectives. Support is at 1655, 1640, and 1610 March, and resistance is at 1685, 1700, and 1715 March. Trends in London are down with objectives of 446.00 March. Support is at 446.00, 440.00, and 434.00 March, and resistance is at 454.00, 460.00, and 465.00 March.

COCOA (NYBOT:CCH14)

General Comments: Futures closed lower on some speculative selling amid no demand news and good harvest conditions in West Africa. Very little has changed fundamentally, and that could become a challenge for the bulls as the market needs news to keep he move higher intact. Supplies should be available now as the main crop harvest is still active in West Africa. Reports indicate that rains are minimal this week in West Africa, which should help harvest progress and processing progress. Much of West Africa is now reporting reduced production due to stressful conditions earlier in the growing season, but this has yet to bear out in official data outside of Nigeria. The overall fundamental picture should support generally higher prices as the supply situation should be tight once the harvest selling is done. Midcrop production conditions are rated as good and a good mid-crop production is expected in the Spring.

Overnight News: Mostly dry conditions are expected in West Africa. Temperatures will average mostly above normal. Malaysia and Indonesia should see scattered showers. Temperatures should average near to above normal. Brazil will get dry conditions and near normal temperatures. ICE certified stocks are lower today at 3.340 million bags.

Chart Trends: Trends in New York are mixed. Support is at 2730, 2700, and 2650 March, with resistance at 2790, 2840, and 2870 March. Trends in London are mixed. Support is at 1710, 1680, and 1660 March, with resistance at 1775, 1790, and 1820 March.

See the original article >>

Why Our Consumer-Debt Dependent Economy Is Doomed

by Charles Hugh Smith

If you understand the difference between the first pair of shoes and the 25th, you understand why America's debt-dependent consumer economy is doomed.

Yesterday I explained Why We're Stuck with a Bubble Economy:

Now that interest rates are near-zero and mortgage rates are rising from historic lows, there is no more juice to be squeezed from low rates.Asset bubbles always burst, destroying collateral and rendering borrowers and lenders alike insolvent.
Without organic demand from rising real income and new households with good-paying jobs and low levels of debt, the consumer-debt based economy stagnates. This has left the economy dependent on serial asset bubbles that create phantom collateral that can support new debt, albeit temporarily.

The other critical dynamic is the marginal utility of additional consumption in a debt-dependent consumer economy. In an economy in which 49% of all residents (156 million people out of a total population of 317 million) receive a direct transfer of cash or cash-equivalent benefit from the central government, and millions of these people also receive cash and/or benefits from state and local governments (49% of Americans Get Government Benefits), poverty is relative rather than absolute for the vast majority of Americans.
The American economy is highly dependent on consumption. Household consumption accounts for about 35% of developing economies' activity--roughly half of America's 70% consumption economy.
As noted yesterday, with the earned income of the lower 90% of wage earners stagnant for four decades, America has enabled consumption by leveraging income and collateral into ever-rising mountains of debt.
The problem with debt, of course, is that it accrues interest, and that paying interest reduces the amount of income left to spend on consumption.
In this way, depending on debt to finance consumption is akin to the snake eating its own tail: at some point, the cost of servicing the debt reduces the income available to be spent on additional consumption to zero. Additional consumption becomes impossible without asset bubbles to temporarily enrich the households that own assets or "helicopter drops" of interest-free cash into household checking accounts.
This is how we have reached the point that a majority of U.S. households live paycheck to paycheck, as earnings are eaten up by essential bills and debt service.
Given that the majority of Americans already enjoy a considerable array of consumer goods and services, the only way to fuel more consumption is to entice consumers into buying more of what they already own or buy a replacement for a perfectly usable good or service. Let's illustrate the concept of marginal utility with shoes.
To those with no shoes at all (a common enough occurrence in the 1930s Great Depression), the utility of one pair of shoes is extremely high: the utility (i.e. the benefits) resulting from owning that one pair of shoes is enormous.
Now consider an aspirational-consumer (i.e. someone striving to look wealthier and more successful than they really are) of the upper-middle class: this consumer might own several dozen pairs of shoes, and his/her problem is finding space for more shoes.
The retailer attempting to persuade this consumer to buy a 25th pair of shoes must overcome the diminishing utility (i.e. marginal utility) of yet another pair of shoes. This is accomplished by offering a "deal you can't pass up" or appealing to the always pressing need to jettison last year's style in favor of this year's "new thing."
Here's the critical point of this dynamic: to the consumer who already owns so much stuff that he has to rent a storage facility to store all the surplus goods, the utility of any additional purchase is low. In practical terms, the utility has declined to the thrill of the initial purchase and the initial wearing/use of the new item. Beyond that, it's just another pair of shoes in the closet.
To the manufacturer/retailer/government dependent on more sales for survival, the value of the first pair of shoes sold and the 25th pair sold are the same. The manufacturer/retailer needs to sell more shoes just to stay in business, and the government living off sales and other consumption-generated taxes also needs more sales.
In an economy in which most people have the essentials of life--i.e. the first pair of shoes with the highest utility--all consumption beyond replacing a hopelessly broken essential is of marginal utility.
An additional $1 of debt adds the same burden to the household whether it is spent on the first pair of shoes or the 25th pair. Taking on debt might make sense for the first pair of shoes, or the first bicycle, but it makes increasingly less sense for each additional pair of shoes or replacement bicycle: the debt piles up but the utility derived from the purchase is increasingly marginal.
The $3,000 I could spend on a replacement bike for the perfectly serviceable bicycle I bought used 15 years ago for $150 is of marginal utility; the better-quality parts and lighter frame, etc.--all the benefits that would flow from spending $3,000 for a "better, more modern" bike are extremely marginal to me, even though I put well over 1,000 miles a year on my bike. All those improvements are too modest to matter. This is the essence of marginal utility.
If you understand the difference between the first pair of shoes and the 25th, and the increasing diversion of income to interest payments that results from debt-based consumption, then you understand why America's debt-dependent consumer economy is doomed.

See the original article >>

Are commodities about to “Run” like Forrest Gump?

by Chris Kimble

CLICK ON CHART TO ENLARGE

If one has invested in the Thompson Reuters/Jefferies CRB Commodities index since 2011, its not been a fun ride as the index is down 25% over the past couple of years and has made a series of lower highs. On the opposite side over the past 18 months,  the CRB has created a series of lows, creating a descending triangle pattern in the chart above, that is about to end.

Should the CRB break resistance, it has the potential to run to the upside for a while which would surprise many professional managers because exposure to this asset class is at historical lows!

See the original article >>

39th Record S&P Close, But....

by Tom Aspray

Another record close in the S&P 500 on Monday at 1808.37 even though the intra-day high from November 29 at 1813.55 was not surpassed. This was the 39th new closing high for the year in the S&P 500 but from my perspective it was definitely not impressive.

The NYSE A/D numbers were neutral as the NYSE Composite did not make new highs and only 157 stocks made new 52-week highs. This is well below the October reading of 471, and at the November peak, there were 284 new highs on the NYSE. This is a sign that the market’s trend has weakened.

In the latest Week Ahead column, I provided my outlook for how the S&P 500 might close the year, basis a combination of technical and historical analysis. While the S&P 500 closed up 0.18% for the day and the KBW Bank index gained 0.27%, the broader NYSE Financial Index lost 0.98%. Today the Volker rule was scheduled to go in effect but that has been delayed by the impending snowstorm.

On a year to date (YTD) basis, the Select Sector SPDR Financial (XLF) is up 32.5% versus a 29.5% gain in the Spyder Trust (SPY). This makes it a market-leading sector in 2013 but does that mean that XLF or the major money center banks are still a buy now?

chart
Click to Enlarge

Chart Analysis: The Spyder Trust (SPY) formed a doji on Monday with its close at $181.40, which was just above the prior closing high of $181.

  • The intra-day high of $181.67 was just below the November 29 high of $181.75.
  • The daily starc+ band is at $182.73 with the monthly projected monthly high at $186.16.
  • A daily close below $181.16 will trigger a low close doji sell signal.
  • The daily OBV has been rising for the past two days but did break support at line d last week.
  • The OBV is still below both its WMA and the bearish divergence resistance at line c.
  • Monday’s close was therefore accompanied by the 2nd negative divergence since the November highs.
  • The S&P 500 Advance/Decline also has formed another negative divergence, line e, as it has just rallied back to its declining WMA.
  • The A/D line also shows a pattern of lower lows.
  • The 20-day EMA is at $179.39 with support also at $178.35.
  • A decisive break of this level is likely to trigger a drop at least to the monthly projected support at $176.39.

The Select Sector SPDR Financial (XLF) staged a breakout in November as the resistance at line f, was overcome. This support in the $21 area was tested last week.

  • There is resistance now at the recent high of $21.64, which corresponds to the quarterly R1 resistance.
  • The daily relative performance is still in a downtrend, line h, after leading the S&P 500 from April through July.
  • The RS does show a potential bottoming formation but the weekly RS (not shown) is still below its WMA.
  • The daily OBV does act better as it made a new high on November 25 and is back above its flat WMA.
  • The OBV did break through its resistance, line i, to confirm the price action.
  • There is more important support at $20.06, which is the quarterly pivot.

chart
Click to Enlarge

Citigroup C -0.08% Inc. (C) has kept pace with the XLF, so far in 2013, as the downtrend, line a, was overcome in November when it surged to a high of $53.98 and hit the starc+ band.

  • The daily starc- band was tested last week and it is now at $50.28.
  • The quarterly pivot is at $49.48 with the daily uptrend, line b, now at $48.94.
  • The relative performance moved through its downtrend from the May highs (line c) in late November.
  • The OBV did not confirm the upside breakout as it failed to move above the resistance at line d.
  • The OBV closed Monday back above its WMA and well above the longer-term support at line e.
  • The weekly OBV (not shown) did confirm the breakout in prices.
  • There is near-term resistance now at $52-$53.

Bank of America BAC 0% (BAC) has done a bit better in 2013 than Citigroup Inc. (C) as it is up 34.5% versus 31.8%.

  • The stock broke out of a four-month trading range, lines f and g, in November.
  • The upside targets from the range at $15.20 and $16 have been met.
  • The quarterly R1 resistance is at $16.14 with the weekly starc+ band at $16.27.
  • The relative performance broke through strong resistance at line h, in November.
  • The RS line has pulled back to its WMA but the weekly (not shown) is holding well above its WMA.
  • The OBV has been acting strong as it has formed higher highs, line I, and is well above its rising WMA.
  • The weekly OBV (not shown) also did confirm the new highs.
  • The rising 20-day EMA is at $15.30 with the monthly projected support at $14.41.

What It Means: The further divergences in the daily technical studies increases the odds of a deeper correction over the next few weeks. The extent of the initial selling should give me a clearer idea of how deep a correction should be expected.

As for the financial sector including Citigroup Inc. (C) and Bank of America (BAC), I would not recommend new positions as we should get a better buying opportunity down the road. Of the two banks, Bank of America (BAC) is acting the best.

How to Profit: There are no strong buy signals yet in the inverse ETFs, like ProShares UltraShort S&P 500 (SDS), but they could come later today. Watch my Twitter feed for new recommendations.

See the original article >>

South American soy crop seen exceeding estimates as area expands

By Whitney McFerron

South American soybean production may be larger than previously estimated in the 2013-14 season as farmers expand planting to a record, Oil World said.

Production in the top five growers of the oilseed may rise 10% from a year earlier to 159.8 million metric tons in the period, the researcher said in an e-mailed report. That compares with a forecast of 158.5 million tons made at its outlook conference on Nov. 29. Leading global exporter Brazil will harvest a record 89 million tons as Argentina’s crop gains 14% to 55.5 million tons, according to the report.

Both Brazil and Argentina, the third-biggest shipper after the U.S., will plant record amounts of soybeans in 2013-14 at 29.9 million hectares (73.9 million acres) and 20.5 million hectares, respectively, Hamburg-based Oil World said. Uruguay’s soybean area more than doubled in the past five years. Lower corn prices mean it’s unprofitable for many farmers to grow the grain, so more acres are being switched to soybeans, it said.

“Soybeans are the most attractive crop at the moment because of their comparatively high prices,” Oil World said. “The prospective South American supply pressure is likely to have a bearish impact.”

Soybeans dropped 4.8% this year on the Chicago Board of Trade, less than corn’s 37% plunge. Demand from China, the world’s top importer of the oilseed, kept prices from falling further. The country purchased a record 24 million tons from the U.S. as of Nov. 28, up from 17.5 million tons at the same time last year, boosting stockpiles in case logistical bottlenecks delay shipments from the South American harvest starting early next year, Oil World said.

Second Crop

Brazil’s crop may still be at risk as growing areas in Mato Grosso and Mato Grosso do Sul states face a caterpillar infestation, Oil World said. The insect larvae may damage as much as 1.5 million tons, it said. Some Brazilian farmers plan to sow a second annual soybean crop, rather than rotate fields to corn. A second soybean crop may cover about 700,000 hectares, producing as much as 2 million tons, the report showed.

“Lack of rotation is causing concern, reducing the quality of the soils and raising the risk of diseases and pests as well as requiring higher inputs of fertilizers and pesticides,” Oil World said. “This is contributing to higher production costs.”

In Argentina, planting of grains including corn and wheat may drop to a four-year low of 12.7 million hectares as farmers focus on oilseeds, Oil World said.

See the original article >>

WTI crude find support as oil trade unwinds

By Phil Flynn

It is not really like West Texas Intermediate oil (NYMEX:CLF14) is going up so much as Brent Crude is going down. The oil trade of the last few months continues to unwind. Traders are preparing for the completion of the Keystone pipeline and the fact that North Sea production is coming back on line. So even with oil supply at the highest level since the 1930s, the great unwind will keep supporting WTI at least for now. Value-added industrial output in one of the world's largest crude consumers rose 10% in November from a year earlier, data from the National Bureau of Statistics showed Tuesday.

Bloomberg Reports that WTI surged 5.3% last week and the WTI-Brent spread tightened after U.S. crude inventories declined for the first time in 11 weeks and TransCanada announced plans to start part of its Keystone pipeline to the Gulf Coast from Cushing, Oklahoma, the delivery point for the Nymex futures. Supplies fell 5.59 million barrels to 385.8 million in the week ended Nov. 28, the EIA said Dec. 4. Refineries operated at 92.4% of capacity, the most since September. Utilization rates usually pick up in December after maintenance is performed during the lull in fuel use between the summer driving and the winter heating periods.

TransCanada began injecting oil into the southern portion of the Keystone pipeline on Dec. 7, Shawn Howard, a spokesman based in Calgary, said in an e-mailed statement. The company will inject 3 million barrels in coming weeks, he said.  The company estimates it will begin taking receipts and delivering oil via the line in mid- to late-January, a bulletin showed. The link ending at Port Arthur, Texas, will have a capacity of 700,000 barrels a day.

Hedge funds boosted bullish bets on WTI in the week ended Dec. 3 by the most since July as economic growth accelerated in the U.S. Money managers increased net-long positions, or wagers on rising prices, by 7.8% to 246,661 futures and options combined, U.S. Commodity Futures Trading Commission data show on Dec. 9.

Daily exports of 11 main grades of North Sea crude for loading in January will increase by 3.4%, according to loading programs obtained by Bloomberg.  Shipments of Brent, Forties, Oseberg, Ekofisk, Statfjord, Gullfaks, Alvheim, Aasgard, DUC, Grane and Troll blends will total about 64.1 million barrels, or about 2.07 million barrels a day. That compares with about 2 million barrels in revised data for December. The North Sea production is coming back and it should put more supplies in the marketplace. That's going to pressure Brent. The Brent-WTI spread continues to come in.

Implied volatility for at-the-money WTI options expiring in February was 16.2%, little changed from 16.1% on Dec. 6, data compiled by Bloomberg showed.  Dow says that while November's growth was slightly lower than October's increase, it added to positive sentiment generated over the weekend when the world's second-largest economy in November posted its largest trade surplus in nearly five years.

We also have Fed rumblings and gold and silver looks like it is trying for another bottom. The International Monetary Fund is calling for tighter global monetary policies, a fact that may slow stocks and boost metals. While initially rising rates is bearish on gold, the one-way trade in stocks may end. Charts are looking like a bottoming attempt! Heating oil is popping up as cold temperatures are looking to stay.  

In the Ukraine, things are taking a turn for the worst. The government is cracking down on pro-democracy protestors. Bloomberg reports that the European Union's foreign policy chief is heading to Ukraine after police raided the main opposition party headquarters and tore down barricades erected by protesters calling for President Viktor Yanukovych to quit.

Around 1,000 demonstrators held out for a 20th day in the city center amid snow showers and freezing temperatures, with an overnight low of minus 7 Celsius (18 Fahrenheit). Emotions flared after hundreds of officers pushed activists away from their make-shift blockades and tent encampments in Kiev and stormed the offices of jailed former Prime Minister Yulia Tymoshenko's party yesterday and early this morning.

A day after youths toppled a statue of Vladimir Lenin, the prosecutor general warned activists not to "test the patience of authorities." More than 200 policemen in riot gear tore down barriers near government offices yesterday and pushed protesters toward Independence Square. Hundreds more police marched with metal riot shields to drive activists away from barricades near the president's office, injuring three, at about 4 a.m. this morning, according to a Bloomberg reporter on the scene.

The pressure on demonstrators raised fears of a repeat of clashes that injured 400 people on Dec. 1, when riot police broke up a protest encampment. Anger over that crackdown helped draw hundreds of thousands of Ukrainians to Kiev on Dec. 8 for the country's biggest rally in almost a decade.

See the original article >>

Energy Return on Energy Invested and Collapse

By Gail Tverberg

What do diminishing returns, energy return on energy invested (EROI or EROEI), and collapse have to do with each other? Let me start by explaining the connection between Diminishing Returns and Collapse.

Diminishing Returns and Collapse

We know that historically, many economies that have collapsed were ones that have hit “diminishing returns” with respect to human labor–that is, new workers added less production than existing workers were producing (on average). For example, in an agricultural economy, available land might already have as many farmers as the land can optimally use. Adding more farmers might add a little more production–perhaps the new workers would keep weeds down a bit better. But the amount of additional food the new workers would produce would be less than what earlier workers were producing, on average. If new workers were paid on the basis of their additional food production, they would find that their wages dropped relative to those of the original farmers.

Lack of good paying jobs for everyone leads to a need for workarounds of various kinds. For example, swamp land might be drained to add more farmland, or irrigation ditches might be added to increase the amount produced per acre. Or the government might hire a larger army might to conquer more territory. Joseph Tainter (1990) talks about this need for workarounds as a need for greater “complexity.” In many cases, greater complexity translates to a need for more government services to handle the problems at hand.

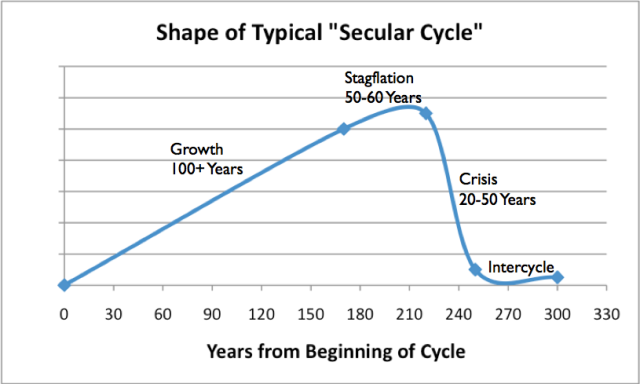
Turchin and Nefedof (2009) in Secular Cycles took Tainter’s analysis a step further,  analyzing financial data relating to historical collapses of eight agricultural societies in operation between the years 30 B.C. E. and 1922 C. E.. Figure 1 shows my summary of the pattern they describe.

Figure 1. Shape of typical Secular Cycle, based on work of Peter Turkin and Sergey Nefedov.Figure 1. Shape of typical Secular Cycle, based on work of Peter Turkin and Sergey Nefedov.

Typically, a civilization developed a new resource which increased food availability, such as clearing a large plot of land of trees so that crops could be planted, or irrigating an  existing plot of land. The economy tended to expand for well over 100 years, as the population grew in size to match the potential output of the new resource. Wages were relatively high.

Eventually, the civilization hit a period of stagflation, typically lasting 50 or 60 years, as the population hit the carrying capacity of the land, and as additional workers did not add proportionately more output. When this happened, the wages of common workers tended to stagnate or decrease, resulting in increased wage disparity. The price of food tended to spike. To counter these problems, the amount of government services rose, as did the amount of debt.

Ultimately, what brought the civilizations down was the inability of governments to collect enough taxes for expanded government services from the increasingly impoverished citizens. Other factors played a role as well–more resource wars, leading to more deaths; impoverished common workers not being able to afford an adequate diet, so plagues were more able to spread; overthrown or collapsing governments; and debt defaults. Populations tended to die off.  Such collapses took place over a long period, typically 20 to 50 years.

For those who are familiar with economic theory, the shape of the curve in Figure 1 is very similar to the production function mentioned in This Is A Debt and Energy Crisis. In fact, the three main phases are the same as well. The issue in both cases is diminishing returns ultimately leading to collapse.

There seems to be a parallel to the current world situation. The energy resource that we learned to develop this time is fossil fuels, starting with coal about 1800. World population was able to expand greatly because of additional food production permitted by fossil fuels and because of improvements in hygiene. A period of stagflation began in the 1970s, when we first encountered problems with US oil production and spiking oil prices.  Now, the question is whether we are approaching the Crisis Stage as described by Turchin and Nefedov.

Why Might an Economy Collapse?

Let’s think about how an economy operates. It is built up from many parts, over time. It includes one or more governments, together with the laws and regulations they pass and together with their financial systems. It includes businesses and consumers. It includes built infrastructure, such as roads and electricity transmission lines. It even includes traditions and customs, such as whether savings are held in gold jewelry or in banks, and whether farms are inherited by the oldest son. As each new business is formed, the owners make decisions based on the business environment at that time, including competing businesses, supporting businesses, and the number of customers available. Customers also make decisions on which product to buy, based on the choices available and the prices of these products.

Over time, the economy gradually changes. Some parts of the economy gradually wither and are replaced by new parts of the system. For example, as the economy moved from using horses to cars for transportation, the number of buggy whip manufacturers decreased, as did the number of businesses raising horses for use as draft animals. Customs and laws gradually changed, to reflect the availability of automobiles rather than horses for transportation. In some cases, governments changed over time, as increased wealth allowed more generous social programs and wider alliances, such as the European Union and the World Trade Organization.

In the academic field of systems science, an economy can be described as a complex adaptive system. Other examples of complex adaptive systems include ecosystems, the biosphere, and all living organisms, including humans. Because of the way the economy is knit together, changes in one part of the system tend to affect other parts of the system. Also, because of the way the system is knit together, the system has certain requirements–requirements which are gradually changing over time–to keep the economy operating. If these requirements are not met, the economy may collapse, just as the eight economies studied by Turchin and Nefedov collapsed. In many ways such a collapse is analogous to an animal dying, or climate changing, when conditions are not right for the complex adaptive systems that they are part of.

Clearly one of the requirements that an economy has, is that it needs to be wealthy enough to afford the government services that it has agreed to. Scaling back those government services is one option, but when these services are really needed because citizens are getting poorer and finding it harder to find a good-paying job, this is hard to do. The other option, unfortunately, seems to be collapse.

The wealth of an economy is very much tied to the availability of cheap energy. A huge uplift is added to an economy when the (value added to society) by an energy resource such as oil greatly exceeds its (cost of production). Over time, the cost of production tends to rise, something measured by declining EROI. The uplift added by the difference between (value added to society) and (cost of production) is gradually lost. Some would hypothesize that the falling gap between (value added to society) and the (cost of production) can be compensated for by technology changes and improvements in energy efficiency, but this has not been proven.


Our Economy is Already in a Precarious Position

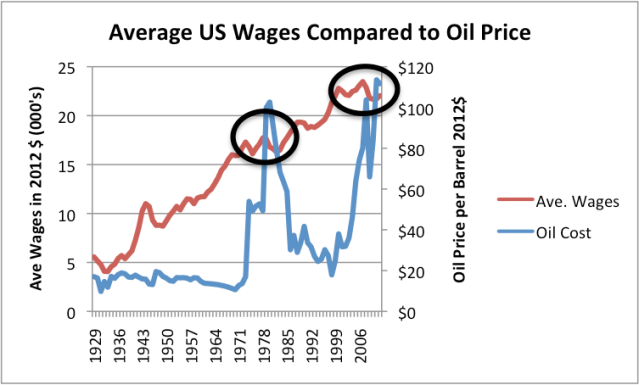
As I indicated in my most recent post, if a person computes average wages by dividing total US wages by total US population (not just those employed), the average wage has flattened in recent years as oil prices rose. Median wages (not shown on Figure 2) have actually fallen. This is the same phenomenon observed in the 1970s, when oil prices rose. This is precisely the phenomenon that is expected when there are diminishing returns to human labor, as described above.

Figure 2. Average US wages compared to oil price, both in 2012$. US Wages are from Bureau of Labor Statistics Table 2.1, adjusted to 2012 using CPI-Urban inflation. Oil prices are Brent equivalent in 2012$, from BP’s 2013 Statistical Review of World Energy.Figure 2. Average US wages compared to oil price, both in 2012$. US Wages are from Bureau of Labor Statistics Table 2.1, adjusted to 2012 using CPI-Urban inflation. Oil prices are Brent equivalent in 2012$, from BP’s 2013 Statistical Review of World Energy.

The reason for the flattening wages is too complicated to describe fully in this post, so I will only mention a couple of points. When consumers are forced to spend more for oil for commuting and food, they have less to spend on discretionary spending. The result is layoffs in discretionary sectors, leading to lower wage growth. Also, goods produced with high-priced oil are less competitive in the world market, if sellers try to recoup their higher costs of production. As a result, fewer of the products are sold, leading to layoffs and thus lower average wages for the economy.

In the last section, I mentioned that the economy is a complex adaptive system. Because of this, the economy acts as if there are hidden laws underlying the system, parallel to the laws of thermodynamics underlying physical systems. If oil supplies are excessively high-priced, very few new jobs are formed, and those that are created don’t pay very well. The economy doesn’t grow much, but it does stay in balance with the high-priced oil that is available.

The Government’s Role in Fixing Low Wages and Slow Economic Growth

The government ends up being the part of the economy most affected by slow economic growth and low job formation. This happens because tax revenue is reduced at the same time that government programs to help the poor and unemployed need to grow. The current approach to fixing the economy is (1) deficit spending and (2) interest rates that are kept artificially low, partly through Quantitative Easing.

The problem with Quantitative Easing is that it is a temporary “band-aid.” Once it is stopped, interest rates are likely to rise disproportionately. (See the recent Wall Street Journal editorial,” Janet Yellen’s Greatest Challenge.”) Once this happens, the economy is likely to fall into severe recession. This happens because higher interest rates lead to higher monthly payments for such diverse items as cars, homes, and factories, leading to a cutback in demand. Oil production may fall, because the cost of production will rise (because of higher interest rates), while the amount consumers have to spend on oil will fall–quite possibly reducing oil prices.  If interest rates rise, the amount the government will need to collect in taxes will also rise, because interest on government debt will also rise.

So we are already sitting on the edge, waiting for something to push the economy over. The Affordable Care Act (“Obamacare”) may provide a push in that direction. Inability to pass a federal budget could provide a push as well.  So could a European Union collapse. Debt defaults are another potential problem because debt defaults are likely to increase dramatically, as economic growth shrinks, as discussed in the next section.

Debt is Major Part of our Current Precarious Financial Situation

If an economy is growing, it is easy to add debt. People find it easy to find and keep jobs, so they can pay back debt. Businesses and governments find that their operations are growing, so borrowing from the future, even with interest, “makes sense.”

It is as also easy to add debt if the economy is not growing, but there is an ample supply of cheap oil that can be extracted if increasing debt can be used to ramp up demand. For example, after World War II, it was possible to ramp up demand for automobiles and trucks by allowing purchasers to use debt to finance their purchases. When this increased debt led to increased oil consumption, it greatly benefited the economy, because the (value to society) was much greater than the (cost of extraction). Governments were able to tax oil extraction heavily, and were also able to build new roads  and other infrastructure with the cheap oil. The combination of new cars, trucks, and roads helped enable economic growth. With the economic growth that was enabled, paying back debt with interest was relatively easy.

The situation we are facing now is different. High oil prices–even in the $100 barrel range–tend to push the economy toward contraction, making debt hard to pay back. (This happens because we are borrowing from the future, and the amount available to repay debt in the future will be less rather than more.) The problem can be temporarily covered up with deficit spending and Quantitative Easing, but is not a long-term solution. If interest rates rise, there is likely to be a large increase in debt defaults.

The Role of Energy Return on Energy Invested (EROI or EROEI)

EROI is the ratio of energy output over energy input, a measure that was developed by Professor Charles Hall. To calculate this ratio, one takes all of the identifiable energy inputs at the well-head (or where the energy product is produced) and converts them to a common basis. EROI is then the ratio of the gross energy output to total energy inputs. Hall and his associates have shown that EROI of oil extraction has decreased in recent years (for example, Murphy 2013), meaning that we are using increasing amounts of energy of various kinds to produce oil.

In previous sections, I have been discussing diminishing returns with respect to human labor. Oil and other energy products are forms of energy that we humans use to leverage our own human energy. So indirectly, diminishing returns with respect to the extraction of oil and other energy products, as measured by declining EROI, will be one portion of the diminishing returns with respect to human labor. In fact, declining EROI may be the single largest contributor to diminishing returns with respect to human labor. This will happen if, in fact, low EROI correlates with high oil price, and high oil prices leads to diminished wages (Figure 2). This may be the case, because David Murphy (2013) indicates that the relationship between EROI and the price of oil is in fact inverse, with oil prices rising rapidly at low EROI levels.

Contributors to Declining Return on Human Labor

Human labor is the most basic form of energy. We humans supplement our own energy with energy from many other sources. It is this combination of energy from many sources that is reflected in the productivity of humans. For example, we take it for granted that we will have tools made using fossil fuels and that we will have electricity to power computers. Before fossil fuels, humans supplemented their energy with energy from animals, burned biomass, wind, and flowing water.

What besides declining EROI of fossil fuels would lead to diminishing returns with respect to human labor? Clearly, the same problems that were problems years ago continue to be problems. For example, growing world population tends to lead to diminishing returns with respect to human labor, because resources such as arable land and fresh water are close to fixed. Greater world population means that on average, each gets person less. Oil production is not rising as rapidly as world population, so the quantity available per person tends to drop as world population rises.

Soil degradation is another issue, according to David Montgomery, in Dirt: The Erosion of Civilizations(2007). Declining quality of ores for metals is another issue. The ores that are cheapest to extract are extracted first. We later move on to poorer quality ores, and ores in less accessible locations. These require more oil and other fossil fuels for extraction, leaving less for other purposes.

There are other more-modern issues as well. Growing populations in areas where water is scarce lead to the need for desalination plants. These desalination plants use huge amounts of fossil fuel resources (oil in the case of Saudi Arabia) (Lee 2010), leaving less energy resources for other purposes.

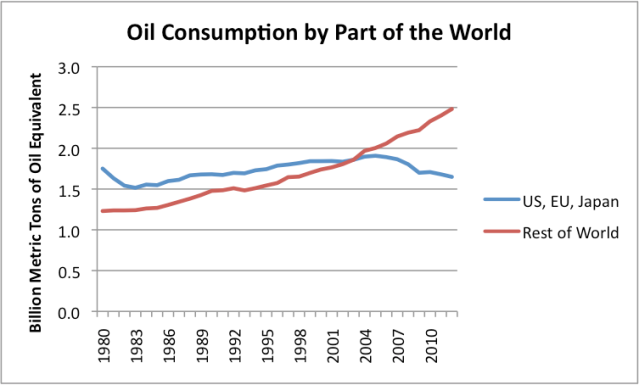
Globalization is another issue. As the developing world uses more oil, less oil is available for the part of the world that historically has used more oil per capita. The countries with falling oil consumption tend to be the ones that recently have had the most problems with recession and job loss.

Figure 3. Oil consumption based on BP's 2013 Statistical Review of World Energy.Figure 3. Oil consumption based on BP’s 2013 Statistical Review of World Energy.

An indirect part of diminishing returns with respect to human labor has to do with what proportion of the citizens is actually able to find full-time work in the paid labor force, and whether the jobs available are actually using their training and abilities. The Bureau of Labor Statistics calculates increases in output per hour of paid labor. I would argue that this is not a broad enough measure. We really need a measure of output per available full-time worker.

Obviously, there are potential offsets. We hear much about technology improvements and increased efficiency offsetting whatever other problems may occur. To me, the real test of whether there is diminishing returns with respect to human labor is how wages are trending, especially median wages. If these are not keeping up with inflation, there is a problem.

Conclusion

We don’t often think about the return on human labor, and how the return on human labor could reach diminishing returns. In fact, human labor is the most basic source of energy we have. Stagnating wages and higher unemployment of the type experienced recently by the United States, much of Europe, and Japan look distressingly like diminishing returns to human labor.

Stagnation of wages is happening despite attempts by governments to prop up the economy using deficit spending, artificially low interest rates, and Quantitative Easing. Without these interventions, the results would likely be even worse. If QE is removed, or if interest rates rise on their own, there seems to be a distinct possibility that these countries will be reaching the “crisis” phase as described by Turchin and Nefedov.

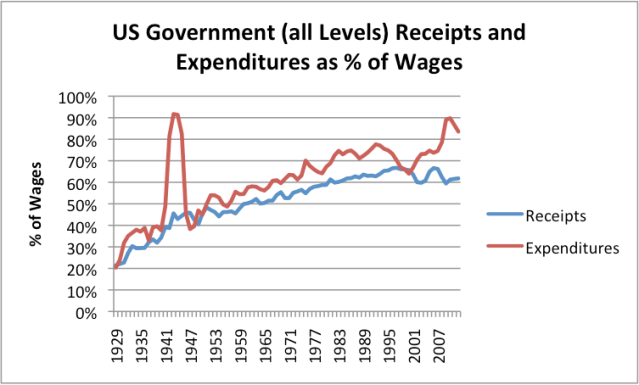
Historical experience suggests that a major danger of diminishing returns to human labor is that governments costs will rise so high, and wages will drop so low, that it will be impossible for the government to collect enough taxes from wage-earners. In fact, there seems to be evidence we are already headed in this direction. Figure 4 (below) shows that  the US ratio of government spending to wages has been rising since 1929. Government receipts have leveled off in recent years.

Figure 4. Based on Table 2.1 and Table 3.1 of Bureau of Economic Analysis data. Government spending includes Federal, State, and Local programs.Figure 4. Based on Table 2.1 and Table 3.1 of Bureau of Economic Analysis data. Government spending includes Federal, State, and Local programs.

Adding more health care services under the Affordable Care Act will only increase this trend toward growing government expenditures.

One issue is how the financial benefit of human labor (together with the energy sources leveraging this labor) is split among businesses, governments, and humans. Businesses have the most control in this. If an endeavor is not profitable, they can discontinue it. If cheaper labor is available elsewhere, they can cut hold down wages in countries with higher wages. They also have the option of increased mechanization. Humans and governments both tend to get shortchanged. As the overall return of the system reaches limits, wages of humans tend to stagnate. Governments find themselves with greater and greater costs, and more and more difficulty collecting funds from increasingly impoverished citizens.

Most authors of academic articles assume that the challenge we are facing is one that can be solved over the next, say, fifty years. They also seem to believe that the fixes required are simply small adjustments to our current economy. This assumption seems optimistic, if we are really approaching financial collapse.

If we are in fact near the crisis stage described by Turchin and Nefedov, we will need to do something much closer to “start over”. We need to build a new economy that will work, rather than just “tweak” the current one. New (or radically changed) government and financial systems will likely be needed–ones that are much less expensive for taxpayers to fund. We are also likely to need to cut back on basic services, including maintaining paved roads and repairing long-distance electricity transmission lines.

Because of these changes, whole new ways of doing things will be needed. EROI analyses that have been to date represent analyses of how our current system operates. If major changes are needed, their indications may no longer be relevant. We cannot simply go backward, because methods that worked in the past, such as using draft horses and buggy whips, will no longer be available without a long development period. We are truly facing an unprecedented situation–one that is very hard to prepare for.

See the original article >>

The US Dollar Extends its Bullish Flag Formation. Weekend Update December 6, 2013

by Anthony M. Cherniawski

VIX

– VIX broke out above its support/resistance cluster between 13.33 and 14.16, then closed within the group. It now has a “green light” for a higher rally. The next breakout point may be near 21.00, at the neckline of a complex inverted Head & Shoulders formation.

SPX challenges its trendline, closes above it.

SPX

– SPX challenged its Short-term support at 1773.00, but closed above its Ending Diagonal trendline and Cycle Top support this week at 1798.44. It was not able to surpass its Thanksgiving “peak week” performance, so this week’s attempt is no surprise. As much as it “back loaded” all of its gains on Friday, it still posted the first weekly loss in two months..

(ZeroHedge) Despite every effort to sell as much JPY as possible to lift stocks and create the best run for the S&P since 2004, the algos failed (by pennies) but with solid gains nevertheless just to disprove all the good news is bad news believers – for now. While the NASDAQ managed a green close on the week (though underperformed today), stocks couldn’t quite make it all back today but broke the 5-day losing streak.

NDX is at double resistance.

NDX

– This week NDX rose above its Massive Ending Diagonal but stayed beneath the upper trendline of the Broadening Wedge formation. While Ending Diagonals often have throw-overs, Broadening Tops do not. This suggests that NDX may be approaching the end of the line as it presses to meet the Broadening Top trendline for the last time.

(ZeroHedge) As equities celebrate today’s better than expected jobs report (for now), apparently comfortable in the knowledge that it’s good-enough-but-not-too-good, we are reminded that just six short months ago, none other than the Fed chairman himself uttered these crucial words during his June 19th press conference:

“…when asset purchases ultimately come to an end the unemployment rate would likely be in the vicinity of 7%”

The Euro made a 77.4% retracement.

XEU

– The Euro bounce may be over after a 77.4 % retracement of its decline from the October 24 high. The bounce appears to be complete, since the Cycles Model suggests the Euro may be due for a significant low by the end of the year.

(BBCNews) Ukraine’s President Viktor Yanukovych and his Russian counterpart Vladimir Putin have held surprise talks on a “strategic partnership treaty”.

Mr Yanukovych flew from China to Sochi in southern Russia for the meeting. He also cancelled a visit to Malta. Last month he shelved a partnership deal with the EU, triggering angry protests in Ukraine’s capital Kiev.

The Yen slides toward its Head & Shoulders neckline.

XJY

–The Yen continues its slide toward the Head & Shoulders neckline at 96.00. The Yen may break down beneath the neckline in a Primary Wave [5] in a very strong Primary Cycle decline through that may last into the New Year.

(ZeroHedge) Shinzo Abe secured final passage of a bill granting Japan’s govt sweeping powers to declare state secrets. The Bill won final approval of the measures at about 11:20 p.m. Tokyo time after opposition parties first forced a no-confidence vote in Abe’s govt in the lower house. The first rule of the pending Japan’s Special Secrets Bill is that what will be a secret is secret. The right to know has now been officially superseded by the right of the government to make sure you don’t know what they don’t want you to know.

The US Dollar extends its bullish Flag formation.

US Dollar

– USD appears to have extended its bullish Flag formation to retest the lower trendline of its massive Triangle Formation. Despite the further decline, this may imply a potential breakout above the Head & Shoulders neckline in the very near future. The bear trap for dollar shorts may be sprung as early as Monday, which is due for a major Cycle turn.

(Reuters) – Currency speculators trimmed their bets in favor of the U.S. dollar in the latest week, according to data from the Commodity Futures Trading Commission and Thomson Reuters released on Friday.

The value of the dollar’s net long position slipped to $19.85 billion in the week ended Dec. 3, from $20.39 billion the week before. It was, however, the fifth straight week of long positions in the U.S. dollar.

Gold tests its Head & Shoulders neckline…from beneath.

Gold

– Gold fell beneath its small Head & Shoulders neckline at 1235.00 and tested the neckline from beneath. It is also now beneath its Cycle Bottom resistance at 1234.16. This is a double warning against anyone contemplating a purchase of gold or anyone who is long. The losses will mount higher.

(ZeroHedge) As we showed back in April, the marginal cost of production of gold (90% percentile) in 2013 was estimated at between $1250 and $1300 including capex. Which means that as of a few days ago, gold is now trading well below not only the cash cost, but is rapidly approaching the marginal cash cost of $1125…

Treasuries crossing the Broadening Wedge.

USB

– USB appears to be ready to cross Cycle Bottom Support at 129.45 and its Broadening Wedge trendline at 129.71 with devastating consequences for the Long Bond.

(ZeroHedge) While nobody is impressed by breaking equity and options markets anymore, since this has become a virtually daily occurrence and the habituation level is high, bond markets, and especially the US government’s “guaranteed” bond issuance machinery, are a different matter altogether. Which is why any time something out of the ordinary happens, people pay attention. Such as what happened moments ago when the US Treasury announced that it would delay the closing of the 3 and 6 month Bill auctions, originally scheduled to close today (Monday), to tomorrow (Tuesday).

Crude rallies off its Cycle low.

WTIC

– Crude began its final rally this week. Last week I suggested, “… if it makes a low in the next week or so at or above 87.50, the Broadening Wedge may be the dominant formation for up to 2 months.” While WTIC may pull back to its mid-Cycle support at 96.17 in the next week or so, the rally is young and as yet undeveloped. Once it breaks above weekly Intermediate-term resistance at 98.38, the rally may gain even more strength.

(AP) The price of oil rose again Friday on signs of a stronger job market in the U.S. and finished the week with a gain of more than 5 percent. Those gains are showing up at the gas pump. The average price of a gallon of gasoline in the U.S. rose 1 cent to $3.26, the first increase in 10 days. Benchmark U.S. crude for January delivery rose 27 cents at $97.65 a barrel on the New York Mercantile Exchange. The increase for the week was $4.93 a barrel.

Shanghai Index

China stocks close above mid-Cycle resistance.

–The Shanghai Index rally closed above mid-Cycle resistance at 2229.50, but hasn’t overcome its September high. SSEC made its Master Cycle low on November 14, so a reversal in the next week may be very bearish. The next probable Pivot day is Tuesday, so China stock investors must stay on the alert.

(ZeroHedge) As we noted earlier, pollution in Shanghai has reached record levels causing the government to ban cars and cut production across factories. The images below are not photoshopped or edited… this is the day–to-day life in that bustling city looks like… and in case you thought moving inside was ‘safe’, “the fog” is creeping into the buildings too now… All we are waiting for now is the rotting corpses of over-capacity Chinese industries to come out of the dark…

Has the India Nifty finished its correction?

CNX Nifty

– The India Nifty index regained its losses from two weeks ago, but has not exceeded its October high. This suggests the current Cycle may resume its decline into the end of December. The next bounce may be near Intermediate-term support at 5947.12. The potential for a panic decline to the weekly Cycle bottom is very high.

The Bank Index showing signs of weakness.

BKX

– BKX tested its Short-term support at 65.95 this weekand closed lower for the week. On Friday it made a 56.6% retracement of its decline and may be ready for the next leg down. Next week BKX may be involved in a Flash Crash.

(ZeroHedge) Overnight, the WSJ reported a financial factoid well-known to regular readers: namely that as a result of a broken system that ever since the LTCM bailout has encouraged banks to become take on so much risk they become systematically important (as in their failure would “end capitalism as we know it”), and thus Too Big To Fail, there has been an unprecedented roll-up of existing financial institutions especially among the top, while the smaller, less “relevant”, if far more prudent banks have been forced out of business. “The decline in bank numbers, from a peak of more than 18,000, has come almost entirely in the form of exits by banks with less than $100 million in assets, with the bulk occurring between 1984 and 2011. More than 10,000 banks left the industry during that period as a result of mergers, consolidations or failures, FDIC data show. About 17% of the banks collapsed.”

(ZeroHedge) It is amazing what a few short months of intense regulatory scrutiny, a few multi-billion fines, and the occasional janitorial arrest can do to fraudulent bank business lines. First, recall that as we showed a week ago, and as we have been saying for the past five years, banks were recently “found” to manipulate, in a criminal sense, pretty much everything. Then recall that yesterday the European Union lobbed the biggest monetary fine in history against bank cartel behavior, with the guiltiest party, at least based on monetary amounts, being Deutsche Bank. So now that outsized profits as a result of illegal “trading” become virtually impossible to procure, what is a self-respectable criminal enterprise to do?

See the original article >>

Sugar prices revive as Brazil output tumbles

by Agrimoney.com

Sugar prices recouped losses after data showed a sharp slowdown in output in Brazil's key Centre South district, as rains delayed cane harvesting and mills processed most of what was cut into ethanol.

Sugar output in the Centre South - responsible for some 90% of volumes in Brazil, the top producing country – fell to 1.44m tonnes in the second half of November, cane industry group Unica said.

While some decline had been expected in what is the end of the cane crushing season, the extent of the fall – down one-third on production in the first half of last month, and a drop of 22% year on year - surprised investors.

Raw sugar futures for March 2014 delivery recovered from losses of 0.4% before the data to reach 16.66 cents a pound, a gain of 0.7% on the day.

Rain delays

The fall in production reflected in part a drop in cane processing, with volumes falling by 24% from the first half of November as wet weather interrupted harvesting.

"The fall in the grind observed in the second half of November is due to rain that hindered the harvest in some regions," Antonio de Padua Rodrigues, the Unica technical director, said.

He also highlighted the spread of seasonal closures among mills, with the total shut for the rainy season rising to 75 by the end of last month, albeit a figure below the 94 a year before and 246 at the end of November 2011.

"As we anticipated, the cane harvest is expected to finish later for most companies this year," Mr Rodrigues added.

Sugar vs ethanol

Mills also turned a far smaller proportion of cane into sugar than usual, at 44.1%, favouring ethanol manufacture instead.

"It is natural that there is a reduction in sugar production at the end of the harvest, but this year the fall was higher than expected for the fortnight," Mr Rodrigues said.

He attributed the dynamic to expectations of a softer domestic sugar market, and the growing appeal of the Brazilian ethanol market.

See the original article >>

The bigGER picture

by Marketanthropology

To round things out a bit, we decided to take a Felix Baumgartner peak at the long-term equity market cycle. Secular lows were determined and normalized by performance (SPX) and the momentum lows as expressed by the cycles respective RSI and stochastic oscillators. Because this was such a long-term study, we utilized a quarterly scale for this big-ger picture view. 
Based on these criteria, the secular lows were determined as: Q2 1932, Q3 1974 and Q1 2009.

From a performance perspective, both of the long-term cycles (32'-73' and 74'-07') delivered similar returns (~ 2600% & ~2300%) - granted the former was approximately eight years longer. From a qualitative perspective, one could argue the 32'-73' secular bull actually delivered much smoother and superior returns, compared to the latter cycle that included the collateral damages of the Tech-Bubble bursting.

Click to enlarge images

Should the current market follow in the performance cadence of the 1980 breakout, the market is likely close to making an interim high - before retesting the previous resistance levels from earlier in the year.

To reconcile this perspective with long-term support which currently sits ~ 1600, a consolidating range for 2014 above the Meridian would present participants with a frustrating environment for both bulls and bears alike. Food for thought. 

See the original article >>

Follow Us