by Greg Harmon
This morning begins a year end series taking a longer perspective in many market indexes, macro related commodities, currency and bonds. Over the next three weeks these reviews are intended to help create a high level road map for the the next twelve months and beyond. We begin with Copper.
Copper ($JJC, $HG_F) is the metal that the analysts say has a PhD in economics. This is because its strength or weakness is supposed to foretell the future direction of the economy. But it only takes a quick look at the monthly chart of the Copper with the S&P 500 in the background to see that for a full 35 years from 1970 until 2005 Copper was in a tight range while the S&P 500 went like gangbusters from 1995 on. The only period where Copper seems to have any correlation to the equity market is from 2004 through to 2011. It has not been correlated since then. PhD? I do not think so.
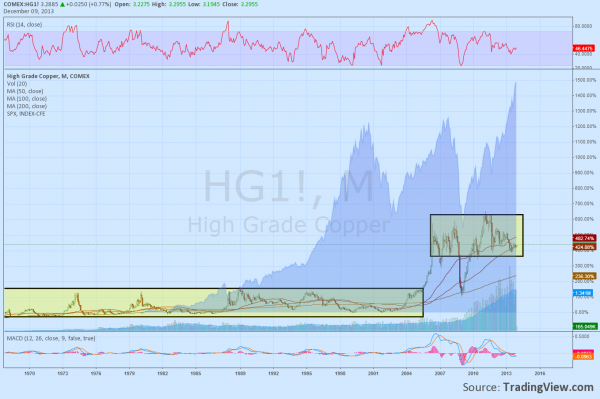
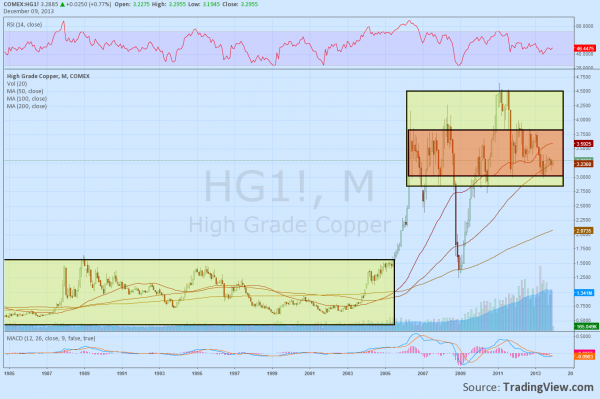
So stripped of its PhD, we can look at it purely for its price activity. Doing so reveals that the range for 35 years was a tight $1 range between 50 cents and $1.50. The run up for the most part brought the price to a new higher range. The Financial crisis did rip it back lower as all assets became correlated and after a brief overshoot to the upside, it seems to be setting into the new range between $3.00 and $3.80 on this large time scale. Back to boring.
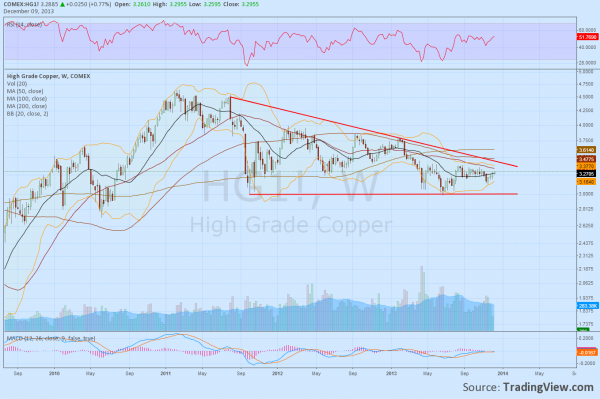
The wide 80 cent range means that there may be the opportunity for range trading. And when you zoom in on the weekly chart the the last 2 years are setting up for a potential move. The descending triangle shown is approaching the apex as it tightens toward the bottom support. The target on a break below the support at $3.00 would be back to the top of that previous 35 year box at $1.50. If this were to happen then there would likely be talk of deflationary pressures and you should also look at Gold and US Treasuries. But technicality as it moves well beyond the 2/3 point of the triangle it is thought to lose some potential power to move. It could even morph into a tighter consolidation channel. It is just beyond that point right now. A break to the upside over the descending resistance would still find a lot of previous price history to work through until it could get above $4.00. So the longer perspective on the monthly chart does not seem in jeopardy unless it were to move below $3.00.
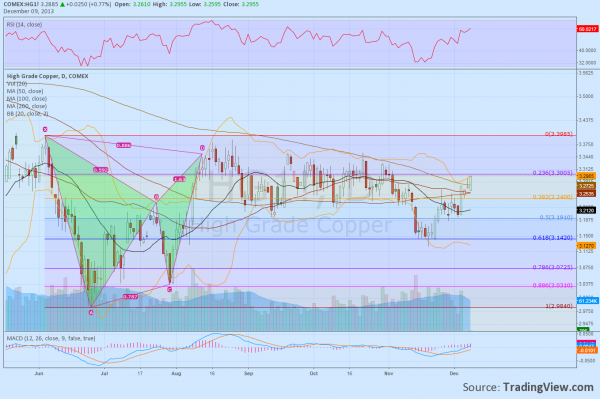
Then turning our attention to the daily chart to look for a catalyst for a move it gets a little more interesting. The recent Bat harmonic took its time to play out and turn back lower after a couple of reversal candles but finally retraced 61.8% of the pattern in November. Rather than looking like it might give a catalyst for a break below $3..00 it looks to be getting stronger. This also reinforces the monthly chart view that looks like a boring consolidation in a higher and tightening range. As a result the foreseeable future looks to be set up to move sideways between 3.00 and 3.80 or so.
No comments:
Post a Comment