Thursday, July 11, 2013

S&P 500 rises to record close while dollar weakens on Bernanke

By Paul Dobson and Inyoung Hwang

Stocks surged, with the Standard & Poor’s 500 Index climbing to its highest closing level ever, and metals gained as the dollar slid after Federal Reserve Chairman Ben S. Bernanke called for maintaining stimulus.

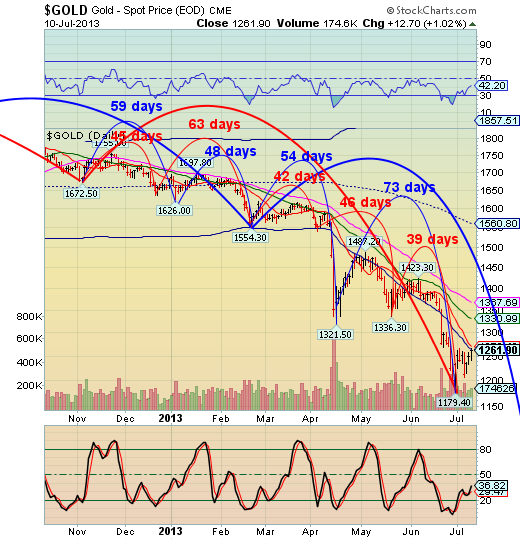
The S&P 500 rose 1.4% to 1,675.03 at 4 p.m. in New York while emerging-market stocks advanced the most in almost 10 months. Treasuries rose and gold futures rallied 3% for a fourth straight advance, the longest winning streak since April. Bloomberg’s Dollar Index, a gauge of the currency against 10 major peers, sank 1.4%. Portugal’s PSI 20 Index slid 2% and the nation’s bonds slid amid concern a political crisis will persist.

Bernanke said yesterday that “highly accommodative monetary policy for the foreseeable future is what’s needed” and minutes of the Fed’s June meeting showed officials want to see more signs of job growth before starting to scale back their $85 billion-a-month bond purchases. About $5.3 trillion was erased from global equities between May 21 and June 24 after Bernanke signaled that the central bank could start tapering asset purchases this year.

“Everyone realizes that Fed policy is going to remain extraordinarily accommodative,” Hank Smith, who oversees $7 billion as chief investment officer at Radnor, Pennsylvania- based Haverford Trust Co., said by telephone. “The market has adjusted to this and we’re back to where we were prior to the Fed’s announcement of what was really a very subtle shift in policy.”

Rally Extended

The S&P 500 rose for a sixth straight day, its longest rally since March, with trading volumes 8% higher than the 30-day average at this time of day. The benchmark index has recouped all of a 5.8% slide from May 22 to June 24 triggered after Bernanke told Congress the Fed could taper its bond purchases if the economy continues to improve. The Nasdaq-100 Index has climbed for 12 straight sessions, the longest rally in three years.

All 10 of the main industry groups in the S&P 500 advanced, with technology, utility and commodity companies leading gains. Freeport-McMoRan Copper & Gold Inc. and Newmont Mining Corp. rose at least 4.6% as gold rallied. Advanced Micro Devices Inc. rose 12% as analysts recommended that investors buy the shares.

Microsoft Corp. jumped 2.8% after saying it is reorganizing into fewer units and shuffling senior management roles to speed development of hardware and Web-based services.

Market Movers

Intel Corp. and Walt Disney Co. also climbed more than 2.5% to lead the Dow Jones Industrial Average up 169.41 points to 15,461.07 as the 30-stock gauge reclaimed a record high on a closing basis for the first time since May. The Russell 2000 Index of smaller U.S. companies jumped 1.3% to reach a record for a fifth straight day.

Benchmark 10-year Treasury yields declined 5.4 basis points to 2.57%, after climbing to 2.75% earlier this week, the highest since August 2011. German 10-year bond yields fell four basis points to 1.62%.

The number of Americans filing for unemployment benefits unexpectedly increased to a two-month high of 360,000 last week, Labor Department figures showed. The median forecast of 47 economists surveyed by Bloomberg called for a drop to 340,000. Claims are difficult to adjust in July for seasonal events such as vehicle plant shutdowns and the Independence Day holiday, a Labor Department spokesman said as the data were released.

Fed Minutes

Minutes of the Fed’s June meeting showed about half of the 19 participants in the Federal Open Market Committee wanted to halt the central bank’s bond-buying program by year end. The minutes also showed many wanted to see more signs that employment is improving before backing a reduction in the pace of asset purchases. Data last week showed U.S. employers added 195,000 jobs last month, beating the increase of 165,000 predicted by economists.

About three stocks climbed for every one that dropped in the Stoxx Europe 600 Index, which advanced 0.6%. A gauge of mining companies rallied 3.9%, its biggest gain since January. BHP Billiton Ltd. and Rio Tinto Group, the world’s two largest commodity producers, rose more than 4.5% each.

Associated British Foods Plc jumped 5.1% after reporting that sales grew 20% at its Primark clothing business in the 16 weeks to June 22.

Portugal Banks

Portugal’s Banco Comercial Portugues SA and Banco BPI SA lost more than 6% in Lisbon. Portugal’s President Anibal Cavaco Silva used a televised speech last night to call for the end of the country’s bailout program in June 2014 to coincide with the start of the process leading to new elections. Yields on the nation’s 10-year bonds rose 13 basis points to 6.90%.

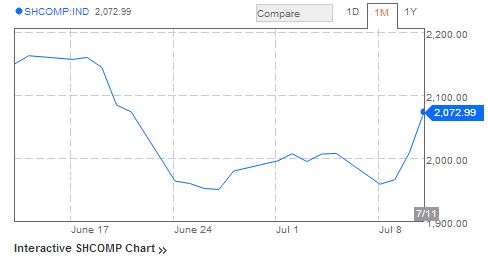
The MSCI Emerging Markets Index added 3.1%, the most since Sept. 14 on a closing basis. China’s stocks advanced the most since Dec. 14 as lenders rallied on speculation the government will take measures to bolster economic growth. Ping An Bank Co. and China Minsheng Banking Corp. jumped more than 9%, helping the Shanghai Composite Index rise 3.2%.

The cost of insuring against losses on corporate bonds dropped, with the Markit iTraxx Europe Index of credit-default swaps on 125 investment-grade companies falling 3.7 basis points to 105.66.

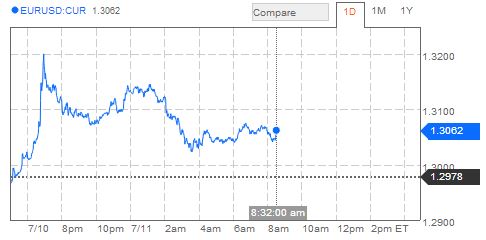
The dollar weakened against 15 of its 16 major peers as the Bloomberg Dollar Index sank to its lowest level since June 25. The euro gained for a second day, climbing 1% to $1.3109. South Korea’s won climbed 0.9% versus the dollar after the Bank of Korea held its benchmark seven-day repurchase rate unchanged at 2.5% for a second straight month today.

Yen, Rupee

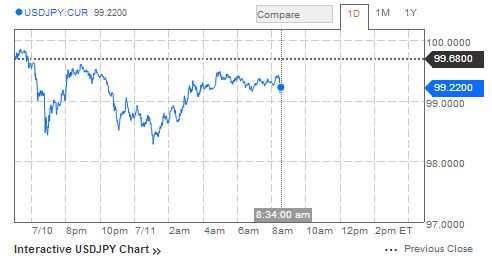
The yen strengthened 0.8% to 98.90 per dollar after the Bank of Japan said at the end of its two-day meeting today it would retain its plan for monetary stimulus.

The Indian rupee was little changed at 59.68 per dollar. The central bank may impose further curbs on rupee trading by lowering lenders’ net open position limits, according to a person with knowledge of the matter, who asked not to be identified because the information is confidential. They were referring to the amount of foreign-exchange contracts that investors can hold without opposing trade covers.

Silver for September delivery jumped 5.1% to $20.14 an ounce and gold and copper gained at least 2.5%. West Texas Intermediate oil fell 1.5% to $104.91 a barrel after rising to a 15-month high of $107.45 a barrel earlier. The S&P GSCI gauge of 24 commodities lost 0.4% after seven straight gains.

See the original article >>

“Who Is Bernanke Working For?”

by Cullen Roche

Interesting question posed here by Rick Santelli (courtesy of Zero Hedge).   Just who does Ben Bernanke work for?  It’s a complex question, but I think that understanding the institutional design of our monetary system can add some clarity to this question.

The US monetary system is designed around a payments system that is controlled and operated by private banks.  That is, the primary money in our system is created by banks who create money as debt.  And in order to engage in the US economy you basically have to play on the playing field that is the US banking system.  So, the banking system is a crucial component of the economy and the overall monetary system.  We all know that following 2008.

The Fed exists primarily to help maintain an orderly payments system.  The Reserve System is essentially a public/private hybrid system that creates cohesiveness between banks.  In addition to creating stability in the payments system, the Fed regulates banks and oversees monetary policy.

Now, all of this gets a bit tricky because the banking system is owned and operated by private entities which are owned by shareholders.  But the Fed exists primarily to keep the banks from disrupting the rest of the economy.  Yes, banking, like most capitalist entities, can be susceptible to disruptions and failure at times.  Except, when a big bank fails it can unnecessarily hurt millions of other businesses just because they rely on that bank for their operations.  Said differently, banking is such a crucial part of the economy that the Fed system operates as a stabilizer most of the time (although you could argue they make things worse some times depending on your view).

The Fed operates largely with the intent of performing public purpose.  They exist to help keep the payments system working smoothly and that benefits us all.  But the Fed is basically trying to serve two masters.  It is designed by Congress to serve public purpose, but it can only enact policy by ensuring the private entities are stable.  In other words, it works for the banks before it can work for the government.   So, I think there’s your answer.  Bernanke works for the banks first and the rest of us second.  It can be no other way since he has no other way of enacting policy other than to be serve the needs of the banking system. After all, if the private banks aren’t healthy then Bernanke can’t enact policy….

See the original article >>

Heat fears revive corn, soy prices after data blow

by Agrimoney.com

Corn and soybean prices recovered from a late-morning sell-off in Chicago as weather fears turned up a notch, offsetting relief for consumers at raised estimates for US inventories.

Soybean futures initially dropped some 1% after the US Department of Agriculture, in its much-watched Wasde crop report, raised its estimate for domestic soybean stocks at the close of 2013-14 by 30m bushels (82,000 tonnes) to 295m bushels (8.04m tonnes).

The upgrade reflected a higher figure for sowings, as revealed by an official plantings report two weeks, with the estimate for yield left unchanged at 44.5 bushels per acre.

Consumption downgrade

Chicago corn futures fell 2% after the Wasde surprised investors by making a small rise to US stocks of the grain at the close of 2013-14 too, rather than the downgrade of some 50m bushels that analysts had expected.

The figure reflected the higher-than-expected figure for US corn sowings, of 94.1m acres, unveiled by the June plantings report and an unchanged yield figure, although the USDA did make a larger allowance for abandonment, reflecting greater sowings in higher-risk states such as Texas.

Furthermore, the USDA trimmed its forecast for US corn usage of 2013 crops, both in exports, as "tight supplies of corn in early September are expected to limit early-season shipments", and in livestock feed.

Livestock consumption of 2013 crop will recover strongly, but by 50m bushels fewer than previously expected thanks to the late harvest delaying the release of supplies.

'Wait-and-see attitude'

The revisions were deemed "very neutral" by Steve Kahler, chief operating officer at Teucrium Trading who, while noting the corn and stocks stocks upgrades, flagged that investors were taking the data as possessing some element for leeway.

"I think the USDA is taking wait-and-see attitude for now over any change to its yield forecasts, given a corn crop that is developing two weeks later than normal, maybe three week, thanks to the late planting season," he told Agrimoney.com.

However, prices were helped to a late revival by a turn less clement in the US weather outlook.

"The midday GFS model turned drier from the early morning run, which had turned wetter and cooler," Darrell Holaday at Country Futures said.

November soybeans stood 0.3% up at $12.88 ¾ a bushel in late deals in Chicago, with December corn adding 0.5% to $5.24 a bushel.

See the original article >>

Ben Bernanke - Hocus Pocus or Hokey-Pokey?

By tothetick

I’m sorry but the game (and I am sure that you will all agree) is becoming rather tiresome with boorish Ben Bernanke at the Federal Reserve. I have the distinct impression that either he is doing the hokey-pokey (one foot in, one foot out, except it’s the markets that are getting shaken all about) or he is doing his Peter-and-the-Wolf pantomime number for the kids.  One minute we hear that Quantitative Easing is going completely, then it’s going a bit and withdrawing in side-steps and little paces and then it’s going to carry on. Where do we stand? He’s making the markets dizzy with all this waltzing around back and forth. Or is that the idea? Get the markets so dizzy that Quantitative Easing will be withdrawn as the masses are trying to pick themselves up from dazed and dazzled bewilderment. If that’s the objective, Ben Bernanke and the Federal Reserve are right on line. Bullseye Ben!

During last night’s talk that Ben Bernanke was giving at the national Bureau of Economic Research in Cambridge, Massachusetts (July 10th) he stated that loose monetary policy was far from over! $85 billion is being pumped into the US economy and he said that the bond-buying days were still with us. He spoke of “highly accommodative monetary policy for the foreseeable future”. He went on to state that despite the fact that analysts seem to be pretty positive about the direction the US economy is heading in (although that’s very debatable), perhaps the true rate of unemployment was higher than present figures might be suggesting. He also added that there were signs of ‘internal weakness’ in the US economy and that a 6.5% unemployment rate will not “trigger tightening by itself”. Only two weeks ago he was speaking of pulling out of Quantitative Easing and tightening the belts on the economy.

So, what is Ben Bernanke playing at? The markets reacted today to that statement favorably. China’s Shanghai Composite hiked 3.23% (+64.87 points to 2, 072.99) today. The FTSE 100 increased +0.65% (+42.36 points to 6, 547.32). The DAX went up 1.25% (+100.93 points to 8, 167.41) and the Nikkei rose +0.39% (+55.98 points to 14, 472.58). The CAC40 was also up by +1.01% (+38.81 points to 3, 879.34) at 07:52 ET today. Imagine that! Just a few words from Ben Bernanke that the Quantitative Easing will still be there and the markets rally. The power that is in that man’s hands (or mouth)! The markets feed off of it like a prophecy from the Messiah. But, having said that, maybe in two weeks there will be a change of tune and we’ll be back to square one, with the markets getting no change out of the Federal reserve at all (not even small change, for that matter).

That statement during the speech will certainly have some effect on the Dollar but also on the EU’s trouble and strife at the moment. The Dollar rallied just a few weeks ago against other world currencies and in particular caused some trouble for the Euro, making matters worse for the EU’s growing debt woes.

Dollar

The Dollar has come in for a bit of a hammering from the markets today. This is due primarily to Bernanke’s statement yesterday but also because of the minutes of the FOMC which clearly showed that there was a divergence of opinion at the Federal Reserve. Many stated in those minutes that they needed to see improvements in the unemployment rate that were far more substantial than at the present time before the taps are turned off on the loose money being dished out. There were also comments about bond buying continuing well into 2014, rather than tapering off in September and being withdrawn completely by January 2014. The Federal Reserve seems very much divided on the situation. But, will this mean that the compromise would be that tapering should begin in 2013 and end in 2014 over a longer period? If we are to judge the comments of Ben Bernanke last night no tapering will occur until the jobless rate hits below the 6.5%-mark.

The weekly report was issued today by the Bureau of Labor Statistics regarding the current situation for jobless claims. For the week ending July 6th, there were 360, 000 initial claims, which is an increase of 16, 000 on the week before (344, 000). That means a 4-week average of 351, 750 (up 6, 000). The advance (seasonally adjusted) insured unemployment rate stood at 2.3% for the week ending June 29th.

We will see what reaction that brings in the market.

The Euro rose today against the Dollar as a result of those comments. The Euro was up 0.65% against the Dollar today at 08:32 ET (+0.0084 to 1.3062).

Euro US Dollar Exchange Rate 11th July

Euro US Dollar Exchange Rate 11th July

The Dollar also fell against the Yen (-0.48% by 0.4800 to 99.2000).

Dollar Yen Exchange Rate 11th July

Dollar Yen Exchange Rate 11th July

The British Pound was up 0.65% (+0.0098 to 1.5113) at 8:33 ET today also.

GBP US Dollar Exchange Rate 11th July

GBP US Dollar Exchange Rate 11th July

The Dollar took a tumble against all major currencies, anyhow on Thursday as a direct consequence of those doubts now being raised.

EU

The statement that Bernanke made will also have some effect on the woes of the EU. If tapering starts in the US, then tapering will also probably have to start in the EU at some point and it’s far from the right time to actually do so with the number of government securities that are held by European banks at the present time.

There will be some respite for the EU, therefore. If the US continues its bond-buying then interest rates will not rise and the EU won’t have to increase their interest rates either. There are 1, 700 billion government securities that are currently on the books of European banks, which can only mean trouble at some point if interest rates rise.

So, is Ben Bernanke doing the hokey-pokey on us? Uncannily, he probably is given the fact that the origin of the words ‘hokey-pokey’ stem from ‘hocus pocus’, the traditional and well-known incantation of a magician. That itself can be traced back to Jesus Christ’s words at the Last Supper: “hoc est enim corpus meum”, meaning ‘this is my body’. We all know what happened afterwards: the bread got handed out and Jesus ended up being crucified, nailed to the cross. Ben Bernanke has done just about the same thing. He handed out the bread, didn’t he? He threw that from his helicopter to the masses below. Only one thing that is left to do now and the prophecy will come true!

See the original article >>

Should Larry Summers Replace Bernanke at the Fed?

By: Money_Morning

Garrett Baldwin writes:Just this week, the Wall Street Journal reported that former Treasury Secretary and Harvard President Larry Summers is "hell-bent" on becoming the next U.S. Federal Reserve Chairman.

The more important issue, however, is whether Americans should want Summers involved in such a prominent role in the global economy.

Arguments that favor Summers center on the fact that when the building clears out in 2014, Summers will be one of the few individuals left with significant experience in the international financial system. With Timothy Geithner gone, Ben Bernanke leaving in 2014, and departures of David Lipton at the IMF Michael Froman at USTR, Summers is considered one of the last "battle tested" individuals left. He has significant experience following the 1994 Russian crisis, the 1997 Asian Crisis and the 2008 Great Recession.

But while experience in necessary, so is the importance of accomplishments.

Critics have argued that handing the keys of the U.S. economy to Larry Summers would be equivalent to allowing a blind sheepdog to protect Americans from wolves. Summers' past 25 years of experience is riddled with questions about his ability to understand crisis, his commitment to corporate influence, and his irrational pledge to illogical academic arguments.

Given that few in Washington seem to vet political appointees of this administration, we decided to explore several important questions about Summers' potential candidacy and past understanding of the Federal Reserve's role in the global economy.

Up First, The Destruction of Brooksley Born

Perhaps the most damning case against Summers came during his role in deregulating the economy during his time as Assistant Treasury Secretary under Bill Clinton. Summers helped champion controversial legislation to repeal the Glass-Steagall Act, a Depression Era law that protected the economy by separating commercial banks from investment banks. Many people believe this repeal to be the most important underlying cause of the financial crisis.

But it was what happened just during the collapse of Long Term Capital Management in 1997 that should draw the most concern about his ability to foresee the consequences of policy. At the time, Brooksley Born, the director of the CFTC, argued that the government should provide greater regulation over OTC derivatives, the "financial weapons of mass destruction" that sank the U.S. economy in 2008. Born was a staunch advocate of increasing oversight to prevent Americans from the economic calamity they would ultimately experience.

Summers, with the help of Alan Greenspan and then Secretary Robert Rubin, dismissed her concerns and accused her of trying to cause a massive liquidity crisis just for releasing a "concept paper" about regulating derivatives. Summers argued that Born would facilitate "the worst financial crisis since the end of World War II" and that leading bankers were very upset about this potential oversight.

But we came to find out that if that were so, one should have concluded that even back in 1997, the banks were already doing something incredibly unreasonable with their derivative positions - after all Long Term Capital Management failed from improper oversight of off-balance sheet positions - the same positions Born wanted to regulate. Summers also called Born and told her regulation would reduce American competitiveness and that he was taking extensive heat from lobbyists... In the end, the story goes that Born was run out of town on a rail, and the U.S. still doesn't have strong regulation of the $1.2 quadrillion derivatives market.

Corporate Interests at Heart

The banks were not the only ones who benefited from Summers inability to grasp the concept that the derivatives markets were toxic.

At the beginning of the Enron debacle in California, Summers, Greenspan, and the disgraced Kenneth Lay were fervently arguing against then Governor Grey Davis that regulation in the state power sector were causing the significant blackouts from San Diego to Sacramento. Davis argued it was corporate tampering, but was convinced to limit environmental standards in order to "reassure the markets."

Much later, the U.S. would hear the audio tapes of Enron traders laughing as fires burned across the state and rolling blackouts continued. Of course, Summers was not involved in that, but we know now that Enron was in fact tampering with the state power sector. Enron was a major player in the derivatives markets in the late 1990s and early 2000s, leading up to their epic off-balance sheet liabilities that facilitated their collapse and doom. At best, Summers was duped by Lay, who died of a heart attack before serving what would have been a lengthy prison sentence, to assist in deregulating the California energy sector for Enron's own benefits.

Summers is a pure academic who seems to believe that markets are perfectly rational. His behavior and contempt for any form of financial oversight is ignorant to imperfections and human behavior. And that is the danger of his ideology, for he seems to believe that everyone in the sandbox is rational, when in reality, they are not. Summers frequently argued that government intervention causes "market distortions" which is entirely true. But market distortions are also caused by irrational actors like insider traders, rogue traders, or lobbyists who facilitate laws that raise leverage and thus market risk, or CEOs like Kenneth Lay.

The Stimulus Failed, But Let's Keep Spending

Summers was a Chief Economic Adviser of the Obama administration, but never seemed to understand that the definition of insanity is doing the same thing repeatedly and expecting a different result. The 2009 stimulus has failed to bring the promised unemployment rates down, but Summers will be a big spender in the Chairman role, highlighted by this very statement:

"The central irony of financial crisis is that while it is caused by too much confidence, too much borrowing and lending and too much spending, it can only be resolved with more confidence, more borrowing and lending, and more spending."

Translation: We need to continue the same insane economic policies in order to keep the music playing while the banks are able to keep this mirage of economic growth going. Pay no attention to the man behind the curtain... That's likely good news for the markets... until the country runs out of other people's money.

The reality is that Summers doesn't understand that this crisis was caused by irrational government policies that facilitated banks being able to act irrationally in the markets. Eventually the massive bubble, caused by the same forces that caused every other bubble, popped; yet men like Summers remain ignorant to global economic history.

Finally, about that Harvard Endowment...

During his time at Harvard, in the years preceding the financial crisis, the school had derivative positions of more than $3.52 billion of its endowment funding. Attributed to Summers, the school would pay nearly $500 million in termination fees to investment banks to exit these position and another nearly $500 million over 30 years. In the end, Summers lost the school about $1.8 billion, according to reports. How does one get this many chances and still be considered a genius by the people in power in Washington?

Again, his commitment to derivatives and misunderstanding of market forces seems to be concerning.

Some have argued that Summers is battle tested because he has worked in post-crisis environments before. The Obama administration is certainly wary that crisis could hit the European market, the Asian market, and the U.S. market at any time in the next three years.

But Larry Summers only reacts to crisis. He isn't capable of lifting his chin from his academic papers, and foreseeing storm clouds on the horizon.

Perhaps there are better candidates out there.

See the original article >>

Gold Major Cycle Turn Today

By: Anthony_Cherniawski

The higher retracement in gold prompted me to re-examine the Cycles Model. In doing so, I discovered that the red Master Cycle completed 235 days on June 28. In it were 4 Trading Cycles, averaging 58.5 days each and 5 Primary Cycles, averaging 47 days each. One of the ways to determine whether this is correct is that the lesser cycles will stretch or shrink to fit the Master Cycle, which we can see in the chart.

So you can see that the cycles are a complex, organic system, which follows rules within a larger context. In fact, the 25.8 year Cycle anniversary of the 1987 crash is coming up on August 8. I expect the current Master Cycle to “adjust” to that larger Cycle Timeframe, extending the Master Cycle another 41 days for a total of 276 days.

By the way, if you add 73 days from the “stretch” Trading Cycle to the 41 days left, you get a total of 114 days, making a closer-to-normal double Trading Cycle.

In the week ending July 6, the advance figure for seasonally adjusted initial claims was 360,000, an increase of 16,000 from the previous week's revised figure of 344,000. The 4-week moving average was 351,750, an increase of 6,000 from the previous week's revised average of 345,750.

This is putting a damper on the Pre-Market, which is reversing from its highs. The cash equivalent is still near 1670.00. However, today is still a major turn date, leaving the market 28-29 calendar days to make a Flash Crash low.

See the original article >>

China Contracts!

By tothetick

It looks as if China’s days of double-digit economic growth are well and truly over (at least, for the moment). Data that will be released next week (second quarter figures) will show a quarter-on-quarter slowdown that is setting in now for China’s gross domestic product. The figures will be issued on Monday, but already it seems as if there will be a rise of just 1.8% for the quarter-on-quarter figures, meaning a 7.5% rise over the past year. There are some analysts that believe however that the figures (as low as they are) are overestimated and we might be seeing an even greater slowdown in GDP growth during this second quarter. So, hold on to your hats.

China: Exports

China: Exports

Figures released yesterday showed that Chinese exports had already fallen by 3.1% in comparison with the same period last year. That was the first fall in data for exports since January 2012. Some had predicted a rise in figures of 4% and so they were way of track. Imports fell by 0.7% in June in comparison with the same time last year. There were estimates of a rise of 8%, which was far from correct. The June import fall was even worse than that for May 2013 (-0.3%). In monetary terms that meant that China’s exports to Southeast Asia dropped by $19.6 billion for June. Exports to the US fell to $29.3 billion (from $31.3 billion in May 2013). The new export-orders sub-index dropped to 45.8 and anything that is under the 50 mark shows a contraction.

The 15th July growth-data release will, according to analysts, show a drop to 7% or 7.5% in GDP growth for the second half of the year. The figures and the news will deal another blow to the Chinese economy which is already seeing troubled times due to the government in China clamping down on shadow-banking and trying to implement stricter regulations and controls. It would seem that there are other factors also that are leading to the slowdown in economic growth in China. They are having to contend with the slow tentative advances in the US economy and also the increasing trouble that is besetting recovery in the EU. Lastly, Abenomics in Japan is showing some promising improvements. That all means that China is going through the mill right now. Japan saw an increase in Q1 GDP growth to 4.1% (which was over what the Japanese government has suggested with their prediction of 3.5%). Industrial production increased in May by 2% in comparison with April’s figure and that was the 4th rise in a row. Retail sales in Japan increased by 0.8% for May also in comparison with May 2012. Despite the fact that it is not all good, the positive side for Japan is having an adverse reaction in China.

India

India

India

But there may be a silver-lining in the cloud for one country in the world if China’s economy does contract. India! India has relatively limited trade with China. Indian exports (2012-2013) stood at $13, 503 million, while its greatest trade partners are the United Arab Emirates ($36, 265.15 million) and the USA ($36, 152.30 million). India imports far more from China than it actually exports there. The value of imports stands at $54, 324.04 million) meaning that if the Chinese economy does slowdown, it will affect the Indian economy relatively little. But, what will happen is that it will benefit from lower commodity prices that will come about with the slowdown in economic activity in China and a stronger position in negotiations with the PRC.

Commodities

Copper prices

Copper prices

China has been at the heart of the increase in demand for commodities in the world, meaning that prices have tended to become inflated. If there is a reduction in that demand, prices will fall. Commodities are a cause for concern to India since they account for much of their account deficit. India imports 80% of its needs in crude oil presently, meaning that it will be a boost to their economy. China’s demand for commodities in the world has stood at 53% to as high as 111%. That means that while India will be making gains with the fall in prices around the world, those that will see the greatest losses will be suppliers of iron ore, steel or copper.

China consumes roughly 40% of copper in the world alone. The recent statement by Ben Bernanke at the Bureau of Economic Research in Cambridge yesterday that he would not withdraw Quantitative Easing in the foreseeable future had a positive effect on the price of copper. Today copper (to be delivered in September) rose 3.1% (to $3. 1875 / pound) this morning in New York. Copper that will be delivered in November rose 2.9% (to $7, 024 / ton) in London. But the rise today will need to be sustained. Copper is already suffering from an 11% fall this year on the London Metal Exchange. With the figures to be released on Monday from China, it doesn’t look as if much else could happen except consolidate that fall, despite the attempts by the Federal Reserve to calm the markets.

Some are suggesting out there that growth might be far worse than what is being predicted, however. Some are saying that it will be worse than what was experienced by China after the financial crash in 2008.

Shanghai Composite 11th July 2013

Shanghai Composite 11th July 2013

Whatever the outcome on Monday regarding the results, the Shanghai Composite didn’t seem to give two hoots as to what was going to be announced. It rallied 3.23% (up 64.87 points to 2, 072.99).

We shall see if the same holds true on Monday when the figures are published and if they are worse than expected.

See the original article >>

Draghi’s time horizon for rates seen to exceed a year

By Jana Randow and Joshua Robinson

For Mario Draghi, “an extended period of time” lasts longer than a year, according to economists surveyed after the European Central Bank president used the phrase in a pledge to keep interest rates low.

More than three-quarters of respondents in the Bloomberg monthly survey of 50 economists said that Draghi’s definition is more than 12 months, while 10 said it could be anywhere between six months and a year. The Frankfurt-based central bank will keep its benchmark interest rate unchanged until at least 2015, the median forecast of 34 economists shows.

Draghi’s unprecedented guidance last week that benchmark borrowing costs will stay at their present level or lower for a while has since sparked speculation on how long a timeframe he committed to. The euro dropped a cent on July 9 after Executive Board member Joerg Asmussen said he meant more than 12 months. The ECB clarified the the remark within hours and Executive Board member Benoit Coeure told Bloomberg Television today that officials will reassess its guidance every month.

“Short-term forward guidance doesn’t make sense because it won’t have an impact on the market,” said Kristian Toedtmann, an economist at Dekabank in Frankfurt. “The criteria Draghi cited reflect a commitment for a longer period of time.”

The ECB’s guidance “is based on the overall subdued outlook for inflation extending into the medium term, given the broad-based weakness in the real economy and subdued monetary dynamics,” Draghi said on July 4. “It is not six months, it is not 12 months -- it is an extended period of time.”

Monthly Reassessment

Asmussen didn’t intend to provide a comment on “the exact length of this period,” the ECB said in an e-mailed statement after Germany’s representative on the central bank’s board told Reuters Insider TV that the guidance goes beyond 12 months.

“It will be reassessed Governing Council after Governing Council,” Coeure said in an interview with Bloomberg Television in Paris today. “Forward guidance is not a shift in our strategy.”

The ECB said today in its monthly bulletin the commitment covers a “flexible horizon which does not pre-specify an end- date” and is “consistent but not directly linked” to the pledge to provide banks with unlimited liquidity through the first half of 2014.

Draghi’s outlook on borrowing costs followed Federal Reserve Chairman Ben S. Bernanke’s signal that the U.S. is preparing to start tapering its $85 billion-a-month bond-buying program later this year. That announcement had sent bond-yields spiraling in Europe’s debt-strapped periphery, threatening the economic recovery the ECB predicts for the end of the year.

Market Reaction

The euro slid against the dollar, while bonds and stocks rose after Draghi’s statement, which coincided with a rate outlook by the Bank of England after Mark Carney’s inaugural meeting as governor.

The “message, it seems, was understood by the market,” ECB Governing Council member Erkki Liikanen said on July 5.

The euro-area economy is struggling to emerge from the longest recession since the introduction of the single currency in 1999. Economists in the Bloomberg News survey predict the euro-area economy stagnated in the second quarter.

Gross domestic product will rise 0.1% in the three months through September and 0.2% in the subsequent two quarters, according to the median result in the survey. At the same time, unemployment is forecast to rise to a record 12.4% later this year.

‘Radical Change’

In pledging to keep rates low, the ECB departed from a tradition of never “pre-committing” to any future monetary policy. While the ECB’s version of forward guidance differs from that of other central banks, which have tied interest-rate moves to particular economic indicators or a timeframe, it signifies a “huge, radical change” in European central banking, said Frederik Ducrozet, an economist at Credit Agricole CIB in Paris.

“It’s not just a near-term communication trick, and Draghi once again proved that he isn’t helpless,” Ducrozet said. “But it’s a bit of a risky move because he could be pushed by markets for more clarity, clarity they might be unable or unwilling to provide.”

The majority of economists surveyed doesn’t expect the ECB to develop its commitment at all, while 10 of the 50 participants predict policy makers could evolve last week’s pledge with specific targets. Five forecast the addition of a time period.

‘Quite Vague’

The ECB statement was “quite vague” and “this likely hasn’t been without reason,” said Duncan De Vries, an economist at NIBC Bank NV in The Hague. “Policy makers will probably prefer to keep the interest-rate pledge as vague as possible.”

Forward guidance doesn’t mean that interest rates can’t be raised in the future if inflation picks up, ECB Governing Council member Jens Weidmann said in a speech in Munich today.

The pledge doesn’t present a “shift in strategy,” he said. “It’s an attempt to explain our monetary stance in an easier, more comprehensible way so that it is understood by preferably all market participants.”

Eventually, the ECB will have to deliver on its “vague promises,” former board member Lorenzo Bini Smaghi wrote in a guest commentary today for German newspaper Handelsblatt. He predicted that “concrete steps” will be needed in the next months, which may include another rate cut, a negative deposit rate or new longer-term refinancing operations.

For Carsten Brzeski, senior economist at ING Groep NV in Brussels, “a lot will depend on the Fed.”

“If Fed tapering starts toward the end of the year and U.S. yields continue to increase, the euro-zone periphery will suffer from increasing peripheral bond yields,” he said. In that case, “the ECB might be forced to increase its forward guidance by more specific targets.”

Draghi will repeat the phrase in his decision statements for at least six months, according to 38 of 43 economists in the survey. Of those, 15 respondents predict the commitment will remain part of his monthly remarks for more than a year.

See the original article >>

Any Green Flags For Gold?

by Tom Aspray

Recent data of ETF inflows and outflows is pretty much what most investors might expect but many have wondered whether this data can be used as a contrary indicator for various markets. The WisdomTree Japan Total TOT +1.34% Dividend Index (DXJ) that I reviewed yesterday had the largest inflow of $8.3 billion in the 1st half of 2103.

It should be no surprise that the biggest outflows—$18 billion—were in the SPDR Gold Trust (GLD), which was over double the $8.2 billion outflow from the iShares Emerging Markets (EEM). Also high on the list was the iShares Barclay TIPS Bond ETF (TIP), which lost $4.7 billion.

The bearish sentiment on gold has been very high for many months but that did not help GLD from avoiding a double digit slide in June. In the early May article, The Most Vulnerable Market, the technical outlook on both the SPDR Gold Trust (GLD) and the gold miners pointed to still lower prices.

The typical seasonal pattern is for gold to bottom in early July. In June 2012, the high negative sentiment coincided with positive technical signs that set up a good buying opportunity. Both the gold futures and the leading gold ETFs closed June below their monthly starc+ bands making them oversold but does that mean you should be looking to buy now?

chart
Click to Enlarge

Chart Analysis: The weekly chart of Comex Gold shows that prices are getting closer to the 61.8% support at $1150.80 that is calculated from the 2008 low. The low last week was $1206.90.

  • Analyzing data back to the mid-1970’s there is a seasonal tendency for gold to top on February 1, line 1.
  • The tendency is then for gold to bottom on July 5, line 2, and rise initially into October.
  • The weekly chart of the gold futures shows strong resistance now in the $1320-$1335 area, which corresponds to the April-May lows.
  • The quarterly pivot stands at $1345.40.
  • The monthly, weekly, and daily technical studies (not shown) are negative as they did confirm the recent lows.

The SPDR Gold Trust (GLD) finished 2012 at $162.07, and with Wednesday’s close, is down over 25% for the year.

  • The break of support, line a, on April 15 triggered major selling as it dropped over 5% in just two weeks.
  • The major 61.8% support is now at $111.81.
  • This decline confirmed the deterioration in the volume pattern that had been evident since February.
  • The on-balance volume (OBV) broke major support at line b, as the OBV had been below its declining WMA since late 2011.
  • The OBV rebounded back to its declining WMA in early June before the recent drop.
  • The OBV shows a pattern of lower lows (see arrow) and the longer-term uptrend, line c, has also been broken.
  • The quarterly pivot is at $129.89 which represents the first strong resistance.

chart
Click to Enlarge

The daily chart of the SPDR Trust (GLD) shows the break of support at $130.68, line a, on June 20.

  • GLD spent several days in late June at the starc- band before it rebounded.
  • The declining 20-day EMA is now at $123.80 with the starc+ band at $125.
  • The daily OBV did make a new low with prices, line c, and has just moved back above its declining WMA.
  • The OBV shows a long-term downtrend (line b) that is well above current levels.
  • There is initial support at $117.68 to $119.34 and then at $114.68, which was the June low.
  • The short-term chart pattern suggests this is a pause in the downtrend that should be followed by a further decline.

The Market Vectors Gold Miners (GDX) peaked last September at $55.25 and hit a low last week at $22.21, which was a decline of 59.8%.

  • The close below important support, line d, on February 15 was a very negative development.
  • The gap lower in April and the close below the starc- band set the stage for an eight-week sideways pattern before the decline resumed.
  • The starc- band was again tested last week with initial resistance now at $26.24 and the quarterly pivot is at $28.03.
  • The weekly starc+ band is now at $31.65 with the downtrend, line e, at $36.27.
  • The weekly OBV dropped below seven-month support, line f, at the end of March.
  • The OBV rallied back above its declining WMA in May before prices plunged again.
  • The OBV made new lows last week with prices. The monthly and daily OBV (not shown) also did confirm the recent lows.

What It Means: Though the seasonal tendencies can be quite important, significant lows or highs need to be confirmed by the technical studies.

The gold miners are now being recommended more frequently, but the technical outlook for the Market Vectors Gold Miners (GDX) and the Market Vectors Junior Gold Miners (GDXJ) show no signs yet of a significant bottom. The same is true of the SPDR Gold Trust (GLD) so a further rally is likely to just be an oversold bounce.

See the original article >>

Smart phone apps for the busy trader

By Billy Williams

Walk down the aisle of any major retail store to where the greeting cards can be found and pick any card that when opened begins a song and/or greeting. You hold an item that has more advanced computing than existed in the world prior to 1950. Technology has steadily marched forward both in terms of progress and realized potential. Likewise, over the years, stock market transactions have evolved from gentleman’s agreements under the Buttonwood tree on Wall Street in the 1800s to tickertape quotes in the early 20th century to the 21st century where any computer with internet access gives you access to virtually any market in the world.

Now, phone applications, or phone apps, make it possible for traders to gain access to the markets, research and conduct trades with breathtaking ease without the need of being tied to a computer or carrying around a laptop. From Main Street to Wall Street, traders and investors are empowered like no other time in the history in the markets that had once been the sole privilege of wealthy institutions and fund managers.

Today, almost every major brokerage and trading service now offers you a custom app that has a unique set of features to help you make informed trading decisions right from your phone or tablet. Apps give you a host of functions to execute those trades whether you are buying or selling, and whether you’re calling from a remote corner of the world (that has internet access). Even better, most of these apps are free, giving you access to services like real-time quotes, charting services, breaking headline news, earning reports and more.

Yet keep in mind not all apps are equal and that there are key features that make for a winning one that gives its user a combination of reliable technology as well as real-time functionality to gain an edge to succeed in today’s fast-moving market. In choosing apps, here are some things to decide to reduce your search time:

1)       What markets to trade: Decide on the market you’re going to trade, whether it’s going to be stocks, forex, commodities or other financials. Each market is going to have its own unique set of data feeds.

2)      What type of market you trade: There is a big difference between trading equities, futures and options. Trading stocks on margin is a much different animal than trading stock index futures on margin. Currency options are worlds apart from both cash stocks and futures. The app you use has to accommodate for the product you’re going to trade and you have to make sure the app is going to give you the necessary data to make effective trade decisions.

3)       What time period are you trading? Make sure that the phone app complements the time frame that you find yourself actively engaged in. Day trading the SPX E-minis is going to be a frustrating experience if you don’t get real-time data or, worse, if the app is buggy and doesn’t transmit the data effectively causing you to miss critical buy and sell signals.

To being our series of app reviews, we’ll start by looking at some general apps focusing mainly on stocks.

Yahoo! Finance

*For really good overall apps for general use such as quotes, basic charts, and news, there are two free choices: Yahoo Finance app and AOL’s Daily Finance app. Yahoo! Stocks is the workhorse of financial apps and is the default app of choice that comes automatically with new iPhones. It’s an intuitive and easy-to-use app for even the most technology-challenged user to check quotes and updates on stocks.

The Daily Finance app has real-time stock quotes and general use but has the added benefit of giving you the ability to track and manage multiple stock portfolios. If you designate stocks for value-, growth-, momentum-investing and/or trading, then this app can help you segregate stocks to portfolios based on their particular profile, and help you keep track of their performance.

*The E*Trade Mobile app is one of the most dependable trading apps and offers free independent research for stocks, ETFs and mutual funds, as well as landscape-mode charts and EMA/SMA technical indicators. It also lets you can access your accounts and, most importantly, place trades via both touch-screen and voice-command options. Its menu is simple to navigate to any of these areas for fast access.

etrade mobile app

*ThinkorSwim’s iSwim app offers a full featured stock trading platform, straight on your iOS or Android device. This is a reliable app because it allows you to trade off of ThinkorSwim’s platform whether its stocks, options, futures, and its features allow you help analyze risk and performance. You’ll need to start at ThinkorSwim’s original app to hook into the iSwim (if you search just for iSwim you’ll get some good info on where to swim). And you’ll have to log in to get real-time data, otherwise there is a 20-minute delay in getting info. This app also gives you the ability to “paper trade,” always a good way to learn the ropes of trading.

think or swm app

*For those traders who still are trying to figure out their trading style, or are trying to perfect it, there is theiTrade app, a stock trading simulator. The beauty of some of these apps is they allow you to real time paper trade with an “account.” The iTrade app allows you to sharpen your skills by trading the stock market without the risk. iTrade is a realistic simulation that gives you up-to-date quotes, news and access to a community of users in which you can compete against. It’ a free app but you’ll need to register prior to joining. Make sure you check out the instruction video before joining, just to make sure if it’s something that appeals to you. The designers call it a “game,” hoping it’s a fun way to learn how to trade stocks.

*Bloomberg (Bloomberg mobile) also offers a strong application for smart phones that gives you access to news from around the world, headlines, quotes, charts and tools to analyze the markets. The major benefit of using this app is that you are plugged into a network that has access to news and events worldwide while also giving you the ability to customize that content for your particular needs.

bloomberg app

Our mission

Smart phone technology allows you to have the power of instant research and information at the tips of your fingers but the number of phone apps increases every day. This creates new challenges in finding which apps will help you achieve your own particular goals  As we said, not all apps are equal. Our mission going forward is to highlight and review on a regular basis top free and paid apps for traders. We will profile those covering specific markets, specific trading information, and along the way highlight some of the best features and practices to help reduce your search time so you can focus on trading. We urge you to contact us to provide recommendations (no marketing please) and why you believe it’s an essential app for trading. Stay tuned for our next review focusing on top futures brokerage app features.

See the original article >>

Bernanke supports pressing on with stimulus amid QE debate

By Joshua Zumbrun, Craig Torres

Federal Reserve Chairman Ben S. Bernanke called for maintaining accommodation even as the minutes of policy makers’ June meeting showed them debating whether to stop bond buying by the Fed in 2013.

“Highly accommodative monetary policy for the foreseeable future is what’s needed in the U.S. economy,” Bernanke said yesterday in response to a question after a speech in Cambridge, Massachusetts.

The Fed chairman spoke just three hours after the central bank released minutes of the June 18-19 gathering showing that about half of the 19 participants in the Federal Open Market Committee wanted to halt $85 billion in monthly bond purchases by year end. At the same time, the minutes showed many Fed officials wanted to see more signs employment is improving before backing a trim to bond purchases known as quantitative easing.

The debate underscores Bernanke’s challenge in affirming that, even after starting to reduce monthly bond buying, policy makers plan to maintain unprecedented stimulus with a record- high balance sheet and near-zero target interest rate.

“It is clear they want to pull the trigger on the wind- down of QE, but they also want to calm market anxieties about raising rates for the foreseeable future,” said Ward McCarthy, chief financial economist at Jefferies Group LLC in New York and a former Richmond Fed economist. Their attempts at providing clarity are further complicated because of “pretty significant divisions among policy makers on a number of issues.”

Stocks Rise

U.S. stocks rose and bond yields fell today as Bernanke’s comments reassured investors that the days of loose U.S. monetary policy aren’t over. The Standard & Poor’s 500 index rose 1.1% to a record 1,670.72 at 9:34 a.m. in New York. The yield on the 10-year Treasury fell to 2.59% from 2.63% yesterday.

The minutes also said “several members judged that a reduction in asset purchases would likely soon be warranted.” Those members said the “cumulative decline in unemployment since the September meeting and ongoing increases in private payrolls” had increased their confidence the labor market had improved, according to the minutes.

“The many FOMC voices seem all over the map, yet they do agree the labor market improvement looks more sustainable now than it did at the time of the QE launch,” said Chris Rupkey, the chief financial economist for Bank of Tokyo-Mitsubishi UFJ Ltd. in New York. “This means to us that the program’s days are numbered.”

Jobs Report

The FOMC gathered before the Labor Department’s jobs report for the month of June -- released on July 5 -- exceeded expectations. The economy added 195,000 jobs last month and the unemployment rate was unchanged at 7.6%.

Bernanke said the central bank is trying to communicate its plans for two different policy tools. With bond purchases, the Fed is “trying to achieve a substantial improvement in the outlook for the labor market in the context of price stability. We’ve made progress on that but we still have further to go,” he said.

The Fed wields another policy tool with its benchmark interest rate, which it reduced to close to zero in December 2008. Officials have said they won’t consider raising the main interest rate until the unemployment rate falls to 6.5%, as long as long-term inflation expectations don’t exceed 2.5%.

Bernanke’s Message

“It may well be sometime after we hit 6.5% before rates reach any significant level,” Bernanke said. “So again, the overall message is accommodation. There is some prospective, gradual and possible change in the mix of instruments, but that shouldn’t be confused with the overall thrust of policy which is highly accommodative.”

The 59-year-old Fed chief said the FOMC may opt to hold interest rates near zero even after unemployment reaches 6.5% due to the possibility of low inflation. Also, the jobless rate may understate the weakness in the labor market, he said.

“What I hear him saying is that even when we slow purchases, the balance sheet still gets bigger and even if we stop the purchases the balance sheet doesn’t shrink,” said Michael Gapen, a senior U.S. economist at Barclays Plc in New York, and a former member of the Fed’s Division of Monetary Affairs. “They are trying to communicate that tapering is not a tightening of policy. That is the fine line they are walking.”

First Increase

Any decision by the Fed on the bond purchases influences how investors view its approach to the federal funds rate, Gapen said. For example, if the Fed’s outlook toward employment improves, then investors will probably shift how they view policy makers’ approach to the main interest rate.

Some 15 policy makers in June expected the first increase in the benchmark lending rate in 2015 or later. Still, fed funds futures contracts show about a 54% probability that the benchmark lending rate will be 0.5% or higher by December 2014, an increase from 22% two months ago.

Fed policy makers next meet July 30-31 in Washington. They don’t plan to update their economic forecasts, and Bernanke isn’t scheduled to hold a press conference until after their Sept. 17-18 meeting. At that gathering, the FOMC will be able to review jobs reports for July and August.

“There’s still a clear bias to taper but I think they’ve taken just a baby step back from the strength of that bias and data will matter from here,” said Julia Coronado, chief economist for North America at BNP Paribas SA in New York, and a former Fed economist. “It’s not just hiring, it’s GDP and inflation that will factor into the equation,” she said, referring to gross domestic product.

See the original article >>

Corn turns bearish as rain revives U.S. crops

By Tony C. Dreibus and Jeff Wilson

U.S. corn production is rebounding the most in two decades as farms recover from last year’s drought-plagued harvest. Hedge funds are bearish on prices for the first time since 2010.

Output this year will jump 30% to a record 13.983 billion bushels (355.2 million metric tons), according to the average of 20 analyst estimates compiled by Bloomberg. That will add enough grain to supply the 28-nation European Union and Japan for a year and more than double U.S. inventories before the harvest in 2014. Futures (CBOT:CU13) will drop 9% to $4.75 a bushel in three months, the lowest since October 2010, Goldman Sachs Group Inc. estimates.

Farmers planted the most acres since 1936 this season as some Midwest fields got three times their normal rainfall, including a record soaking in Iowa, the top growing state. Corn tumbled 18% in the cash market from the peak during last year’s drought, reducing costs for buyers including Archer- Daniels-Midland Co. and JBS SA and helping drive global food prices lower in six of the past nine months.

“The crop is going to be big,” said Hal Reed, the chief operating officer at Maumee, Ohio-based Andersons Inc., which owns terminals in seven states capable of storing 145 million bushels and produces 350 million gallons of ethanol from corn annually. “Conditions are looking very good right now. We will have lots of bushels to merchandise, more bushels to store, and cheaper corn for ethanol.”

U.S. Harvest

Futures for delivery in December, after the harvest, fell 13% to $5.22 this year on the Chicago Board of Trade. The Standard & Poor’s GSCI gauge of 24 commodities slipped 0.5% since the end of December, while the MSCI All-Country World Index of equities rose 8%. Treasuries lost 3.3%, a Bank of America Corp. index shows.

U.S. stockpiles on Sept. 30, 2014, will reach 1.895 billion bushels, from 715 million a year earlier, the analyst estimates show. The U.S. Department of Agriculture updates its forecasts today at noon in Washington.

Hedge funds turned bearish last week for the first time since April 2010, U.S. Commodity Futures Trading Commission data show. The net-short position reached 19,943 futures and options, the most since February 2009. Speculators were net-long 98,380 contracts as recently as May 28.

“We don’t see demand keeping up with the increase in supply,” said Chris Gadd, an analyst at Macquarie Group Ltd. in London who anticipates $4.50 or less before the end of the year. “Once you build that surplus, you have to sell it, and the only way to sell it is to sell it cheap.”

Wet Weather

With most of the Midwest harvest still three months away, yields can still be eroded by extreme weather. Last year’s drought, the worst since the 1930s, cut U.S. production by 13% and drove prices to a record $8.49 on Aug. 10.

Crop planting accelerated in the past month as fields dried out after unusually wet weather earlier in the season that curbed sowing to the slowest pace since 1980, USDA data show. Rainfall in parts of Illinois, Iowa, Nebraska, Kansas, Missouri and South Dakota was less than 50% of normal in the 30 days ended July 9, National Weather Service data show.

“We continue to watch dryness and building heat in the western Corn Belt, which could pressure yields,” said Bennett Meier, an analyst at Morgan Stanley in New York. Most of the crop was seeded two weeks later than normal, so plants will pollinate during the hottest, driest part of the year, he said.

Early Frost

There’s also an increased risk that corn won’t mature before freezing weather arrives, usually beginning by late September to mid-October, said Fred Gesser, the senior agricultural meteorologist for Planalytics Inc. in Berwyn, Pennsylvania. The chance of an early Midwest cold spell increased after volcanic eruptions in Russia and Alaska during the past month sent gases and ash into the atmosphere, he said.

“We’re behind normal, so right now I would say my main concern would be an early frost,” said Dave Pollock, the manager of Wiota Elevator Inc., which operates grain terminals in Wiota and Anita, Iowa.

Crop conditions improved in each of the past four weeks, with 68% rated good or excellent by July 5, USDA data show. That’s above the five-year average of 63%. A year earlier, the rating was 40% and by September had dropped to 25%.

Fields in Iowa were soaked by 17.67 inches of rain from March 1 to May 31, the wettest in records going back to 1873, according to the state climatologist. That improved conditions for the 97.4 million acres the USDA estimates was planted with corn this year.

Illinois Counties

Yields may average 190 to 200 bushels an acre in the central Illinois counties from 148 in 2012 and the 10-year average of 182.9 bushels, said Kim Craig, the head grain merchandiser for Deer Creek, Illinois-based Bell Enterprises Inc., which owns four storage facilities.

The record U.S. crop will help boost global production 12% to 962.58 million tons, while consumption expands 8.3% to 935.06 million tons, the USDA said June 12. Stockpiles will jump 23% to 152.36 million tons in the year that starts Oct. 1, the highest since 2001, according to the estimates in the Bloomberg survey.

After three years of prices above $5, or 63% more than the average over the previous decade, farmers boosted output in Argentina, Brazil, Ukraine, Europe and Canada.

Profit Boost

Ample corn supplies will help boost profit in grain handling and ethanol production for Decatur, Illinois-based ADM. Shares of the company rose 31% to $35.90 in New York trading this year. ADM will report a 12% gain in profit to $1.56 billion this year, according to the mean of six analyst estimates compiled by Bloomberg.

Lower grain prices will help JBS, the Sao Paulo-based meat producer whose businesses include the Pilgrim’s Pride Corp. poultry unit. Feed should cost “much less” in the U.S., Chief Executive Officer Wesley Mendonca Batista said in a conference call in May.

The United Nations’ cereal-price index dropped in eight of the past nine months, declining 10% since September. Global food costs are now 11% below the record they reached in February 2011.

“Markets that go high and stay high too long will endure a longer trough in prices to reach equilibrium,” said Michael Swanson, a senior agricultural economist in Minneapolis for Wells Fargo & Co., the largest U.S. farm lender. “It’s going to take a couple of years of $4 to $4.50 corn to knock this market back to reality.”

See the original article >>

Wheat prices rise as US slashes world supply hopes

by Agrimoney.com

Wheat prices extended gains after the US slashed its estimate for world stocks to a five-year low, citing raised expectations for use in China, whose imports will soar to an 18-year high.

The US Department of Agriculture, in its much-watched Wasde crop report, cut by nearly 9m tonnes to 172.4m tonnes its forecast for world wheat inventories at the close of 2013-14.

The revision, which was far bigger than the downgrade of a little under 1m tonnes that investors had expected, put inventories on course for their lowest finish in five years.

As compared with consumption, stocks will end the season at 24.7%, the lowest since 2007-08, the year that tight inventories of wheat and other cereals sent prices soaring to record highs, which still stand in US markets.

The immediate market impacted was to send wheat for September up 2.1% to $6.93 a bushel in Chicago, taking above 6% the lot's recovery from a contract low last week.

Chinese needs

The USDA lifted its estimate for world wheat production in 2013-14, citing improved prospects for Australia, where "conditions significantly improved with abundant June rainfall", and in the US itself, for which yield prospects were raised, for both hard and soft red winter wheat, and for spring wheat.

However, the upgrade was more than offset by an estimate that China was using far more wheat than had been thought in feeding livestock, in the face of elevated corn prices.

The USDA hiked its forecast for Chinese wheat feeding in both 2012-13 and 2013-14 by 5.0m tonnes to 25.0m tonnes.

Even though the department kept its estimate of the domestic crop steady at 121.0m tonnes, ignoring the advice of its Beijing bureau to cut the production figure, it hiked its estimate for Chinese wheat imports by 5.0m tonnes to 8.5m tonnes to cover some of the extra consumption needs.

US export hopes

The upgrade put Chinese wheat imports on course to hit their highest since 1995-96, and far exceeded a separate forecast on Thursday by China's own CNGOIC bureau of purchases of 5.0m tonnes this season.

However, expectations of elevated import needs gained credence through a separate report on Thursday, on weekly US exports, which showed China buying 1.03m tonnes of US wheat last week.

Factoring in 174,800 tonnes of cancellations, China has bought 2.85m tonnes of wheat from the US alone with the season only some six weeks old, and with other purchases reported from Australia and France too.

Indeed, the USDA cut its estimate for US wheat stocks at the close of this season, by 2.25m tonnes (83m bushels) despite the harvest upgrade, citing improved export hopes, "reflecting strong sales, particularly to China".

'Supportive to prices'

The USDA's revision followed a cut earlier on Thursday by the United Nations food agency, the Food and Agriculture Organization, to its estimate for world wheat stocks at the close of 2013-14, by 3.6m tonnes to 169.5m tonnes.

While the FAO raised its estimate for world production to a record 704.0m tonnes, it said that the stocks figure had been "lowered somewhat, mostly on anticipated consumption".

However, Steve Kahler, chief operating officer at Teucrium Trading, a New York-based issuer of commodity exchange traded products, warned investors against getting too carried away by ideas of reduced wheat supplies.

The USDA downgrade was "supportive to prices, but not completely bullish", he said.

"Wheat still has to price itself into feed rations, which means being competitive against other grains," Mr Kahler told Agrimoney.com.

See the original article >>

Bernanke Is Losing Control of the Fed and the Markets

by Graham Summers

Ben Bernanke has lost any last shred of credibility he might have had.

The Fed no longer believes in QE. And for good reason. We’ve seen QE 1,2,3,& 4 and yet we’ve not seen any meaningful uptick in employment or GDP growth. Indeed, since Bernanke took the reins at the Fed we’ve not seen a single year of 3+% GDP growth.

In this light, several Fed members are no longer fans of QE. Some of them want it tapered soon. In fact HALF of them want QE STOPPED completely by the end of 2013.

And yet, Bernanke decided that despite this dissent, he should make a speech stating that “highly accommodative policy” should continue along with the usual claims that inflation is under control.

These were the words of one man, not the Fed.

The markets exploded higher on Bernanke’s comments while the Dollar collapsed. And Bernanke now has a mutiny on his hands (one Fed Governor has already resigned in the last 24 hours).

Given that the Fed has been the primary driver of just about everything for the last five years, a fractured Fed is very bad news for the markets. Sure, we will see prices spike in the near term on Bernanke’s comments, but he has made it clear, point blank, that he has lost control of the market and really doesn’t have a clue what he’s doing.

This man knows only one thing: bubbles. Congratulations Bernanke, you’ve created an even bigger bubble than that of 2007. Your latest statements about providing liquidity have destroyed completely destroyed your credibility as Fed Chairman. And they’ve bought you at most a brief pause before this whole mess comes crashing down.

The entire environment feels just like 2007 again. The only difference is that this time everyone knows that we’re on shaky ground and has an eye for the exits. And in this mess, Bernanke announced nothing new, but simply stated that he remains a money printer.

See the original article >>

Sugar struggles as Brazilian currency shows weakness

By Jack Scoville

(NYBOT:SDU13)

General Comments: Futures closed lower on a weaker Brazilian real against the U.S. dollar. UNICA showed less production in the second half of June, but this had been expected by the trade. Any expect production to be higher overall due to a record Sugarcane production and better weather now. Sao Paulo was on holiday yesterday to keep action from there on the quiet side. Futures trends remain down overall, and New York prices had an outside day down yesterday, implying further losses are possible this week. There is still a lot of Sugar around, and not only from Brazil. The Indian monsoon is off to a good start and this should help with Sugarcane production in the country. Northern areas are in good shape, but southern areas might be too hot and dry and some stress to the Sugarcane is possible in the short term. In addition, industry sources there told wire services this week that planted area is down by about 5% and that overall production would be lower even with very good weather.

Overnight News: Mostly dry weather is forecast in Brazil. Temperatures should average near to above normal. USDA bought 91,238 tons of Sugar from US producers yesterday.

Chart Trends: Trends in New York are mixed to down with objectives of 1580 October. Support is at 1620, 1600, and 1570 October, and resistance is at 1650, 1665, and 1690 October. Trends in London are mixed to down with objectives of 465.00 and 448.00 October. Support is at 470.00, 469.00, and 466.00 October, and resistance is at 476.00, 480.00, and 485.00 October.

COTTON (NYBOT:CTV13)

General Comments: Futures were higher on a weaker US Dollar that helped demand ideas and also on ideas that crop conditions are getting worse in Texas. Traders were also getting prepared for the next round of USDA supply and demand estimates today. Parts of the Southeast are getting too much rain and Texas growing areas remain mostly hot and dry. Conditions in Alabama, Mississippi, and Missouri are below average now. Futures held the short term range. It is possible that futures can work lower again as demand has turned soft, but production and weather might be more important in the short term. Weather for Cotton appears good in India, Pakistan, and China.

Overnight News: The Delta should be dry and Southeast will see showers and rains Thursday through the weekend. Temperatures will average near normal. Texas will be mostly dry. Temperatures will average above normal. The USDA spot price is now 82.89 ct/lb. ICE said that certified Cotton stocks are now 0.606 million bales, from 0.612 million yesterday. ICE said that 70 notices were posted today and that total deliveries are now 2,943 contracts. USDA said that net Upland Cotton export sales were 32,700 bales this year and 58,000 bales next year. Net Pima sales were 100 bales this year and 0 bales next year.

Chart Trends: Trends in Cotton are mixed. Support is at 86.00, 85.20, and 84.00 October, with resistance of 87.00, 87.45, and 88.00 October.

FCOJ

General Comments: Futures closed lower again as tropical system Chantal began to fade and became less a threat to groves. Some speculative profit taking was noted by traders as many look forward to new production data from USDA today. Ideas are that production will be unchanged. The tropical system is too late to hurt the current production as the harvest is mostly over, but a big storm now could severely impact the coming production. Showers are reported and conditions are said to have improved in almost the entire state. Ideas are that the better precipitation will help trees fight the greening disease. Temperatures are warm in the state, but there are showers reported. Brazil is seeing near to above normal temperatures and mostly dry weather.

Overnight News: Florida weather forecasts call for showers. Temperatures will average near to above normal. ICE said that 0 delivery notices were posted today and that total deliveries for the month are now 0 contracts.

Chart Trends: Trends in FCOJ are mixed to up with objectives of 145.00 and 155.00 September. Support is at 132.00, 130.00, and 127.00 September, with resistance at 138.00, 139.00, and 140.00 September.

COFFEE

General Comments: Futures were lower in New York and Sao Paulo on some long liquidation and new selling tied to a weaker Brazilian Real against the US Dollar. London moved higher on some speculative buying tied to less offer from Vietnam on ideas that producers there are about sold out. Offers from origin are still hard to find. Demand was not much stronger than the offer and the cash market remains very quiet. Sellers, including Brazil, are quiet and are waiting for better prices of the next crop. Buyers are interested on cheap differentials, and cheap futures. Brazil weather is forecast to show dry conditions, but no cold weather. Current crop development is still good this year. Central America crops are seeing good rains now. Colombia is reported to have good conditions.

Overnight News: Certified stocks are higher today and are about 2.745 million bags. The ICO composite price is now 117.86 ct/lb. Brazil should get dry weather except for some showers in the northeast. Temperatures will average near to above normal. Colombia should get scattered showers, and Central America and Mexico should get showers, and rains. Temperatures should average near to above normal. ICE said that 0 delivery notices were posted against July today and that total deliveries for the month are now 810 contracts.

Chart Trends: Trends in New York are mixed. Support is at 120.00, 117.00, and 116.00 September, and resistance is at 125.00, 126.00, and 127.00 September. Trends in London are up with objectives of 1900 September. Support is at 1820, 1790, and 1755 September, and resistance is at 1880, 1905, and 1940 September. Trends in Sao Paulo are mixed. Support is at 143.50, 140.00, and 137.00 September, and resistance is at 148.00, 150.00, and 151.00 September.

COCOA

General Comments: Futures closed lower in range trading. Many are waiting for the US and European grind data to be released next week to see how strong the demand is right now. Ideas of good harvest weather and active movement of beans to ports in western Africa remain. The cash market in Africa is slow right now as buyers have already bought and are now waiting to see how the main crop turns out late this year. The weather is good in West Africa, with more moderate temperatures and some rains. Some showers are appearing again in Ivory Coast this week, and the rest of the region is in good condition. Ivory Coast will still need more rain. Malaysia and Indonesia crops appear to be in good condition and weather is called favorable. Chart trends are mixed, but price action is weak.

Overnight News: Scattered showers are expected in West Africa. Temperatures will average near to above normal. Malaysia and Indonesia should see episodes of isolated showers. Temperatures should average near normal. Brazil will get mostly dry conditions and warm temperatures. ICE certified stocks are higher today at 4.886 million bags. ICE said that 1 delivery notice were posted today and that total deliveries for the month are 376 contracts.

Chart Trends: Trends in New York are mixed. Support is at 2165, 2130, and 2100 September, with resistance at 2210, 2250, and 2280 September. Trends in London are mixed. Support is at 1500, 1460, and 1445 September, with resistance at 1550, 1560, and 1600 September.

See the original article >>

Oil leads commodities to 8-day streak higher

By Phil Flynn

Oil (NYMEX:CLQ13) demand is surging and commodities are on a tear as Ben Bernanke helps add into a buying frenzy. Oil and gasoline have led the commodities market to an eight-day winning streak, the best since 2010. The Energy Information Administration set the tone by reporting another massive drawdown in crude supply and surprisingly strong oil demand. U.S. refiners went on a tear refining over 16 million barrels a day for the second week in a row for the best back-to-back weeks since the beginning of the financial crisis responding to the strongest demand for gasoline in nine months. The only fear the bulls have is Egypt and being overbought.

While it seemed that oil was rolling on concerns about Egypt is it is now clear that there is more to the recent oil rally.  Refining runs hit an impressive 92.4%. That helped crude supply drop by a whopping 9.9 million barrels. Now normally one might expect to see products build but gasoline supply fell by 2.6 million barrels a sign that gasoline demand is going crazy.

At the same time we had refining issues. Dow Jones reported that New York Harbor spot market reformulated-gasoline blendstock, or RBOB, premiums continued to widen Wednesday amid talk of gasoline production problems at Canada's largest refinery.  Traders doing business with Irving Oil said the independent refiner has been buying F2-grade RBOB throughout the week so far, lifting premiums by about 2.75 cents.

Bloomberg reported "Gasoline rose above $3 a gallon for the first time since April after a report that inventories dropped the most in 11 weeks and demand reached the highest level since August.  Futures jumped to a three-month high. The Energy Information Administration reported that gasoline supplies fell 2.63 million barrels to 221 million, the fewest since May 31 and the biggest drop since April 19. Demand increased for a fourth straight week to 9.3 million barrels a day, the highest since Aug. 10.  "Gasoline is looking better," said Andrew Lebow, a senior vice president at Jefferies Bache LLC in New York.

The EIA total products supplied over the last four-week period averaged about 19.3 million barrels per day, up by 1.6% from the same period last year. Over the last four weeks, motor gasoline product supplied averaged 9.1 million barrels per day, up by 2.5% from the same period last year. Distillate fuel product supplied averaged about 4.1 million barrels per day over the last four weeks, up by 12.3% from the same period last year. Jet fuel product supplied is 2.9% higher over the last four weeks compared to the same four-week period last year.

David Bird of Dow Jones writes "U.S. refiners are cranking out gasoline at record rates. But gasoline sales are increasing to China, Argentina, Ecuador and elsewhere, amid slowing consumption by American motorists. Net exports of gasoline in the first four months of 2013 are up 44,000 barrels a day from the same period a year earlier, to a record 377,500 barrels a day, government data show.  At the same time, U.S. gasoline demand is down 61,750 barrels a day to a 12-year low of 8.5 million barrels a day.

David Bird says "Excess gasoline supplies in the U.S. are finding a home abroad, where emerging markets want high-quality fuel to feed their growing needs. U.S. refiners also have been able to offer competitive prices because of low domestic crude costs. At the same time, in the U.S., drivers are using more fuel-efficient vehicles, which is denting demand.  U.S. refiners, returning from seasonal maintenance and flush with rising supplies from surging shale-oil fields, are pulling down crude stockpiles, which were at an 82-year high as recently as late May. The abundant supply represented by the stockpiles had kept U.S. oil prices trading at a discount to global crude."

Then you had Old Ben Bernanke. It seems the market likes what he said and is convinced that this taper talk is on the back burner. Not only is it on the back burner, but it's been said that accommodative monetary policy is needed for the foreseeable future even after the unemployment rate falls to 6.5%.

Bloomberg News is reporting that The International Energy Agency sees a 20-year supply peak outpacing demand. Oil supply will outstrip an acceleration in demand growth next year as production outside of OPEC expands at the fastest pace in 20 years, the International Energy Agency predicted. World oil consumption will climb by 1.2 million barrels a day next year, up from 930,000 a day in 2013, the IEA said in its first monthly report with forecasts for 2014. Supplies from outside the Organization of Petroleum Exporting Countries will jump by 1.3 million barrels a day amid booming output in North America, shrinking the need for crude from the 12-member producer group, according to the report. The assessment should "give bulls some cause for alarm," the Paris-based adviser to oil-consuming nations said. "While demand growth is also forecast to pick up momentum," this "will still fall short of forecast non-OPEC supply growth."

Brent crude has lost about 2% this year, trading today near $109 a barrel on the London-based ICE Futures Europe exchange, as economic stagnation in Europe, slowing expansion in China and threats to recovery in the U.S. constrain fuel consumption. Dependence on OPEC is dwindling as new drilling techniques enable the U.S. and Canada to unlock reserves from rock formations deep underground. Global demand will average 92 million barrels a day in 2014, advancing by 1.2 million barrels a day, or 1.3 percent from this year, according to the IEA report. The agency said that today's forecast hasn't yet incorporated a reduction to 2013 economic growth estimates made by the International Monetary Fund on July 9. The Washington-based IMF trimmed its projection for global growth this year to3.1 percent, from 3.3 percent. The agency boosted its estimate for demand in 2013 by 220,000 barrels a day from last month's report, estimating that oil use will expand by 930,000 barrels a day, or 1 percent, to 90.77 million a day this year. The revision, the third increase to the 2013 outlook to be made this year, was driven by unusually cold weather in the second quarter.

Nat Gas Report Today! Short term - Cool Temperatures have been weighing on the market. Long Term - The story is getting more intriguing. Reuters reports "A bipartisan group of U.S. senators on Wednesday called on the Energy Department to speed up its planned review process for proposals to ship U.S. liquefied natural gas (LNG) abroad.  ‘We are concerned that the timeline for considering these applications may jeopardize our ability to retain a competitive position against other natural gas exporting nations,’ more than two dozen lawmakers, including top Senate Republican Mitch McConnell, said in a letter to Energy Secretary Ernest Moniz.”

See the original article >>

Currencies Go Berserk As Bernanke Kills King Dollar

by Tyler Durden

We noted earlier the brief chaos that the minutes created but - following Bernanke's promise to print moar - the after-hours collapse in the USD against every major (and minor) currency pair in the world is tremendous. USDJPY is over 200 pips off the day's highs (JPY surging below 98.50), GBPUSD is getting smashed higher (+275 pips from pre-close), and EURUSD is screaming higher (up 220 pips from the US close breaking above 1.3200). Retaliation for Carney and Draghi's comments? Who knows... but the currency wars are back on (and the 'other' currency is surging to $1290 per ounce).

and a little context...

For those who want a comp of the magnitude for the EURUSD's nearly 300 pip move so far, the EURUSD moved just a little more, or 370 pips, on March 18, 2009, when the Fed announced QE1!

See the original article >>

Follow Us