Tuesday, December 3, 2013

U.S. Dollar Crisis is the Next Black Swan, Gold Bottom

By: Toby_Connor

Analysts everywhere appear to be wondering what could possibly be the catalyst to turn the gold market around. I maintain it's the same catalyst that drove the gold bull market from 2001 to 2011. Out of control currency debasement.

Does anyone seriously think that we can print trillions of dollars out of thin air for five years and not eventually have something bad happen? The next the black swan is already staring us in the face. It's going to be a collapse in the purchasing power of the US dollar.

Since the beginning of the year the dollar has been showing signs of extreme stress as it began to oscillate violently back and forth in what is known as a megaphone topping pattern. When this pattern breaks to the downside it is going to initiate the beginning stages of what will likely be a fairly severe currency crisis by next fall.

In this environment I think it's going to be impossible for the manipulation in the gold market to continue. As a matter of fact I got a signal last Tuesday that indicates to me that the forces trying to manipulate gold down to $1000 have probably thrown in the towel and given up, realizing that an impending dollar crisis is about to begin.

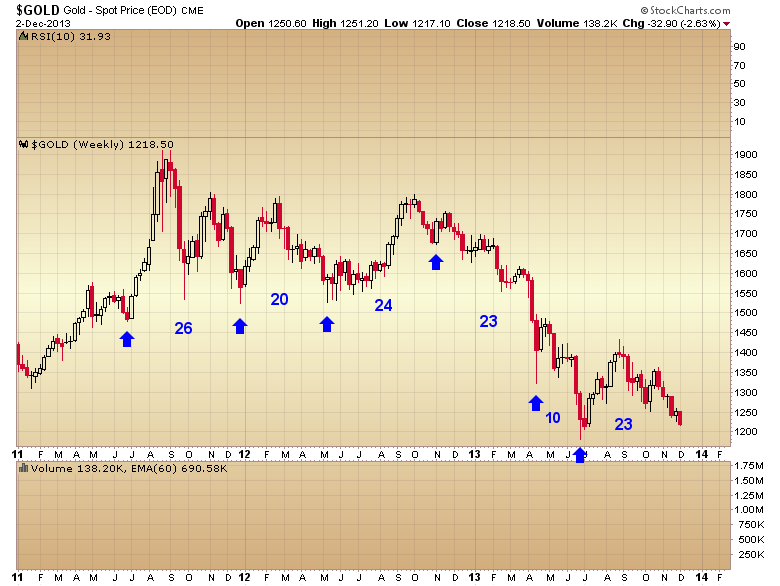
On a cyclical analysis basis, the intermediate cycle is now running out of time for a move all the way back to the $1000 level. As you can see in the chart below the average duration for an intermediate degree cycle is between 20-25 weeks. Currently gold is on the 23rd week of this cycle.

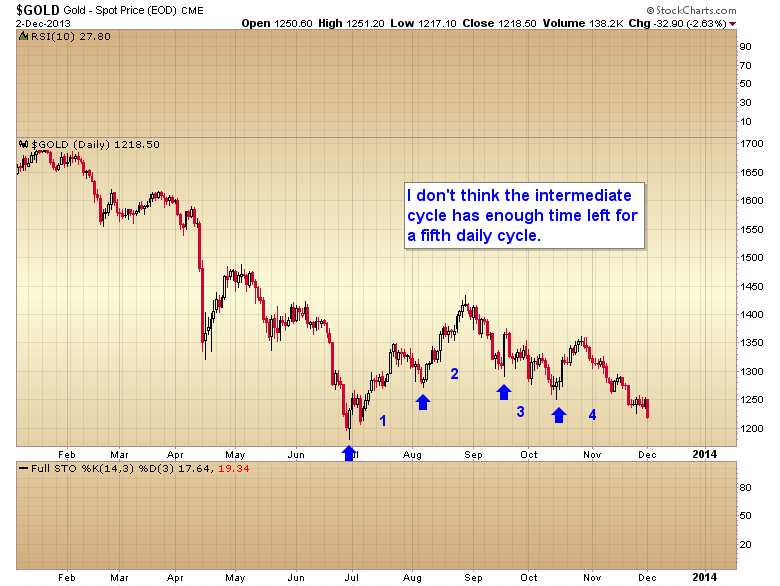
On a smaller time frame you can see the current intermediate cycle already has four daily cycles nested within it. I don't believe there is time for a fifth daily cycle, and a fifth daily cycle would be required if gold were going to make it all the way down to $1000.

On top of that the current daily cycle is now stretched to 34 days which is already longer than 90% of historical cycles. What this means is that gold is very late in its daily cycle and a bottom is due at any time. The logical trigger would be on the employment report Friday, although I think the market will be expecting that so we may get a bottom earlier in the week.

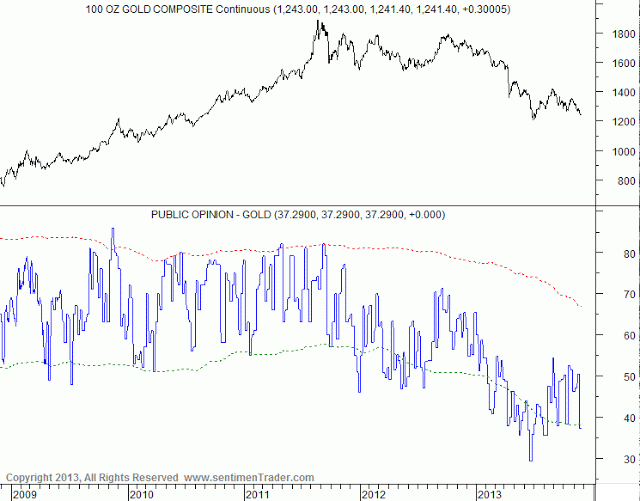
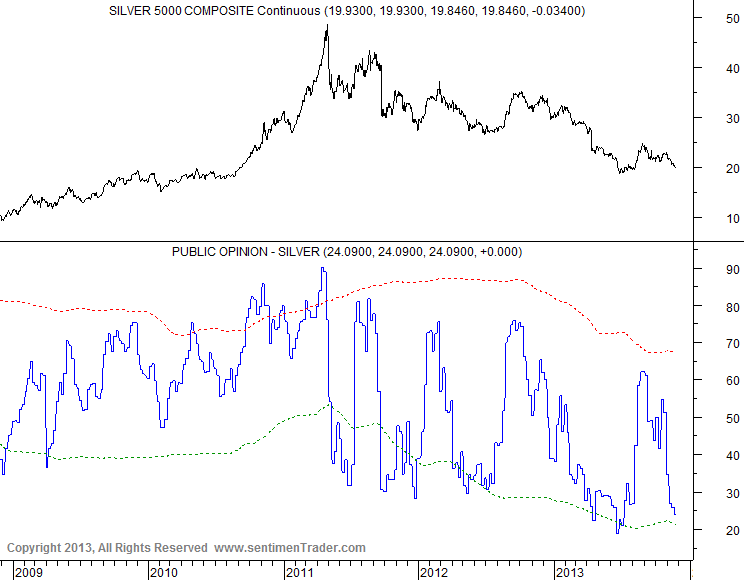
Last week's sentiment polls are also suggesting that bearish sentiment has reached levels where the market is at risk of running out of sellers. I expect when the current weekly sentiment poll comes out later this evening we will see sentiment in both gold and silver at levels comparable to the June bottom.

Source: sentimentrader.com

To top it all off I'm starting to hear some of the usual clichés that always appear at major turning points.

"The charts are pointing down"

Folks, at bottoms the charts will always say the market is going lower. And at tops the charts will always say the market is going higher.

Then there are the numerous calls for completely unrealistic targets. I'm now starting to hear $700 price targets for gold.

I believe we are within days of a final bottom in this intermediate cycle. I think an initial 10-20% position can be taken anytime this week. Then once we get confirmation of an intermediate bottom one can start adding to that position.

I'll say it again, if one can pick, or even get close to, buying at a bear market bottom the initial move out of those bottoms are where the biggest gains in this business are made. The first two months out of the 2008 bear market bottom miners rallied 100%. I don't think it's unreasonable to expect something similar this time as this bear market has been every bit as severe as the one in 2008.

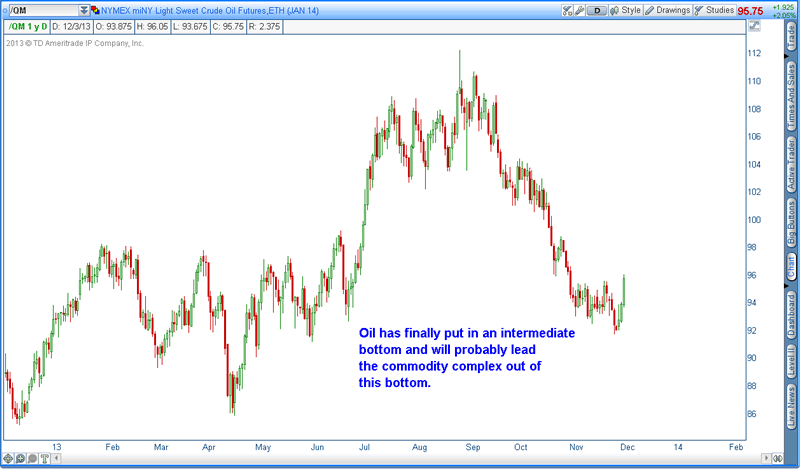
And one final confirmation before I forget. Oil appears to have put in a final intermediate bottom. Look for oil to lead the commodity complex out of this bottom.

See the original article >>

The Evolution of the Holiday Effect in VIX Futures

by Bill Luby

[The following originally appeared in the November 2012 edition of Expiring Monthly: The Option Traders Journal. I thought the contents might be timely in light of the upcoming holiday season.]

With fewer trading days and a historical record that favors an uptick in stocks and a downtick in volatility, the end of the year never fails to present an intriguing set of trading opportunities.

One phenomenon related to the above is something I have labeled the “holiday effect,” which is the tendency of the CBOE Volatility Index (VIX) December futures to trade at a discount to the midpoint of the VIX November and January futures.

This article provides some historical analysis of the holiday effect and analyzes how the holiday effect has been manifest and evolved over the course of the past few years.

Background and Context on the Holiday Effect on the VIX Index

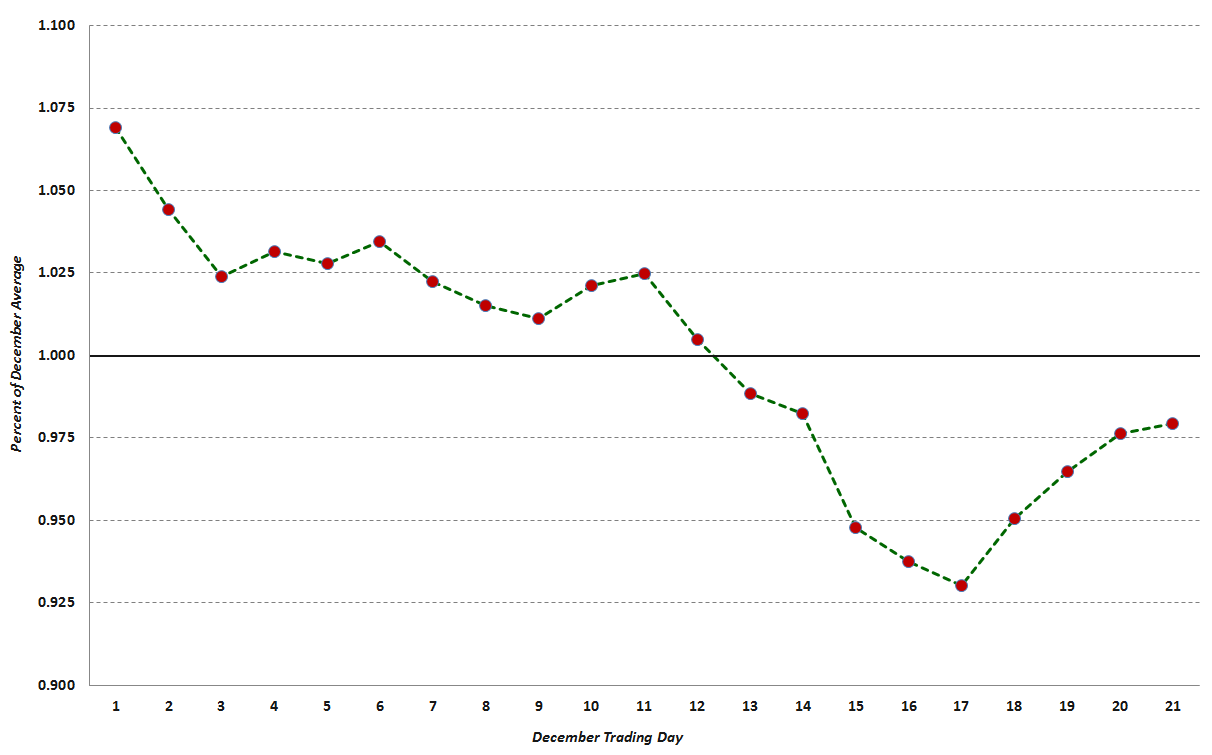
Part of the explanation for the holiday effect is embedded in the historical record. For instance, in eight of the last twenty years, the VIX index has made its annual low during the month of December. In fact, the VIX has demonstrated a marked tendency to decline steadily for the first 17 trading days of the month, as shown below in Figure 1, which uses normalized VIX December data to compare all VIX values for each trading day dating back to 1990. Not surprisingly, those 17 trading days neatly coincide with the typical number of December trading days in advance of the Christmas holiday.

{Figure 1: The Composite December VIX Index, 1990-2011 (source: CBOE Futures Exchange, VIX and More)}

Readers should also note that, on average, the steepest decline in the VIX usually occurs from the middle of the month right up to the Christmas holiday.

The December VIX Futures Angle

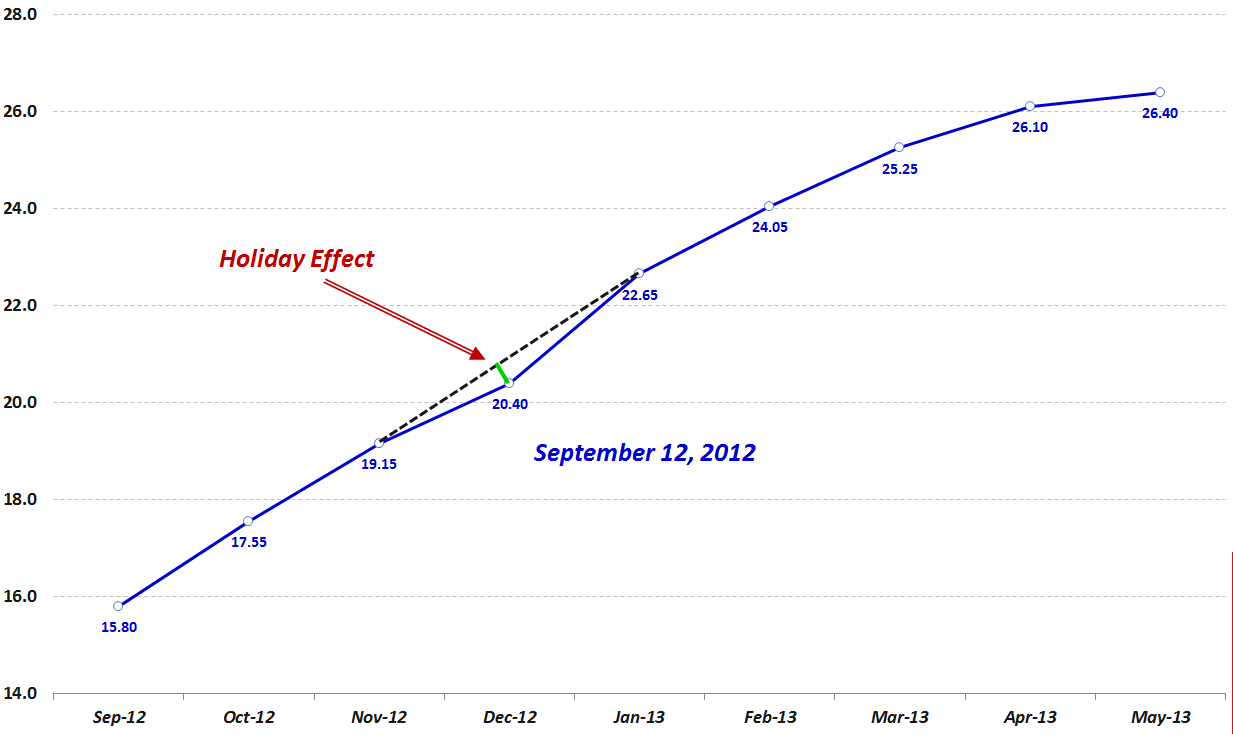
Most VIX traders are aware of the tendency of implied volatility in general and the VIX in particular to decline in December. As a result, since the launch of VIX futures in 2004, there has usually been a noticeable dip in the VIX futures term structure curve for the month of December. Figure 2 below is a snapshot of the VIX futures curve from September 12, 2012. Here I have added a dotted black line to show what a linear interpolation of the December VIX futures would look like, with the green line showing the 0.50 point differential between the actual December VIX futures settlement value of 20.40 on that date and the 20.90 interpolated value, which is derived from the November and January VIX futures contracts. (Apart from the distortions present in the December VIX futures, a linear interpolation utilizing the first and third month VIX futures normally provides an excellent estimate of the value of the second month VIX futures.)

{Figure 2: VIX Futures Curve from September 12, 2012 Showing Holiday Effect (source: CBOE Futures Exchange, VIX and More)}

Looking at the full record of historical data, the mean holiday effect for all days in which the November, December and January futures traded is 1.87%, which means that the December VIX futures have been, on average, 1.87% lower than the value predicted by a linear interpolation of the November and January VIX futures. Further analysis reveals that on 91% of all trading days, the December VIX futures are lower than their November-January interpolated value. The holiday effect, therefore, is persistent and substantial.

The History of the Holiday Effect in the December VIX Futures

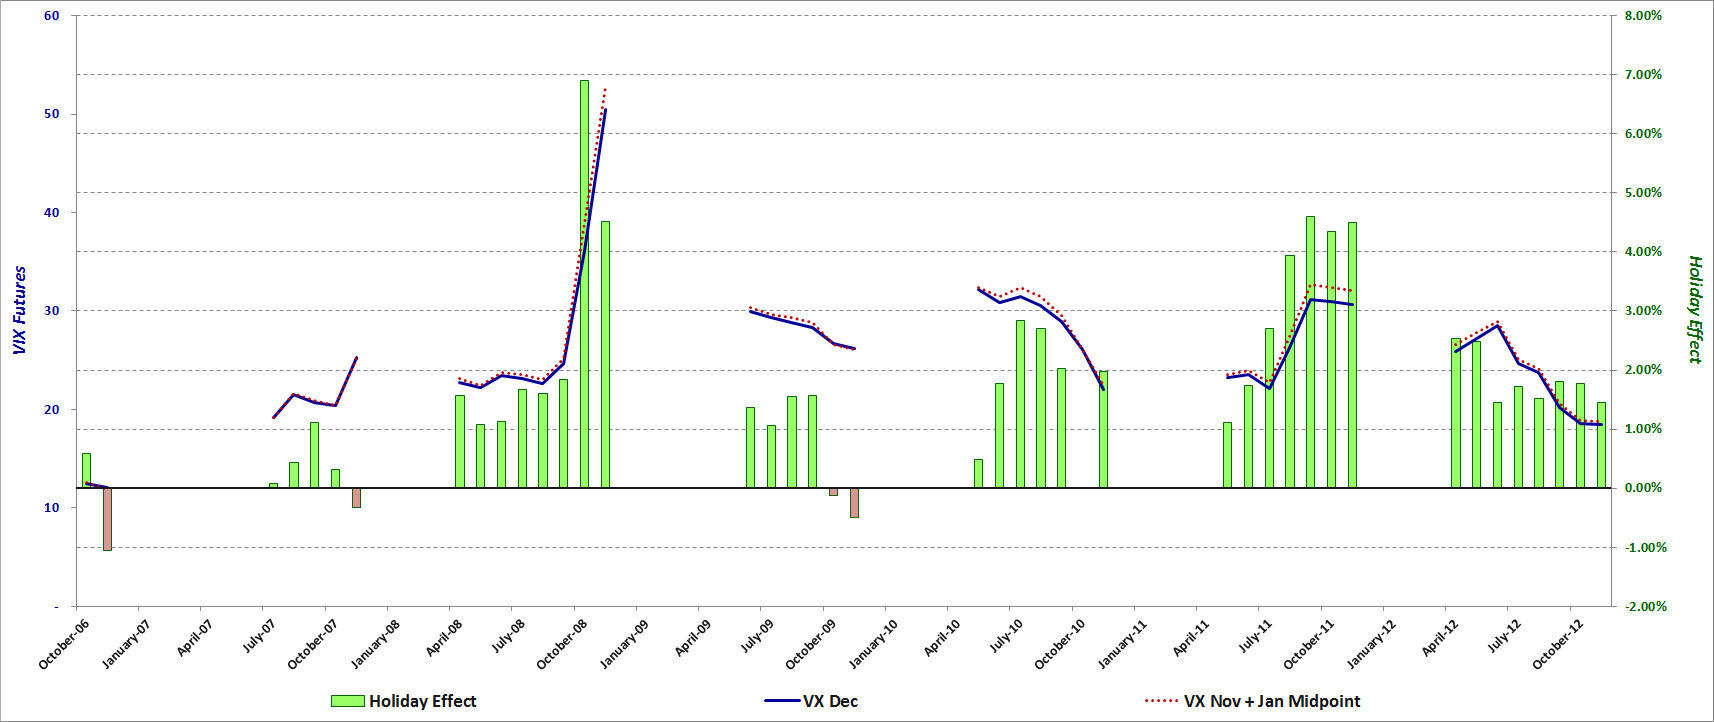
Determining whether the holiday effect is statistically significant is a more daunting task, as there are only six holiday seasons from which one can derive meaningful VIX futures data. Figure 3 shows the monthly average VIX December futures (solid blue line) as well as the midpoint of the November and the January VIX futures (dotted red line) for each month since the VIX futures consecutive contracts were launched in October 2006. Here the green bars represent the magnitude of the holiday effect expressed in percentage terms, with the sign inverted (i.e., a +2% holiday effect means that the VIX December futures would be 2% below the interpolated value derived from November and January futures.)

{Figure 3: VIX December Futures Holiday Effect, 2006-2012 (source: CBOE Futures Exchange, VIX and More)}

Conclusions

With limited data from which to draw conclusions, it is tempting to eyeball the data and look for emerging patterns which may repeat in the future. Clearly one pattern is that an elevated or rising VIX appears to coincide with a larger magnitude holiday effect, whereas a depressed or falling VIX is consistent with a smaller holiday effect. The data is much less compelling when one tries to determine whether the time remaining until the holiday season has an influence on the magnitude of the holiday effect. While one might expect the holiday effect to become magnified later in the season, the evidence to support this hypothesis is scant at this stage.

To sum up, investors have readily accepted that a lower VIX is warranted for December and the downward blip in December for the VIX futures term structure reflects this thinking. As far as whether this seasonal anomaly is tradable, there is still a limited amount of data – not to mention some highly unusual volatility years – from which to develop and back test a robust VIX futures strategy designed to capture the holiday effect.

In terms of trading the holiday effect for the remainder of the year, the coming holiday season is also complicated by matters such as the fiscal cliff deadline and various euro zone milestones that are set for early 2013. In fact, there may not be a reasonable equivalent since the Y2K fears in late 1999 that turned out to be a volatility non-event when the calendar flipped to 2000.

While the opportunities to capitalize on the 2012 holiday effect may be difficult to pinpoint and fleeting, all investors should be attuned to seasonal volatility cycles as 2013 unfolds and volatility expectations ebb and flow with the news cycle as well as the calendar.

See the original article >>

Is the Fed Increasingly Monetizing U.S.Government Debt?

By: Axel_Merk

Fed Chair Bernanke vehemently denies Fed “monetizes the debt,” but our research shows the Fed may be increasingly doing so. We explain why and what the implications may be for the dollar, gold and currencies.

What is debt monetization? A central bank is said to monetize a government’s debt if it helps to finance its deficit. The buying of Treasuries by the Federal Reserve is a clear indication that the Fed is doing just that, except that Bernanke argues the motivation behind Treasury purchases is to help the economy, not the government.

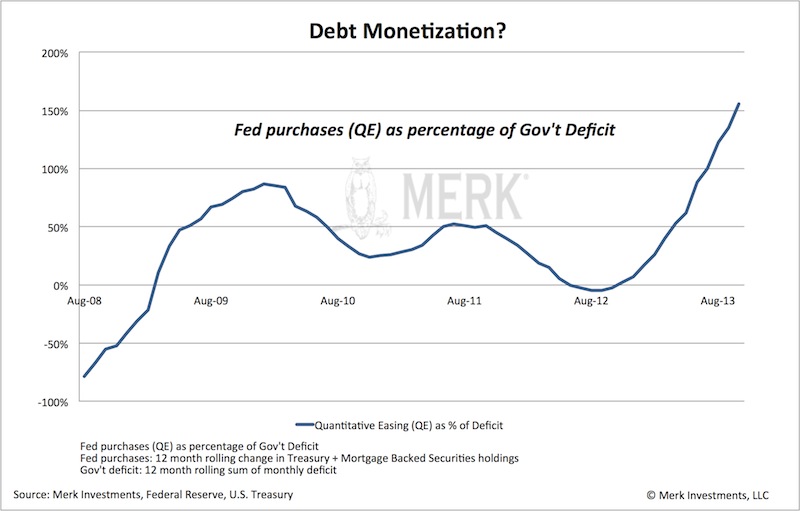
To what extent does the Fed monetize the debt? The above chart shows that since the onset of the fall of 2008, the Fed has purchased enough Treasuries and Mortgage-Backed Securities (MBS), together, “quantitative easing” or (QE) to finance a substantial part of the government deficit. Indeed, by deciding not to “taper” off its purchases, the Fed is engaging in sufficient QE to purchase all debt issued and then some.

Shouldn’t one exclude MBS purchases in analyzing debt monetization? Buying MBS may provide the appearance that the Fed is not monetizing the debt when in fact it is. Don’t take our word for it, but the market’s: in a recent presentation to the CFA society in Melbourne, Merk Senior Economic Adviser and former St. Louis Fed President Bill Poole points out that the spread between 30-year fixed-rate mortgages and 10-year U.S. Treasury bonds have been virtually unchanged as a result of MBS purchases; from 1976 to 2006 the average spread was 1.74%. From May 2011 to April 2012 it averaged 1.76%. As such, the direct impact of QE on spreads has been extremely limited. If it sounds surprising, consider that investors have an array of choices that are highly similar: aside from currency risk, how different are German Treasuries versus U.S. Treasuries? Highly rated U.S. corporate issues versus U.S. Treasuries? They all have distinct risk profiles, but there’s a good reason why absent of issuer-specific news, these securities tend to trade in tandem. As such, the Fed is really just sipping with a straw from the ocean: setting rates may be more a result of communication (the “credibility of the Fed”) rather than the actual purchases.

If rates are set by words rather than action, doesn’t that prove the point the Fed is not monetizing the debt? We agree that talk is cheap. But talk doesn’t always move the market; as confidence in the Fed’s ability to control rates erodes, policy becomes ever more expensive: cutting rates, emergency rate cuts, Treasury purchases, Operation Twist, and moving to an explicit employment target are all escalations of a policy to “convince” the market to keep rates low. And along the way, the Fed has to spend more money. Ask the Fed, and they’ll tell you their operations are profitable. Clearly, as the Fed creates money out of thin air to buy income-generating fixed income securities, the more the Fed “prints”, the more profitable it is. Except that there’s no free lunch and pigs still can’t fly. By all means, no central bank in their right mind would start out with a policy to monetize debt. But as the chart above shows, the Fed now spends over 150% of government deficit to hold rates down, suggesting that its firing power is eroding. If and when we come to the stage that the Fed were to explicitly monetize the debt, it may need to buy a high multiple of what it currently does and might still fail to keep rates low. It’s a confidence game.

What happened when the Fed decided not to “taper” its bond purchase program? As the chart above shows, something went wrong, very wrong. As tax revenue has picked up throughout the year, government deficits have come down. As such, reducing QE would have been warranted. By choosing not to “taper,” one can argue that QE has actually increased, as the Fed is buying above and beyond newly issued debt. Note the Fed will push back yet again, arguing it cannot buy debt directly from the government only in the secondary market. But that may well be semantics. As a large bond manager has pointed out: in the absence of QE, we might have to sell debt to one another, rather than to the Fed.

Where’s debt monetization heading? The way we see the dynamics playing out, this confidence game will go on for some time, yet we may increasingly be seeing cracks. Lower government deficits may be a short-term phenomenon as over the long-term the cost of entitlements and interest payments may rise substantially, highlighting that deficits may not be sustainable. In 10 years from now, the Congressional Budget Office (CBO) estimates the U.S. government may be paying $600 billion more a year in interest expense alone; indeed, if the average cost of borrowing went back up to the average cost of borrowing since the 1970s, the government may need to pay $1 trillion more per year in interest expense alone. To us, this suggests the biggest threat we are facing may be economic growth. That’s because the bond market has been most sensitive to good economic data; yet, should the bond market sell off (increasing the cost of borrowing), the cost of financing U.S. government deficits may escalate. We already have a Fed that has indicated interest rates will stay low for an extended period. In some ways, the Fed has all but guaranteed that it will be slow in raising rates. We interpret that as the Fed being slow to rising inflationary pressures that are likely to increase should the economy ever pick up again.

This is all too abstract – how will this play out? If you think this is abstract, think Japan. Let the Japanese be successful with their policies, let them achieve sustained economic growth. What do you think will happen to Japanese Government Bonds (JGBs)? JGBs might plunge, making it difficult, if not impossible, to finance Japan’s massive government debt burden. Few observers doubt that the Bank of Japan (BoJ) may step in to help finance government deficits. That’s debt monetization. We think the valve for Japan will be the yen that won’t survive this. When we discuss this with investors, most agree that this is a real risk for Japan. But don’t kid yourself: even if we may be able to kick the can down the road for longer in the U.S., we think it may be hazardous to one’s wealth to ignore the risks posed to the dollar due to a toxic mix of monetary and fiscal policy.

How do I prepare as an investor? The way we look at the world is in terms of scenarios: if a scenario is sufficiently likely, we think investors should take it into account in their portfolio allocation; professional investors may even have it as their fiduciary duty. To us, the short answer is that there is no such thing anymore as a risk free investment and investors may want to take a diversified approach to something as mundane as cash. Investors may want to consider throwing out the risk free component in their asset allocation. That’s because the purchasing power of the U.S. dollar may be at risk.

Is gold the answer? Gold has performed rather poorly this year and is increasingly being written off. Yet, those writing off gold should think twice about where they see the economy and the Fed heading. If one believes we will return to a “normal” environment and we’ll live happily ever after, maybe those gold naysayers have a point. But keep in mind that incoming Fed Chair Janet Yellen stated during her confirmation hearings that we shall return to a normal Fed policy once the economy is back to normal. To us, that’s an oxymoron: we cannot return to a normal economy when the Fed prevents risk being priced by market forces. To us, gold is more than “insurance” to adverse scenarios as some say, as we find it difficult to see how we’ll be facing positive real interest rates for an extended period over the coming decade.

Is a basket of currencies the answer? The Chinese government diversifies its reserves to a basket of currencies, clearly adding currency risk to their portfolio. Conversely, U.S. investors may want to consider diversifying to a basket of currencies if they believe we ultimately have the better “printing press” than the rest of the world?

But isn’t it more complex than that? In some ways, yes. Governments won’t give up without a fight. We believe policy makers want to do the right thing, except that the road to hell might be paved with good intentions. Just consider if Japan truly has a problem: Japan is no Cyprus, meaning that shockwaves of a Japanese government in turmoil might be felt around the world. Aside from cash not being “safe,” political stability may also continue to erode throughout the world, as citizens worldwide dissatisfied that their wages don’t keep up with an increasing cost of living elect ever more populist politicians. The only good news we can see is that our policy makers may be predictable and an investment strategy based on staying a step ahead of policy makers might be worth considering. Think currency wars, and think diversifying on a more pro-active basis. We are not suggesting investors become day traders, but we think the currency markets may be well suited to take positions on how one believes these dynamics may play out.

See the original article >>

Stock Market Sell Signals Abound

By: Anthony_Cherniawski

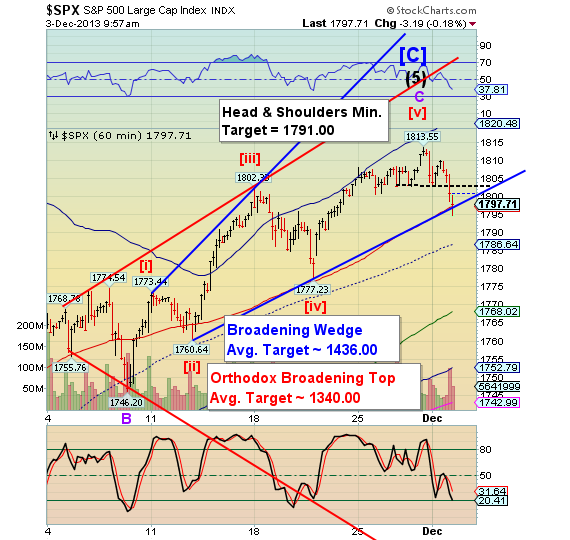
The NYSE Hi-Lo index went negative this morning and exceeded its two prior lows. This confirms the sell signal in SPX.

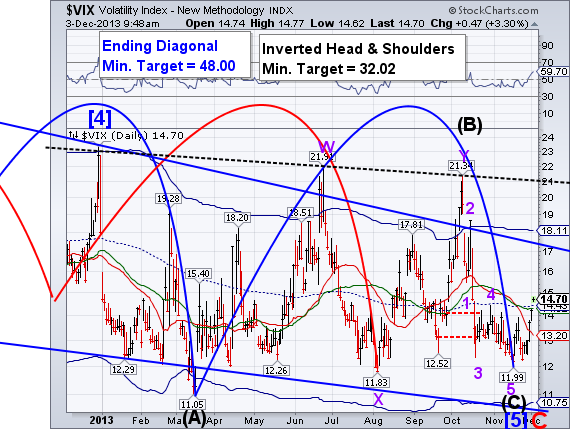
The VIX also confirmed its buy signal and inversely, confirmed the SPX sell signal as well. We may see an extended, super-sized minute Wave [iii] that could push it to its Cycle Top at 18.11 and send it on its way back to its inverted Head & Shoulders neckline at 24.00. The small Head & Shoulders pattern that was triggered yesterday (not shown) has a minimum target of 15.89.

SPX is back-testing its Broadening Wedge trendline. We could see further a bounce back to the Head & Shoulders neckline at 1802.76 before resuming its decline. That may be an indication of a more complex and possibly stronger decline.

1802.00 would be an excellent area to max out on the short side.

More to come later.

Regards,

Tony

See the original article >>

Bernanke/Yellen To Drive Stocks 30% Higher

by Lance Roberts

That's right, despite all of the recent "bubble talk," it is entirely possible that stocks could rise 30% higher from here.  However, it is not because valuations are cheap because as I discussed in my recent analysis of Q3 earnings stocks are trading near 19x trailing earnings.

"Understanding this it is easy to understand the flaw in using "forward" estimates as a valuation tool.  The use of forward, operating estimates, is only beneficial to Wall Street analysts who need to create a "valuation" story when none really exists.  Overly optimistic assumptions about the future spurs faulty analysis in the present as sliding earnings leads to sharp valuation increases. The chart below shows the progression of forward P/E estimates since the beginning of 2012.  Currently, with the S&P 500 valued at 18.89x reported earnings, it is hard to justify that the market is undervalued."

The primary reason that stocks are likely to climb 30% higher from current levels, over the next 24-months, is because that is what happens during the "mania" phase of a bull market cycle.  This is something that Richard Russell recently defined as:

"The third or speculative phase of a bull market is characterized by a wild and wooly and ever-increasing entrance by the retail public. This phase is characterized by hot tips, hype and pure greed."

As I stated previously it is probably too early to say that we are deep within "bubble" territory because simply too many people are talking about.  It is reminiscent of Alan Greenspan in 1996 uttering the words "irrational exuberance."  The fear of irrational exuberance was eventually quelled by a belief that "this time was indeed different" due to the "new era" of technology.  Ever higher levels of valuations were justified through "forward earnings expectations" and modified "valuation analysis" that, as always throughout history, ultimately failed to materialize.

Currently, individual investors are once again piling into equities under the belief, once again, that this time is different.  In 1999, it was the "tech boom,"  followed in 2007 by the "real estate/credit boom."  Today, it is the inherent belief that the "Fed's accommodative policy"  trumps all other issues.   "Don't Fight The Fed" has become the retail investor's call to arms as shown by the chart of money flows into retail equity mutual funds by ICI.  (Note:  Only the first two weeks of November are included which are already as great as the full month of October)

ICI-NetEquity-Inflows-112113

The support provided by the Federal Reserve has given investors a false sense of complacency regarding the risks of chasing yield in the financial markets.  However, that has always been the hallmark of the late stages of bull market cycles.

"The Beatings Will Continue Until Morale Improves"

Ben Bernanke has been very clear in his communications that the Federal Reserve will continue with its "ultra-accommodative monetary policies" until there are significant signs of improvement in the economic data.  One of his key phrases has been:

“When, ultimately, asset purchases do slow, it will likely be because the economy has progressed sufficiently for the Committee to rely more heavily on its rate policies,”

The term "ultimately" is the key phrase in this regard as it implies that there current stance could remain in place for quite some time to come.  This is especially the case when you consider that the Fed's biggest fear is actually getting worse; deflation.

"The [inflation] index is clearly warning of rising deflationary pressures in the economy, which has recently been seen in many of the manufacturing reports that have shown downward pricing pressures both on prices paid and received, there is no 'exit' currently for the Federal Reserve to reduce its monetary supports.  The real concern is that with the index at just 5.11%, which is well below the long term average of 11.62%, that the economy is far to weak to handle much of an exogenous shock.

The risk, as discussed recently with relation to Japan, is that the Fed is now caught within a 'liquidity trap.'  The Fed cannot effectively withdraw from monetary interventions and raise interest rates to more productive levels without pushing the economy back into a recession. The overriding deflationary drag on the economy is forcing the Federal Reserve to remain ultra-accommodative to support the current level of economic activity. What is interesting is that mainstream economists and analysts keep predicting stronger levels of economic growth while all economic indications are indicating just the opposite.

Despite the Fed's recent communications that they are planning to "taper" the current monetary program by the end of this year - the index is suggesting that their interventions, in one form or another, are unlikely to end anytime soon as the threat of 'deflation' remains the Fed's primary concern."

High-Inflation-Index-112013

Of course, it is not just Bernanke that maintains this stance but also his replacement Janet Yellen who has already indicated that she very much supports, and will maintain, Bernanke's current monetary policy regime.  As I stated recently in "Yellen Promises More," the lack of "economic success" will likely mean that the Fed remains engaged in its ongoing QE programs for much longer than currently expected.  The real surprise in 2014 could very well be an increase in size and scope of the current quantitative easing programs if interest rates remain elevated, deflationary pressures continue to increase and economic growth stalls. The injection of more liquidity could very well drive asset prices to the irrational extremes of a true market bubble.  However, if that occurs, the majority of market analysts and economists will not be talking about a "bubble" in asset prices but why "this time is truly different."

Jeremy Grantham of GMO, via ZeroHedge, more eloquently discussed this idea:

"My personal guess is that the U.S. market, especially the non-blue chips, will work its way higher, perhaps by 20% to 30% in the next year or, more likely, two years, with the rest of the world including emerging market equities covering even more ground in at least a partial catch-up. And then we will have the third in the series of serious market busts since 1999 and presumably Greenspan, Bernanke, Yellen, et al. will rest happy, for surely they must expect something like this outcome given their experience. And we the people, of course, will get what we deserve. We acclaimed the original perpetrator of this ill-fated plan – Greenspan – to be the great Maestro, in a general orgy of boot licking. His faithful acolyte, Bernanke, was reappointed by a democratic president and generally lauded for doing (I admit) a perfectly serviceable job of rallying the troops in a crash that absolutely would not have occurred without the dangerous experiments in deregulation and no regulation (of the subprime instruments, for example) of his and his predecessor’s policy. At this rate, one day we will praise Yellen (or a similar successor) for helping out adequately in the wreckage of the next utterly unnecessary financial and asset class failure. Deregulation was eventually a disappointment even to Greenspan, shocked at the bad behavior of financial leaders who, incomprehensibly to him, were not even attempting to maximize long-term risk-adjusted profits. Indeed, instead of the 'price discovery' so central to modern economic theory we had 'greed discovery.'"

The following chart, which I have used many times in the past, supports this idea of a continued liquidity driven market melt-up.  It is simply an extrapolation of the correlation between the S&P 500 index and the Federal Reserve's balance sheet.

Fed-Balance-Sheet-VS-SP500-112013

At the current rate of balance sheet expansion, and assuming that correlations remain, the markets could well rise to 2329 by the end of 2015.  This would also mean the Fed's balance sheet would have also expanded beyond $6 Trillion.  This would likely imply that the Fed would own more than 50% of the treasury market.

The problem with this analysis is that it assumes that everything else remains status quo.  The reality is that some exogenous shock will come along that causes a more severe reversion in the markets as current extensions become more extreme.   As Grantham noted:

"What can go wrong for the market? There is a slow and for me rather sinister slowing down of economic growth, most obviously in Europe but also globally, that could at worst overwhelm even the Fed. The general lack of fiscal stimulus globally and the almost precipitous decline in the U.S. Federal deficit in particular do not help."

See the original article >>

Engulfing bearish patterns in Europe…Will it spill over to the States?

by Chris Kimble

CLICK ON CHART TO ENLARGE

The above 3-pack looks at long-term patterns in France, London and Germany. Each chart reflects attempted breakouts is at hand, for these major markets.

The gray boxes take a very short-term snap shot of each market at the resistance and the red oval highlights "engulfing bearish patterns" in these key markets.

What goes up in a down market?  Correlation!!!

The Power of the Pattern reflected that the majority of the key worlds index were all "attempting breakouts at the same time!" (see post here)

If the worlds markets don't succeed breaking out at the same time, could the majority of the turn weak at the same time since correlation is so high?  Stay tuned...

See the original article >>

Oil drama flares after Ukraine protests

By Phil Flynn

While everyone thought all the drama in the oil market (NYMEX:CLF14) would be coming from OPEC, it seems that it is coming from Ukraine that is moving markets. As the President of Ukraine faces protest as he snubs the EU in favor of Russia, it seems that Russia is diverting some supply to try to add to the tensions. The Orange Revolution is turning to Russian red as protestors who don't take kindly to Russia take to the streets as Russia plays hard ball using its energy resources to try to coerce former Soviet territories into joining their union. It's the EU versus Russia as Vladimir Putin tries to reassert control over former Soviet territory.

The Voice of America reported that the European Union on Friday criticized Russia for pressuring Ukraine into abandoning a landmark free trade deal with the European bloc. The snub by Ukrainian President Viktor Yanukovych, announced last week, reverberated through an EU summit in the Lithuanian capital, Vilnius, where German Chancellor Angela Merkel was captured Friday on video telling the Ukrainian, "We expected more." Mr. Yanukovych responded, telling the German leader, "The economic situation in Ukraine is very hard. And we have big difficulties with Moscow." The summit, which ended Friday, was expected to showcase the signing of the agreement. But as last minute negotiations failed, thousands of opposition protesters in Kyiv gathered for a second time this week in the center of the city to demand the president's resignation.

Yet now he is having second thoughts, but it may be too late. The Wall Street Journal reported that "President Viktor Yanukovych, facing the biggest political crisis in Ukraine in nearly a decade, reached out to the European Union on Monday in an apparent attempt to placate thousands of pro-Western demonstrators angry over his pivot toward Russia. But the EU's executive reacted coolly to the request for new talks, telling Mr. Yanukovych that the sweeping trade deal he refused to sign last week after six years of talks wasn't open for renegotiation—and warning him against using force to disperse the crowds barricaded on Kiev's main square."

Oil was ignoring the Ukraine turmoil until Reuters reported that Russian Urals crude reversed to a premium from a discount to benchmark Brent after Russia diverted some oil from export destinations to neighboring Belarus. Reuters reported that said Russian oil companies Lukoil and Rosneft have cancelled loadings of two Urals cargoes on Dec. 13-14 and 14-15 from the Baltic ports of Primorsk and Ust-Luga. Reuters says that the exports of Urals had been expected to drop in December after Russia approved a boost in deliveries to Belarus by as much as 750,000 tons after tensions eased in a separate dispute between the two neighbors over potash prices.

It seems if you play ball with Russia you get the supply that you need. If not then they will put the squeeze on you. The diversion of that supply means less oil for other countries, which gave Brent crude a boost. At the same time Russia was trying to send a message to the protesting masses that life will be easier if they decide to play ball. Yet the Ukrainian people value their independence and still have memoires of the dark days of Soviet domination. They also remember in 2004 during the Orange Revolution when the Russians tried to rig an election and poison Viktor Andriyovych Yushchenko.

Russia is also threatening Yugoslavia to cut off gas supply unless they pay a hefty amount for the gas or sign up for this new Russian trade union. Yet for OPEC at least in the Eyes of Ali Naimi Saudi Oil minister the world is just a beautiful place. Oil glut? What oil glut? The Saudi Oil minister says that demand for oil was "great," that global economic growth was improving and, indeed, that the market was in the best possible situation. He is not worried about more oil from Iran because that is a what-if scenario. The oil minister has continued to downplay the impact of surging U.S. production, which has caused some rare criticism of the OPEC leader.

Yet Naimi says that "I am not pessimistic about the market. The market is doing well for the past two years. Inventories are right-positioned. The market is in the best situation it can be. Demand is great, economic growth is improving, why do you want to be so pessimistic? "Why cut production? Demand is there," he said. "I want you to go with one message. Be an optimist. There is good economic growth, there is good demand, the market is big, and everybody is going to supply what they can to satisfy the demand." As far as Iranian oil a point of contention he says "'If,' 'if,' 'if.' Stay away from if. I want whatever he is having!

Dow reports Turkey said on Monday that it stands by a bilateral oil deal with Iraq's Kurdistan region that bypassed central government but sought to appease Baghdad by drawing it into the arrangement.

See the original article >>

Orange juice drops as markets fend off cold weather

By Jack Scoville

FCOJ (NYBOT:OJF14)

General Comments: Futures closed lower as the weather in Florida remains generally very good. There is usually some speculative buying that appears at this time and as soon as the cold air starts to filter in from Canada, and cold air is coming again at the end of the week. Current above normal readings in northern areas will be replaced by much below temperatures this weekend. No one is predicting any freezing temperatures for Florida. Traders are expecting USDA to lower production even more in coming production reports. The greening disease has affected crops in a big way and could cause reduced production for the next few years. Growing and harvest conditions in the state of Florida remain mostly good. It has turned drier, which is seasonal, and reports indicate that crops are in good condition. Irrigation water is available. Harvest is increasing. Brazil is seeing near to above normal temperatures and showers.

Overnight News: Florida weather forecasts call for mostly dry conditions. Temperatures will average above normal.

Chart Trends: Trends in FCOJ are mixed. Support is at 137.00, 135.00, and 131.00 January, with resistance at 141.00, 143.00, and 145.50 January.

COTTON (NYBOT:CTH14)

General Comments: Futures closed lower. Prices remain in a trading range, and it seems like the market wants some demand news. Prices are still getting support from the storm that hit the production areas last week. Quality has suffered with the storm, and there is potential for some yield loss as well. There are questions about demand in China as the government there has offered its supplies into the domestic market. It sold half of its offer at the auction last week and will most likely offer more soon. Wire reports indicate that some production has been lost in China after recent bad weather in some growing areas. Brazil conditions are reported to be very good in Bahia. Harvest continues this week in the US, but should get interrupted again late in the week when the cold and snow and rain arrives.

Overnight News: The Delta and Southeast should see dry weather through the middle of the week, then some showers and snow late in the week. Temperatures will average near to above normal early in the week, then near to below normal. Texas will see dry conditions early in the week and rain and snow at the end of the week. Temperatures will average above normal early in the week, then below normal. The USDA spot price is 74.94 ct/lb. today. ICE said that certified Cotton stocks are now 0.237 million bales, from 0.237 million yesterday.

Chart Trends: Trends in Cotton are mixed. Support is at 78.00, 77.40, and 76.65 March, with resistance of 79.65, 80.50, and 80.95 March.

COFFEE (NYBOT:KCH14)

General Comments: Futures were higher in London, but lower in New York and Sao Paulo. London was higher on reports of light offers again from Vietnam due to recent rains and low prices. Ideas are that producers will have to start selling in the next month or so, but they are not selling now and futures are rallying as roasters and others look for supplies. The Arabica market is seeing only light offers as well and also saw some short covering, but buying interest for Arabica overall remains very limited. Brazil said last week it is considering new measure to support producers if needed. Brazil has a lot of Coffee to sell, but the market there remains quiet as producers wait for prices to rally above the cost of production. The rest of northern Latin America was quiet, but there is talk of a lot of Coffee there as well. Colombia has been more active, but sales have tailed off lately Central America is showing light offers as the harvest progresses under mostly good conditions. New York is trading in a range, but London continues moving higher in the short term.

Overnight News: Certified stocks are lower today and are about 2.675 million bags. The ICO composite price is now 103.62 ct/lb. Brazil will get scattered showers today and this weekend. Temperatures will average near to above normal. Colombia should get scattered showers, and Central America and Mexico should get mostly dry weather. Temperatures should average near to above normal.

Chart Trends: Trends in New York are mixed. Support is at 107.00, 105.50, and 104.00 March, and resistance is at 112.00, 115.00, and 117.00 March. Trends in London are mixed to up with objectives of 1690 and 1760 January. Support is at 1630, 1550, and 1520 January, and resistance is at 1675, 1695, and 1730 January. Trends in Sao Paulo are mixed. Support is at 132.00, 131.00, and 129.00 March, and resistance is at 136.50, 138.00, and 140.00 March.

SUGAR (NYBOT:SBH14)

General Comments: Futures were lower in both New York and London and made new lows for the move. Brazil said it plan is to introduce Corn ethanol produced locally in an effort to support Corn farmers in northern Brazil. The move would hurt Sugar ethanol demand. Petrobras left the market confused on prices for gasoline, and that depressed Ethanol there yesterday. All this coming on the heels of very high Sugarcane production in Brazil from a harvest that never seems to end. The market needs some demand news, but is not getting any. Chart trends remain generally down in New York and London. Countries like India and Thailand are selling as much as possible. Weather conditions in key production areas around the world are rated as mostly good. There is no news of losses to Sugar areas in Vietnam and China, but some losses are possible due to big rains a few weeks ago. India could see some losses from unseasonal cyclone activity in the northeast and east part of the country. Eastern growing areas have now seen three or four cyclones in the last couple of months. Weather in Brazil appears to be mostly good, with showers to support new crop development.

Overnight News: Brazil could see showers and near to above normal temperatures.

Chart Trends: Trends in New York are down with objectives of 1715 and 1680 March. Support is at 1715, 1695, and 1685 March, and resistance is at 1730, 1750, and 1765 March. Trends in London are mixed. Support is at 460.00, 458.00, and 452.00 March, and resistance is at 466.00, 467.00, and 469.00 March.

COCOA (NYBOT:CCH14)

General Comments: Futures closed higher, but held in the recent trading range in London. Support came from the increased deficit production forecast from the ICCO. New York was also mostly in the range, but posted a new high close. There were reports of increased selling from Ivory Coast last week, and supplies should be available. Ideas of very strong demand are supporting prices, and certified stocks keep dropping in New York. Reports indicate that rains are less this week in West Africa, which should help harvest progress and processing progress. Much of West Africa is now reporting reduced production due to stressful conditions earlier in the growing season, but this has yet to bear out in official data outside of Nigeria. The overall fundamental picture should support generally higher prices as the supply situation should be tight once the harvest selling is done. Midcrop production conditions are rated as good.

Overnight News: Scattered showers or dry conditions are expected in West Africa. Temperatures will average near to above normal. Malaysia and Indonesia should see scattered showers. Temperatures should average near to above normal. Brazil will get dry conditions and near normal temperatures. ICE certified stocks are unchanged today at 3.418 million bags.

Chart Trends: Trends in New York are up with objectives of 2880 and 2960 March. Support is at 2800, 2770, and 2755 March, with resistance at 2845, 2860, and 2890 March. Trends in London are mixed. Support is at 1730, 1710, and 1680 March, with resistance at 1775, 1790, and 1800 March.

See the original article >>

Chinese Yuan Surpasses Euro, Becomes Second Most Used Currency In Trade Finance

by Tyler Durden

Slowly but surely the Chinese currency is catching up to the world's reserve and moments ago, according to SWIFT, the Yuan just surpassed the Euro in trade (remember trade: that's how countries once upon a time would generate capital flows in a time when central banks weren't there to literally print domestic funding needs) finance usage leaving just the USD in front.

  • YUAN OVERTAKES EURO IN TRADE FINANCE USAGE: SWIFT
  • YUAN IS SECOND MOST-USED CURRENCY IN TRADE FINANCE: SWIFT

More from Bloomberg:

  • Chinese currency had 8.66% share in letters of credit and collections, or trade finance, in Oct., Society for Worldwide Interbank Financial Telecommunications says in statement today.
  • Euro’s shr in trade finance was 6.64% in Oct.
  • Top 5 countries using yuan for trade finance in Oct. were China, Hong Kong, Singapore, Germany and Australia
  • Yuan mkt shr in global payments was 0.84% in Oct. vs. 0.86% in Sept.
  • Yuan payments value rose 1.5% in Oct. vs. 4.6% growth for all currencies: Swift

And so while the "developed" world is busy crushing its fiat through trillions in annual currency dilution and debasement in an attempt to make its exports cheaper and outtrade its peers through beggar thy neighbor policies (not to mention inflate away its debt), the leader of the "emerging" world, China, is doing just that.

See the original article >>

QE Deflationary? No Kidding!

by Lance Roberts

There was a very "wonkish" article by Stephen Williamson over the weekend discussing the impact of quantitative easing on inflationary expectations.  The article is filled with economic equations discussing interest rates and inflationary expectations but the real crux of the article was:

"In general, if we think that inflation is being driven by the liquidity premium on government debt at the zero lower bound, then if the Fed keeps the interest rate on reserves where it is for an extended period of time, we should expect less inflation rather than more.
But that's not the way the Fed is thinking about the problem. What I hear coming out of the mouths of some Fed officials is that: (i) Things are bad in the labor market, and the Fed can do something about that; (ii) inflation is low. Thus, according to various Fed officials, the Fed can kill two birds with one stone, so it should: (a) keep doing QE; (ii) make it clear that it wants to keep the interest rate on reserves at 0.25% for a very long period of time.
What I hope the discussion above makes clear is that this is a trap for the Fed. There is not much that the Fed can do on its own about the short supply of liquid assets. They can get some action from QE, but the matter is mostly out of their hands, and more QE actually pushes the Fed further from its inflation goal. If the Fed actually wants more inflation, the nominal interest rate on reserves will have to go up. Of course, that will lead to some short-term negative effects because of money nonneutralities."

This is not "new news" for anyone that has either a) been paying attention or; b) reading my posts (see here, here and here) on the deflationary impact of the Fed's "QE" programs.  If we set the "math" aside for a moment, and focus on a consumption based economy, it becomes clear that stimulating asset markets will have little effect on economic or labor growth which is ultimately driven by end demand.

Take a look at the chart below of interest rates, GDP and inflation.

Fed-Funds-GDP-Inflation-120213

Since 1980 economic growth rates, inflationary pressures and interest rates have all been in a steady decline.  This has been due to increased productivity through technological advances which have suppressed wage growth and labor demand.  This pressure has become even more rampant since the financial crisis as corporations slash costs to increase profitability while topline revenue has remaind sluggish. During that time the illusion of economic strength have largely been the result of massive increases in debt to fill the gap between slowing rates of income growth and rising living standards.

Personal-Income-120213

While the Federal Reserve's programs have massively increased the excess reserve accounts of the member banks; those reserves have remained there.  This is shown in the chart below and is the result of weak demand for credit in the real economy.

Banks-ExcessReserves-M2V-120213

In order for there to be inflationary economic pressures there must be an increase in the demand for credit by businesses to increase production.  Increased production results in rising pressures on wages and commodity prices.  The chart below shows the real problem for the Fed.

High-Inflation-Index-120213

While the Federal Reserve has successfully inflated asset prices; the ongoing interventions have failed to translate from Wall Street to Main Street.  A large amount of labor slack has kept wages suppressed which has reduced aggregate end demand keeping pricing power under pressure.

The Federal Reserve's programs certainly assisted in offsetting the risk of the economy falling into a much deeper recession immediately following the financial crisis.  The current problem for the Federal Reserve is ceasing programs which are potentially inflating an asset bubble while the economic underpinnings remain to frail to function autonomously.

As Stephen concluded in his article:

"The Fed is stuck. It is committed to a future path for policy, and going back on that policy would require that people at the top absorb some new ideas, and maybe eat some crow. Not likely to happen. The observation of continued low, or falling, inflation will only confirm the Fed's belief that it is not doing enough, not committed to doing that for a long enough time, or not being convincing enough."

The sheer beauty in the Keynesian argument for ongoing monetary interventions is in its simplicity.  If the programs work; then the Keynesian model was correct.  If the economy fails, or worse, it is only because the Federal Reserve did not do enough.  With that kind of logic what could possibly go wrong?

See the original article >>

Argentine soybean crop to set a record - with ease

by Agrimoney.com

The Argentine soybean crop will set a record after all, boosted by late rains and relatively high prices of the oilseed, which have boosted its appeal over corn in farmers' planting plans.

Argentine growers will in 2013-14 harvest 57.5m tonnes of soybeans, the US Department of Agriculture bureau in Buenos Aires said – a figure 4.0m tonnes higher than the department is officially banking on.

A crop at that level would overtake the all-time harvest of 54.5m tonnes set in 2009-10.

The bureau's forecast is also above figures many other commentators are factoring in, with the International Grains Council last week nudging its number 500,000 tonnes higher to 55.0m tonnes, a figure in line with Oil World's estimate.

'Unanimous consent'

The bureau's forecast reflects an estimate for plantings of 20.5m hectares, some 800,000 hectares more than the USDA is factoring in.

"There is unanimous consent among the industry that area will be above 20m hectares - some contacts even maintain forecasts above 21m hectares," the bureau said.

The Buenos Aires grains exchange last week raised its forecast by 250,000 hectares to 20.45m hectares.

Extra soybean area is expected to come at the expense of corn, for which seedings were curtailed by dry weather last month, the ideal corn-sowing time in many areas.

Farmers who missed this window, "will either plant late season corn, which yields less, or plant soybeans", the bureau said.

Corn prices vs soybean prices

The allure of soybeans, for which sowings will continue into January, is being boosted by price incentives too.

"The issue this season is the fact that corn prices are dropping at a faster rate than soybean prices are dropping," the bureau said.

"This, along with higher costs of production for corn, makes corn a less profitable, more risky crop and it is likely many will switch to soybeans which have low input costs in comparison."

However, the extra soybeans will not boost much Argentina's exports of the oilseed itself in 2013-14, which the bureau pegged at 10.0m tonnes, some 440,000 tonnes more than the official USDA figure.

Argentina crushes most of its crop domestically, and is in fact, by a margin, the world's top exporter of soymeal and soyoil.

Argentina is the world's third-ranked soybean producer, behind the US and Brazil.

See the original article >>

China To Become the Fastest Growing Consumer Market in the World

It’s the season for shopping. We have Cyber Monday in the United States and Singles Day in China (November 11 or 11/11). So, while we are pondering shopping, try to guess which consumer market is growing the fastest. The answer is…China!

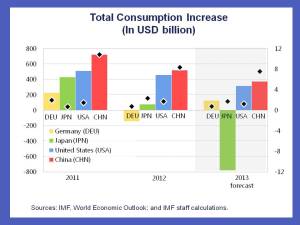
China had the largest consumption increase in the world. This was true in 2011, true in 2012, and likely to be true again this year (see chart). Consumption in China is also generally thought to be weak. Indeed, the government and the IMF are calling for more consumer-based growth. How could consumption, in effect, be both weak and strong at the same time?

Consumption is not weak…

China Fastest Growing Consumer Market in the WorldThe chart shows the US$ increase of consumption in China and other large economies. China has been tops for the past few years (see the bars). It has also had the fastest real growth in consumption (see the dots). The US$ increase (bars) is a combination of the pace of consumption growth, size of the economy, and exchange rate. For China, exchange rate appreciation also contributes to the large measured increase in US$, as well as the negative bar for Japan this year. So whether measured in US$ terms or real growth, among major economies, China’s consumer market is the fastest growing in the world.

It is also true that consumption as a share of GDP has been declining. It has fallen by some 10 percent of GDP over the past 10 years or so. However, a big reason for the decline is that GDP has been growing fast, even faster than consumption. This is just arithmetic. In real terms, however, consumption has grown about 9 percent a year for the past decade—a fantastic outcome! This just happens to be less than the 10 percent average growth in GDP.

Two factors are behind the declining share of consumption. First, household saving has been rising. The reasons are complex, and perhaps not fully understood, but pre-cautionary motives are a popular explanation. Households are uncertain about how much health, education, and pension the government will provide, so self-insure by increasing saving. Second, household income has been growing slower than GDP. Same story as above: Household income has been growing fast, but just not as fast as GDP. These factors are each discussed further in “Sino-Spending”.

Moving to consumer-based growth

Rebalancing toward more consumer-based growth means, in short, boosting the consumption to GDP ratio. Consumer-based growth, however, is a foreign concept to macroeconomists. We tend to look at growth from the supply-side of the economy: Capital (factories) and labor (workers) are combined with technology (total factor productivity) to produce output (GDP). The consumer-based growth story, however, can also be told from the supply-side of the economy.

Expanding the service sector is a critical step for achieving more consumer-based growth. The service sector, while growing, is smaller in China in terms of output and employment than comparator economies. As the service sector takes a larger and larger share of the economy, household income (and thus consumption) will naturally rise as a share of GDP.  Moreover, advances in the service sector could also lower the price for many consumer services and thereby increase sales (e.g., consumption) see IMF Working Paper.

Other reforms will also help. Strengthening the financial sector will help finance the expansion of the service sector, a part of the economy that currently has difficulty accessing credit. It will also boost household income directly, as new financial products boost investment income. Social security reform, meanwhile, could help reduce pre-cautionary saving. Moreover, payroll taxes are very high and regressive (employee plus employer social contributions often exceed 40 percent of wages). Reducing the contribution rates will help boost labor income directly through lower taxes and indirectly by boosting employment.

These are just some examples. In fact, many other reforms announced at the recent Third Plenum will also help lift the consumption ratio. Higher resource taxation, labor market reforms, and land reform could all help boost household income and lower household saving—either directly or indirectly by shifting the economy more toward services.

As reforms take hold, the end result should be a rise in the consumption to GDP ratio. It happens as a welcome by-product of moving to a more balanced and sustainable growth path, which also leads to a larger service sector, lower household saving rates, and a higher labor share of income. It also means a more inclusive (improved labor market) and environment-friendly (services are less polluting than industry) growth path.

And, since consumption will be growing faster than GDP, it will also be more consumer-based growth.

See the original article >>

By Steven Barnett

Amazon tests drones for same-day parcel delivery, Bezos says

By Bloomberg News

Source: BloombergSource: Bloomberg

Amazon.com Inc. is testing drones to deliver goods as the world’s largest e-commerce company works to improve efficiency and speed in getting products to consumers.

Chief Executive Officer Jeff Bezos unveiled the plan on CBS’s “60 Minutes” news program in the U.S., showing interviewer Charlie Rose the flying machines that can serve as delivery vehicles. Bezos said the gadgets, called octocopters, can carry as much as 5 pounds within a 10-mile radius of an Amazon fulfillment center. Amazon may start using the drones, which can make a delivery within 30 minutes, within five years pending Federal Aviation Administration approval, Bezos said.

“It will work, and it will happen, and it’s gonna be a lot of fun,” he said in the “60 Minutes” interview broadcast yesterday.

Amazon, based in Seattle, has been introducing ways to get products to consumers faster, seeking to keep shoppers coming back to its Web store instead of going to brick-and-mortar retailers. The company said last month it was teaming up with the U.S. Postal Service to begin Sunday delivery to members of its $79-a-year Prime program.

Delivery drones also are being used by the Australian company Zookal to deliver textbooks, said Oliver Lamb, director of Sydney-based Pacific Aviation Consulting. In China, the SF Express delivery company is experimenting with drones in the southern city of Dongguan, according to a report by the Civil Aviation Resource Net of China.

Regulatory Issues

“When and how to allow this kind of delivery is going to be a big question,” Lamb said. “Regulators will have to deal with this, and I’m sure each jurisdiction will come up with regulations to allow this in due course.”

Amazon’s drone plan spurred Senator Edward Markey, a Democrat from Massachusetts, to issue a statement today saying the machines should be vetted before they are used for delivery. Markey introduced the Drone Aircraft and Privacy Transparency Act last month, calling for measures to ensure drones aren’t used to spy on U.S. citizens.

“Before drones start delivering packages, we need the FAA to deliver privacy protections for the American public,” he said in the statement. “Convenience should never trump constitutional protections.”

New Uses

Experimentation with delivery by drones is part of a shift from the craft’s use by the U.S. military to spy on and kill suspected terrorists.

The U.S. Congress has directed the FAA to develop a plan to integrate drones into U.S. airspace by 2015. That led U.S. venture investors to pour $40.9 million into drone-related startups in the first nine months of this year, more than double the amount for all of 2012, according to data provided to Bloomberg News last month by PricewaterhouseCoopers and the National Venture Capital Association.

As Amazon and EBay Inc. step up their push to get customers goods as quickly as possible, United Parcel Service Inc. and FedEx Corp. are focusing on developing and testing strategies for a same-day delivery market. Their efforts build off the ground networks that are the last link in a global chain that includes planes and trucks. The companies haven’t discussed specific plans for using drones.

FedEx, UPS

Potential industrywide revenue from intracity delivery of small packages in the U.S. may be as much as $12 billion, FedEx has estimated. UPS, the world’s largest shipping company, had total revenue of $40.5 billion through the first nine months of this year, while sales at FedEx, operator of the biggest cargo airline, totaled $44.3 billion in its fiscal year ended May 31.

“We have made a name for ourselves in innovation and technology,” FedEx Senior Vice President Patrick Fitzgerald said today in a Bloomberg Television interview. “This is something we have a lot of focus on. As it stands today, there are no drones in the delivery network.”

Carla Boyd, a FedEx spokeswoman, declined to comment further about drones. UPS said the technology won’t be in use anytime soon.

“We certainly have had, in our technology steering committee, presentations from drone vendors,” UPS Chief Sales and Marketing Officer Alan Gershenhorn said in an interview today. “The commercial use of drones is certainly an interesting technology and we’ll evaluate it ongoing.”

Developments that would allow commercial use of small drones “are pretty far off,” he said.

Blue Origin

Drones aren’t the first futuristic technology to attract the interest of Bezos. Separate from Amazon, Bezos created a closely held spaceflight venture called Blue Origin, which in October said it planned to soon begin offering suborbital flights on a commercial basis.

The electric motors of the drones will help reduce the environmental impact of package deliveries, Bezos said.

“It’s very green,” Bezos said. “It’s better than driving trucks around.”

Still, the challenges to achieving a safe delivery at the end of the day may prove insurmountable, said Jeff Lowe, general manager of Asian Sky Group, a Hong Kong-based aviation consulting company.

“You’d have to make it idiot-proof,” Lowe said. “From a height, a 5-pound load hitting anything is going to be fairly destructive, so that can never happen. The first time it does, the FAA will ground all these drones and they will never fly again.”

Prime Customers

The research into delivery by drone is a reflection of the fact that some of Amazon’s most lucrative customers are members of its Prime program, which promises fast delivery.

The company invests heavily in distribution and delivery, which made up the largest portion of Amazon’s expenses in the third quarter. Investors have endorsed the spending on capacity -- the costs increased 35% to $2.03 billion -- pushing up the company’s shares 57% so far this year even as it posts losses.

The company had 89 warehouses in 2012 and is planning 7 more this year. Amazon also unveiled plans in July to increase staff by 5,000 in 17 centers this year and is hiring 70,000 seasonal workers in the U.S. to meet holiday order demand.

Bezos showed the drones as the growth of e-commerce sales outstrips total retail sales. On Black Friday, e-commerce spending increased 15% to a record $1.2 billion as more consumers opted to shop from their couches rather than battle long lines at stores, according to ComScore Inc.

Amazon ranked as the most visited online retail store, said ComScore.

Online shopping is also anticipated to be heavy today, which is dubbed Cyber Monday for the number of Web deals that retailers offer. ComScore projected that Cyber Monday sales will increase more than 20% to about $2 billion.

See the original article >>

The Road To 'Rational Markets' in China

By Michael Pettis

Last month’s award of the Nobel Price in economics set off a great deal of chortling because one of the three recipients, Eugene Fama, received the award for saying that markets are efficient at capital allocation and another, Robert Schiller, received the award for saying they are not. Typical is this response by John Kay:

The Royal Swedish Academy of Sciences continues to astonish the public when awarding the Nobel Memorial Prize in Economics. In 2011 it celebrated the success of recent research in promoting macroeconomic stability. This year it pays tribute to the capacity of economists to predict the long-run movement of asset prices.


People with knowledge of financial economics may be further surprised that this year Eugene Fama and Robert Shiller are both recipients. Prof Fama made his name by developing the efficient market hypothesis, long the cornerstone of finance theory. Prof Shiller is the most prominent critic of that hypothesis. It is like awarding the physics prize jointly to Ptolemy for his theory that the Earth is the centre of the universe, and to Copernicus for showing it is not.


To me, much of the argument about whether or not markets are efficient misses the point. There are conditions, it seems, under which markets seem to do a great job of managing risk, keeping the cost of capital reasonable, and allocating capital to its most productive use, and there are times when clearly this does not happen. The interesting question, in that case, becomes what are the conditions under which the former seems to occur.

I wrote about this most recently in my most recent book about China, Avoiding the Fall, and I think it might be useful to recap that argument. I argued in the book (based on some articles I published in 2004-05) that an “efficient” market is one that has an efficient mix of investment strategies. Without this efficient mix, the market itself fails in its ability to allocate capital productively at reasonable costs.

Investors make buy and sell decisions for a wide variety of reasons, and when there is a good balance in the structure of their decision-making, financial markets are stable and efficient. But there are times in which investment is heavily tilted toward a particular type of decision, and this can undermine the functioning of the markets.

To see why this is so, it is necessary to understand how and why investors make decisions. An efficient and well-balanced market is composed primarily of three types of investment strategies—fundamental investment, relative value investment, and speculation—each of which plays an important role in creating and fostering an efficient market.

  • Fundamental investment, also called value investment, involves buying assets in order to earn the economic value generated over the life of the investment. When investors attempt to project and assess the long-term cash flows generated by an asset, to discount those cash flows at some rate that acknowledges the riskiness of those projections, and to determine what an appropriate price is, they are acting as fundamental investors. 
  • Relative value investing, which includes arbitrage, involves exploiting pricing inefficiencies to make low-risk profits. Relative value investors may not have a clear idea of the fundamental value of an asset, but this doesn’t matter to them. They hope to compare assets and determine whether one asset is over- or underpriced relative to another, and if so, to profit from an eventual convergence in prices. 
  • Speculation is actually a group of related investment strategies that take advantage of information that will have an immediate effect on prices by causing short-term changes in supply or demand factors that may affect an asset’s price in the hours, days, or weeks to come. These changes may be only temporarily and may eventually reverse themselves, but by trading quickly, speculators can profit from short-term expected price changes.

Each of these investment strategies plays a different and necessary role in ensuring that a well-functioning market is able keep the cost of capital low, absorb financial risks, and allocate capital efficiently to its more productive use. A well-balanced market is relatively stable and allocates capital in an efficient way that maximizes long-term economic growth.

Each of the investment strategies also requires very different types of information, or interprets the same information in different ways. Speculators are often “trend” traders, or trade against information that can have a short-term impact on supply or demand factors. They typically look for many opportunities to make small profits. When speculators buy in rising markets or sell in falling ones—either because they are trend traders or because the types of leverage and the instruments they use force them to do so—their behavior, by reinforcing price movements, adds volatility to market prices.

Different Investors Make Markets Efficient


Value investors typically do the opposite. They tend to have fairly stable target price ranges based on their evaluations of long-term cash flows discounted at an appropriate rate. When an asset trades below the target price range, they buy; when it trades above the target price range, they sell.

This brings stability to market prices. For example, when higher-than-expected GDP growth rates are announced, a speculator may expect a subsequent rise in short-term interest rates. If a significant number of investors have borrowed money to purchase securities, the rise in short-term rates will raise the cost of their investment and so may induce them to sell, which would cause an immediate but temporary drop in the market. As speculators quickly sell stocks ahead of them to take advantage of this expected selling, their activity itself can force prices to drop. Declining prices put additional pressure on those investors who have borrowed money to purchase stocks, and they sell even more. In this way, the decline in prices can become self-reinforcing.

Value investors, however, play a stabilizing role. The announcement of good GDP growth rates may cause them to expect corporate profits to increase in the long term, and so they increase their target price range for stocks. As speculators push the price of stocks down, value investors become increasingly interested in buying until their net purchases begin to stabilize the market and eventually reverse the decline.

Relative value investors or traders play a different role. Like speculators, they tend not to have long-term views of prices. However, when any particular asset is trading too high (low) relative to other equivalent risks in the market, they sell (buy) the asset and hedge the risk by buying (selling) equivalent securities.

A well-functioning market requires all three types of investors for socially useful projects to have access to appropriately-priced capital.

  • Value investors allocate capital to its most productive use.
  • Speculators, because they trade frequently, provide the liquidity and trading volume that allows value investors and relative value traders to execute their trades cheaply. They also ensure that information is disseminated quickly.
  • Relative value trading forces pricing consistency and improves the information value of market prices, which allows value investors to judge and interpret market information with confidence. It also increases market liquidity by combining several different, related assets into a single market. When buying of one asset forces its price to rise relative to that of other related assets, for example, relative value traders will sell that asset and buy the related assets, thus spreading the buying throughout the market to related assets. It is because of relative value strategies that we can speak of a unified market for different assets.

Without a good balance of all three types of investment strategies, financial systems lose their flexibility, the cost of capital is likely to be distorted, and the markets become inefficient at allocating capital. This is the case, for example, in a market dominated by speculators. Speculators focus largely on variables that may affect short-term demand or supply for the asset, such as changes in interest rates, political and regulatory announcements, or insider behavior.

They ignore information like growth expectations or new product development whose impact tends to reveal itself only over long periods of time. In a market dominated by speculators, prices can rise very high or drop very low on information that may have little to do with economic value and a lot to do with short-term, non-economic behavior.

Value investors keep markets stable and focused on profitability and growth. For value investors, short-term, non-economic variables are not an important or useful type of information. They are more confident of their ability to discount economic variables that develop and affect cash flows over the long term. Furthermore, because the present value of future cash flows is highly susceptible to the discount rate used, these investors tend to spend a lot of effort on developing appropriate discount rates. However, a market consisting of only value investors is likely to be illiquid and pricing-inconsistent. This would cause an increase in the required discount rate, thus raising the cost of capital for borrowers.

Because each type of investor is looking at different information, and sometimes analyzing the same information differently, investors pass different types of risk back and forth among themselves, and their interaction ensures that a market functions smoothly and provides its main social benefits. Value investors channel capital to the most productive areas by seeking long-term earning potential, and speculators and arbitrage traders keep the cost of capital low by providing liquidity and clear pricing signals.

Where Are the Value Investors?


Not all markets have an optimal mix of investment strategies. China, for example, does not have a well-balanced investor base. There is almost no arbitrage trading because this requires low transaction costs, credible data, and the legal ability to short securities. None of these is easily available in China.

There are also very few value investors in China because most of the tools they require, including good macro data, good financial statements, a clear corporate governance framework, and predictable government behavior, are missing. As a result, the vast majority of investors in China tend to be speculators. One consequence of this is that local markets often do a poor job of rewarding companies for decisions that add economic value over the medium or long term. Another consequence is that Chinese markets are very volatile.

Why are there so few value investors in China and so many speculators? Some experts argue that this is because of the lack of investors with long-term investment horizons, such as pension funds, that need to invest money today for cash flow needs far off in the future. Others argue that very few Chinese investors have the credit skills or the sophisticated analytical and risk-management techniques necessary to make long-term investment decisions. If these arguments are true, increasing the participation of experienced foreign pension funds, insurance companies, and long-term investment funds in the domestic markets, as Beijing has done with its QFII program, is certainly seems like a good way to make capital markets more efficient.

But the issue is more complex than that. China, after all, already has natural long-term investors. These include insurance companies, pension funds, and, most important, a very large and remarkably patient potential investor base in its tens of millions of individual and family savers, most of whom save for the long term. China also has a lot of professionals who have trained at the leading U.S. and UK universities and financial institutions, and they are more than qualified to understand credit risk and portfolio techniques. So why aren’t Chinese investors stepping in to fill the role provided by their counterparts in the United States and other rich countries?

The answer lies in what kind of information can be gathered in the Chinese markets and how the discount rates used by investors to value this information are determined. If we broadly divide information into “fundamental” information, which is useful for making long-term value decisions, and “technical” information, which refers to short-term supply and demand factors, it is easy to see that the Chinese markets provide a lot of the latter and almost none of the former. The ability to make fundamental value decisions requires a great deal of confidence in the quality of economic data and in the predictability of corporate behavior, but in China today there is little such confidence.

How to develop the investor base

Furthermore, regulated interest rates and pricing inefficiencies make it nearly impossible to develop good discount rates. Finally, a very weak corporate governance framework makes it extremely difficult for investors to understand the incentive structure for managers and to be confident that managers are working to optimize enterprise or market value.

And yet, when it comes to technical information useful to speculators, China is too well endowed. Insider activity is very common in China, even when it is illegal. Corporate governance and ownership structures are opaque, which can cause sharp and unexpected fluctuations in corporate behavior. Markets are illiquid and fragmented, so determined traders can easily cause large price movements. In addition, the single most important player in the market, the government, is able—and very likely—to behave in ways that are not subject to economic analysis.

This has a very damaging effect on undermining value investment and strengthening speculation. In the first place, unpredictable government intervention causes discount rates to rise, because value investors must incorporate additional uncertainty of a type they have difficulty evaluating.

Second, it puts a high value on research directed at predicting and exploiting short-term government behavior, and thereby increases the profitability of speculators at the expense of other types of investors. Even credit decisions must become speculative, because when bankruptcy is a political decision and not an economic outcome, lending decisions are driven not by considerations of economic value but by political calculations.

China is attempting to improve the quality of financial information in order to encourage long-term investing, and it is trying to make markets less fragmented and more liquid. But although these are important steps, they are not enough. Value investors need not just good economic and financial information, but also a predictable framework in which to derive reasonable discount rates. And here China has a problem.

There are several factors, besides the poor quality of information, that cause discount rates to be very high. These include market manipulation, insider behavior, opaque ownership and control structures, and the lack of a clear regulatory framework that limits the ability of the government to affect economic decisions in the long run. This forces investors to incorporate too much additional uncertainty into their discount rates.

Chinese value investors, consequently, use high discount rates to account for high levels of uncertainty. Some of this uncertainty represents normal business uncertainty. This is a necessary component of an economically efficient discount rate, since all projects have to be judged not just on their expected return but also on the riskiness of the outcome. But Chinese investors must incorporate two other, economically inefficient, sources of uncertainty. The first is the uncertainty surrounding the quality of economic and financial statement information. The second is the large variety of non-economic factors that can influence prices.

This is the crucial point. It is not just that it is hard to get good economic and financial information in China. The problem is that even when information is available, the variety of non-economic factors that affect value force the appropriate discount rate so high that value investors are priced out of the market.

Speculators, however, are much more confident about the value of the information they use. Furthermore, because their investment horizon tends to be very short, they can largely ignore the impact of high implicit discount rates. As a result, it is their behavior that drives the whole market. One consequence is that capital markets in China tend to respond to a very large variety of non-economic information and rarely, if ever, respond to estimates of economic value.

During the past decade, Beijing was betting that increasing foreign participation in the domestic markets would improve the functioning of the capital markets by reducing the bad habits of speculation and increasing the good habits of value investing and arbitrage. But it has become pretty clear that this faith was misplaced: the market is as speculative and inefficient as ever. This should not have been a surprise. The combination of very weak fundamental information and structural tendencies in the market—such as heavy-handed government interventions and market manipulation—reward speculative trading and undermine value investing. This forces all investors to focus on short-term technical information and to behave speculatively. In China even Warren Buffett would speculate.

Investors in Chinese markets must be speculators if they expect to be profitable. As long as this is the case, investors will not behave in a way that promotes the most productive capital allocation mechanism in the market, and such efforts as bringing in foreigners will have no meaningful impact.

What China must do is something radically different. It must downgrade the importance of speculative trading by reducing the impact of non-economic behavior from government agencies, manipulators, and insiders. It must improve corporate transparency. It must continue efforts to raise the quality of both corporate reporting and national economic data. Finally, it must deregulate interest rates and open up local markets to permit arbitragers to enforce pricing consistency and to allow better estimates of appropriate discount rates.

If done correctly, these changes would be enough to spur a major transformation in the way Chinese investors behave by permitting them to make long-term investment decisions. It would reduce the profitability of speculative trading and increase the profitability of arbitrage and value investing, and so encourage a better mix of investors. If China follows this path, it would spontaneously develop the domestic investors that channel capital to the most productive enterprise. Until then, China’s capital markets, like those of many countries in Latin America and Asia, will be poor at allocating capital.

When efficient markets become inefficient


But this is not just an issue for China. In the US there have been times when markets seemed efficient and rational, and times when they clearly were not. Of course this cannot be explained by the disappearance of the tools needed by value investors – for example the market for internet stocks seemed rational in the early 1990s and clearly became irrational by the late 1990s, but this did not occur, I would argue, because fundamental investors were suddenly deprived of their analytical tools.

What happened instead, I would argue, is that conditions that led to a too-rapid expansion of liquidity at excessively low interest rates changed the environment in which fundamental investors could operate. As excess liquidity forced up asset prices, the likes of Warren Buffet found themselves unable to justify buying assets and so they dropped out of the market. As they did, the mix of investment strategies shifted until the market became dominated by speculators, and when this happened what drove prices was no longer the capital allocation decision of value investors but rather than short-term expectations of changes in demand and supply factors that characterize a highly speculative market.

This, I would argue, made the US stock market of the late 1990s (and perhaps today, too) “irrational”, not because they are fundamentally irrational or inefficient but rather because they can only function efficiently with the right mix of investment strategies. When the mix was altered – and this can happen when liquidity is too abundant, or when a sudden shock undermines the confidence value investors have in their ability to analyze data, or when a political event cause uncertainty to rise so high that value investors are priced out of the market, or for a number of other reasons – the markets stopped functioning as they should.

Perhaps what I am saying is intuitively obvious to most traders or investors, but it seems to me that it suggests that the argument about whether markets are efficient or not misses the point. There are certain conditions under which markets are efficient because the tools needed for each of the various investment strategies are widely available and ate credible. When those conditions are not met, because the tools are not available, or when they are temporarily overwhelmed by exogenous events, perhaps because the credibility of those tools are temporarily undermined, or when excess liquidity causes fundamental investors to drop out, markets cannot be efficient.

See the original article >>
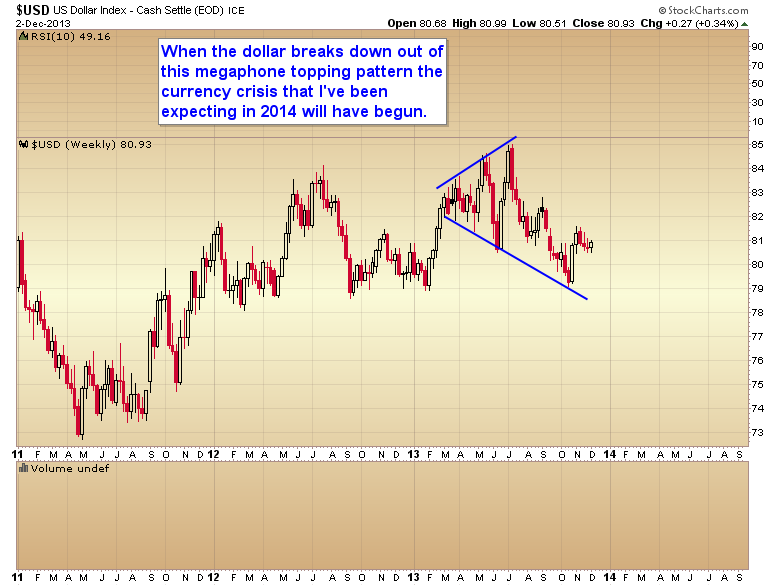
From LIBOR to Fed Funds: 5 facts about the interbank lending market in the US

by SoberLook.com

Contracts worth hundreds of trillions - ranging from corporate loans to mortgages to rate swaps and LIBOR futures - are all priced based on a relatively small unsecured interbank lending market. Also a fairly large group of contracts (in the trillions) is linked to the fed funds rate, which is derived from the bank-to-bank loan market as well. Given its importance, here are some facts about the interbank lending market in the US.
1. The volume of unsecured loans among US banks has collapsed in recent years. Banks fund themselves with deposits, bonds, repo, commercial paper, etc. After the 2008 experience, borrowing from other banks is rarely a material part of banks' funding strategy. The situation in Europe's interbank markets is even worse.

Interbank loans outstanding

2. While most of the LIBOR-based contracts are linked to the 3-month rate, the bulk of the interbank market on which these contracts are based is overnight. It is rare to see banks lending to each other for more than a week or two. This is the main reason that some trading desks were able and incentivized to manipulate the LIBOR index (1-3 month lending market often just didn't exist).
3. Some may find this a bit confusing but the overnight LIBOR rate and the "fed funds effective" rate are two different ways of measuring essentially the same thing: the rate at which banks lend dollars to each other overnight.  The reason for the differences in the two indices is the universe of banks and the methodology used to determine the averages.

Red = Fed Funds Effective; Blue = O/N LIBOR

4. The largest lenders in the US overnight unsecured market are not even commercial banks. According to the NY Fed, most overnight liquidity is provided by the Federal Home Loan Banks (FHLBank System), which are government-sponsored entities (h/t Kostas Kalevras  - @kkalev ). Unlike regular US banks, FHLBs receive zero rate on the reserve cash with the Fed. That's why they tend to lend their cash out to banks overnight at 7-12 bp (which is still better than zero). That is also why the fed funds rate and the overnight LIBOR are significantly lower than the 25bp paid on reserves.
And here is the kicker. Some privately owned commercial banks borrow these funds from FHLBs and often leave them on deposit with the Fed at 25bp. This spread between the interest on reserves and the interbank loan rate (fed funds effective) is basically free and riskless revenue for the banking system - courtesy of the federal government.

NY Fed: - FHLBs aren’t eligible to earn IOER [interest on excess reserves], they have an incentive to lend in the fed funds market, typically at rates below IOER but still representing a positive return over leaving funds unremunerated in their Federal Reserve accounts. Institutions have an incentive to borrow at a rate below IOER and then hold their borrowed funds in their reserve account to receive IOER and thus earn a positive spread on the transaction.

Source: NY Fed

5. It's enough of a problem that trillions worth of contracts are priced based on this shrinking market. Now consider the fact that the Fed's traditional tool to target monetary policy is based on the overnight interbank market where participants use government agencies to create a riskless arbitrage. And unless there is a change, the Fed will return to targeting the fed funds rate as its primary tool, once QE ends. That is why the pressure is building on the central bank to develop alternative methods (see post) for targeting short-term rates that will actually impact the broader economy.

See the original article >>
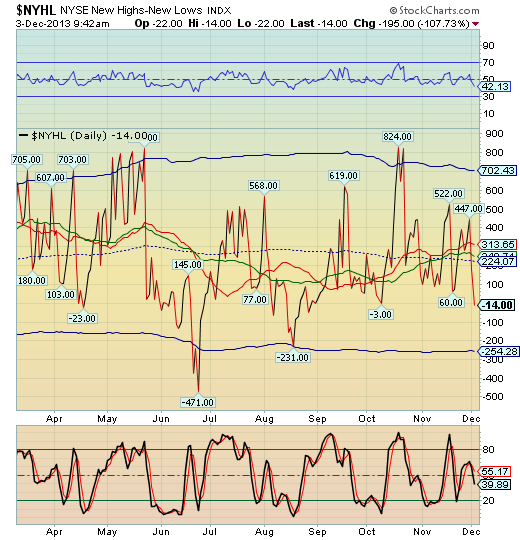
Follow Us