by Greg Harmon
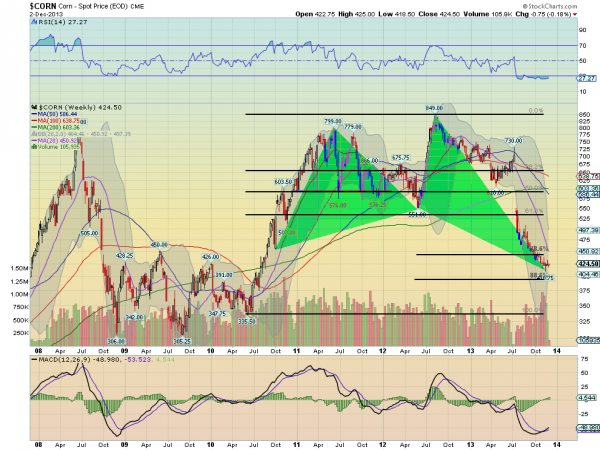
Corn prices moved higher throughout 2010 and 2011 reaching record high levels. After a brief pullback in mid 2012 they then retested those highs and kept going. Making new record highs in August of 2012. but since then it has been all down hill for corn. The grain has lost over half of its value and is settling in at the area it had consolidated for a long time before this nonsense started. There is a lot of previous price history between 350 and 430 that could act as a buffer. So what is next for corn? The weekly chart of the price action suggests that there are 3 reasons (well 4 if you count the one above) that the fall may be over.
First, the Relative Strength Index (RSI) has moved to oversold territory, under 30. It is not extreme but has been here for over 4 months already. Combine this with the MACD crossing and moving higher, the second signal, and a turn in the RSI could be the signal that tells you to start buying. Finally from the world of Harmonics, the price action has traced out a bullish Shark pattern (green triangles), and moved both ways through the Potential Reversal Zone (PRZ) at 411.40 two weeks ago. This is a reversal signal and with a move higher targets a 38.2% retracement of the pattern, which would take it to 578.15. Look for a move over 450 to confirm the upside.

No comments:
Post a Comment