By Cullen Roche
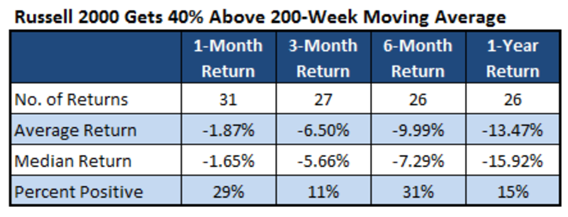
| Just passing along an interesting insight from the always excellent Todd Harrison at Minyanville: “The next charts were shared courtesy of Neil Azous. The first is the percentage of Russell 2000 stocks above their 200-week moving averages, which is at 40% (MKM Partners). Historically, when that percentage reaches 40%, it was at or near an intermediate-term top in the index. The second is the average return for the 1-, 3-, 6-month and 1-year periods following those events. Take a good look. 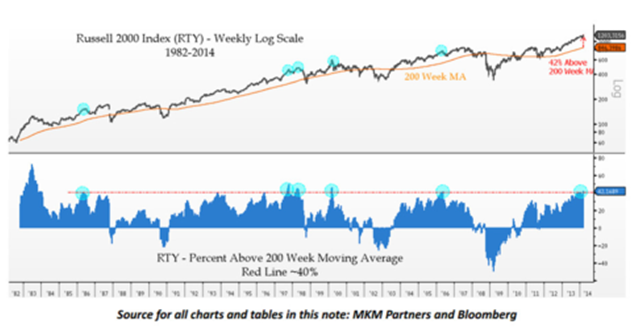
History doesn’t always repeat but it often rhymes, and after the insane run in the small caps and biotech stocks – here are two ways to play that complex– perspective is an important context when mapping forward risk. As we often say, to fully understand where we are, we must understand how we got here. Hopefully, this post helps shed some light on that matter.” |
See the original article >>
No comments:
Post a Comment