by Greg Harmon
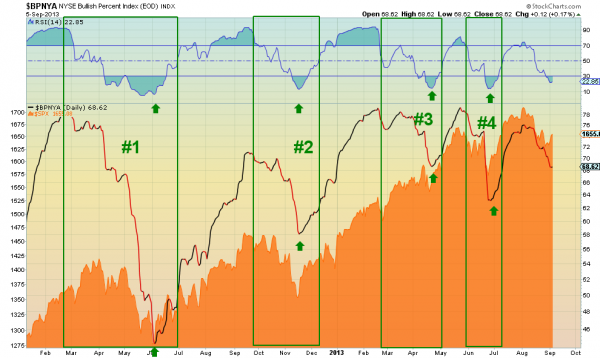
Five months ago the market was in a similar set up. Maybe working off some of the last run higher or maybe about to start a major move. At least that was the debate, and it is again today. At the time I asked – Market Corrections: Did You Miss The Big One? Turns out that was a bottom, and we have had yet another one since then in June. At the time I used the NYSE Bullish Percentage Index as an indicator to give a possible outcome. Below is the updated chart from the April low. What is it telling us now?
The key to this chart is the NYSE Bullish Percent Index ($BPNYA) hitting an extreme oversold condition. Not that the index has actually been sold but the momentum to the downside is extreme. The previous 4 bottoms the RSI, which measures that momentum, has bottomed between 5 and 15. It is currently at 22.85, and may have bottomed. Not quite there but very close. Close enough that it could reverse at any time. So what happens if it does? Well, the last two years history shows that like an extremely oversold stock the BPNYA will reverse and when it does it takes the S&P 500 ($SPX) up with it. That does not mean it will happen this time. What do you think?

No comments:
Post a Comment