by Roman Chuyan
The U.S. equity market has continued its uninterrupted bull run for three years in a row. The last significant correction occurred in July-October of 2011, and was -18% from peak to trough.
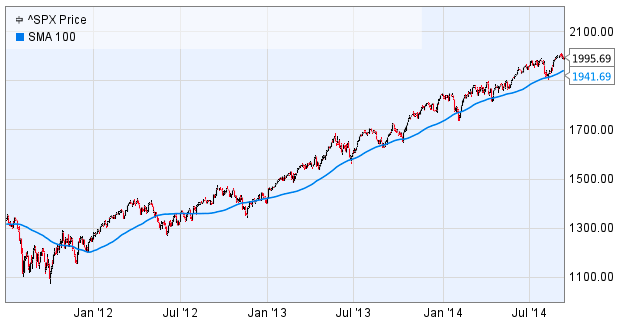
Source: Ycharts
This has been especially surprising to some observers given all the geopolitical problems around the world. Triggered by several armed conflicts (Ukraine, Gaza, the ISIS) the recent dip in stocks in July-August nonetheless ended up being minor - just -3.9% from peak to trough. Equities recovered strongly in August, with the S&P 500 (NYSEARCA:SPY) up 3.95% in the month (a total return of 9.9% YTD), reaching new all-time highs and crossing the psychologically-important 2000 level.
Audiences are bombarded with bearish opinions by the financial media and on the web (including here on Seeking Alpha), while we rarely see a bullish one. This is a known phenomenon - people react more strongly to bad news than good. The media, that are in the business of attracting and engaging the broadest audience possible, know this. As the old newspaper men used to say, "when it bleeds, it leads." Bearish voices get louder during market declines, as it did in August when perma-bears ranging from Marc Faber to Jim Grant, to Peter Schiff, were featured in the financial media to present their always-bearish cases. While bearish opinions get all the prominence in the media, the case of strong economic fundamentals gets little notice.
Economic Fundamentals
But why are U.S. stocks doing so well? It's because U.S. economic fundamentals are very strong - I provide just a few examples below. Fundamentals drive markets, not geopolitics.
At Model Capital Management, we monitor over 20 fundamental factors that influence equity index returns, according to our tactical investment research. We categorize these factors into Economic, Valuation, and Market groups. In this article, I cover some of the purely-economic factors. I will write about non-economic fundamentals that belong to Valuation and Market groups in a follow-up article, so please stay tuned.
Durable Goods Orders surged 22.6% in July to $300.1 billion, according to the Commerce Department. This was by far the sharpest monthly increase, and the highest monthly order volume, in the history of the series, dating back to 1992. Orders were fueled by aircraft and automobiles; excluding transportation, orders are still close to an all-time high (see chart).
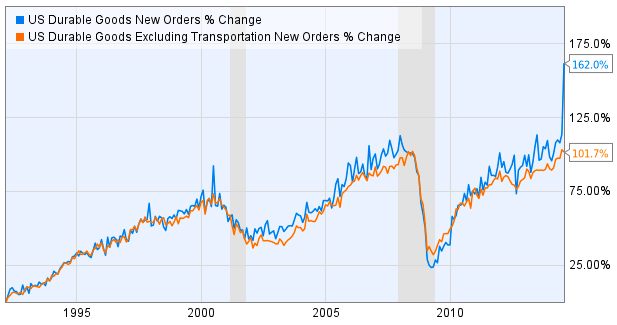
Source: Commerce Department
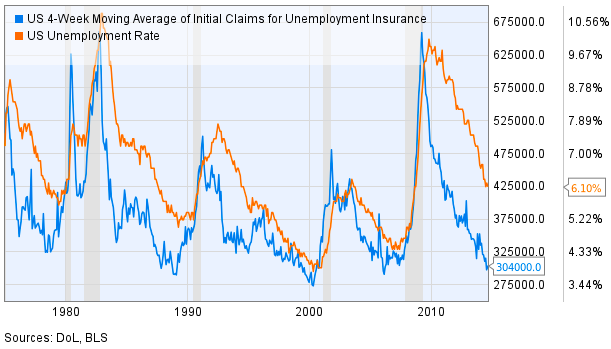
Employment was slow to recover from the Great Recession. But it has now not just recovered - it is, in fact, quite strong, both historically and compared to other developed economies. Initial jobless claims are at 304,000 (on a 4-week-average basis). In the past 40 years, claims reached this low level only three times: in 1988, in 1999-2000, and briefly in 2006 (see chart). Unemployment rate lags jobless claims; it took some time to for it to recover to the current level of 6.1%, as it did after the previous severe recession of 1981-82. However, with claims this low and with strong job openings, it's only a matter of time before unemployment and workforce participation rate recover as well.
Consumer sentiment and spending are healthy as well. For example, a measure of Consumer Sentiment just released today rose to 84.6, the second-highest monthly reading since 2007 (after July-2013). Of course, not all is perfect yet in the economy, which the bearish observers are quick to point out - income and unemployment rate are lagging (as they typically do). We must be realistic - it's a process that takes time. The strength in most areas of the economy (housing, jobless claims, job openings, consumption) should lift those lagging factors over time.
Based on fundamental factors, our tactical investment management models expected strength in U.S. equities all of this year, which gave us at Model Capital confidence to keep our portfolios in full risk-on position - and they did well. While data may change at any time, our models expect strength in U.S. equities to continue in the near term. Based on that, we recommend to overweight U.S. equities and underweight bonds. Allocate the maximum amount allowed by an investor's risk tolerance (or institution's investment policy) to broad U.S. equities - example ETFs are SPY, the Vanguard Total Stock Market ETF (NYSEARCA:VTI), and the iShares Core S&P 500 ETF (NYSEARCA:IVV). We also currently recommend an overweight to Growth factor (the iShares S&P 500 Growth ETF (IVW), the Guggenheim S&P 500 Pure Growth ETF (RPG), and the PowerShares QQQ Trust ETF (QQQ) are some examples).
No comments:
Post a Comment