by Greg Harmon
So much negativity in sentiment recently. It truly seems that most people not only are leaning bearish but that they want the markets to go lower. That just seems un-American to me. You have heard all of the issues for the bear case. Low volume, Taper coming, Syria (seriously???), divergences in the indicators, the lack of participation from the Generals. All of these ignore one major point. Stocks are making new highs and putting in higher lows. I am not throwing caution to the wind but how about looking at the bull case for a minute or two before you cut your wrists and down a bottle of bourbon. Here are 4 pictures that look bullish to me on multiple timeframes. Let’s start with the shorter run.
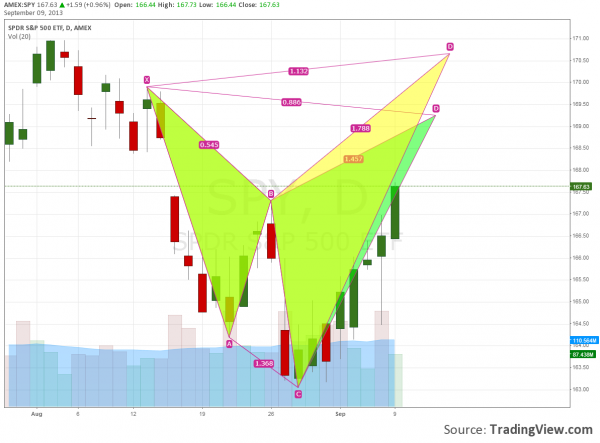
The S&P 500 ($SPY) shock off the Hanging Man candle Friday and moved strongly higher Monday. Now it is into the gap and in the middle of a Shark Harmonic. The Potential Reversal Zone (1) is at 169.24 and PRZ (2) is at 170.65, just shy of the all-time high. The positions of the gaps are different and the current levels compared to the recent highs, but on a short term basis the Dow Jones Industrials ($DIA), Russell 2000 ($IWM) and Nasdaq 100 ($QQQ), are all showing the same pattern, and making new highs over the August 26th peak. lets move a little further out.
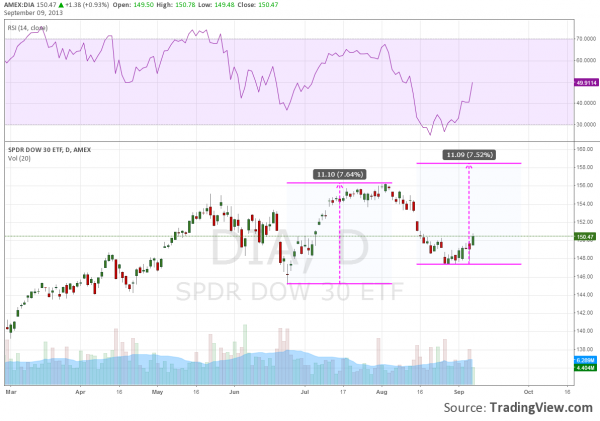
The DIA above shows yet another bullish pattern when you expand the chart out a bit. After rising from the November lows it began a pullback in May. The low set on June 24th then rebounded higher before making another low August 28th and turning back up. There is something bullish about this recent low. It creates a Positive RSI Reversal, where the RSI makes a new low while the the price does not. This gives a target higher equal to the previous move. For the DIA that would mean a new all-time high at 158.44. This RSI Positive Reversal is found in the charts of the QQQ, IWM and SPY as well. Ok, another step out.
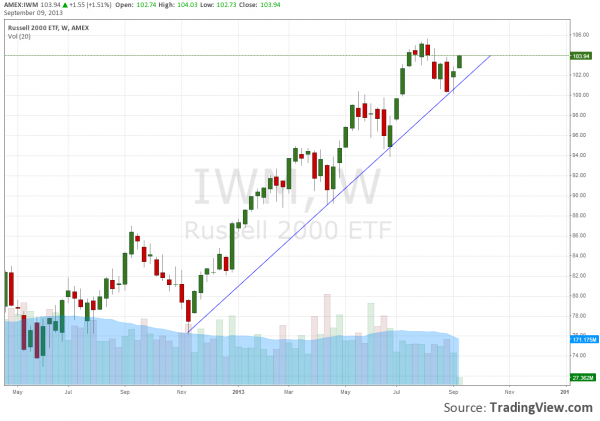
The IWM on the weekly chart shows that it has held the rising trend support from the November lows. The latest bottom touched it again but it has held and is moving back higher. The DIA also touched the rising trend before reversing but the SPY stopped a little short of the trend and the QQQ is just waving at it as it goes higher. Every one f thee indexes is in an uptrend and looks to be renewing that uptrend. But it gets better still.
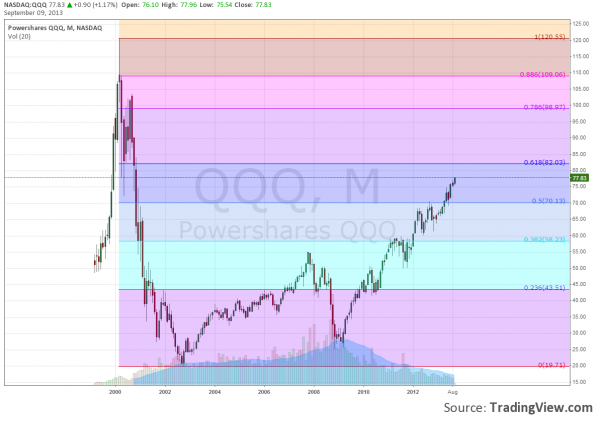
Finally the chart of the QQQ on a monthly timeframe shows longer term, since the 2009 lows, the uptrend is not only intact but making new highs. The QQQ is out in front today, maybe because it still has ground to make up from the tech bubble sell off, but the SPY, DIA and IWM are all a Phil Mickelson flop shot away from their all-time highs.
All of these trends on all of these time scales can reverse. And if they do I will change my mind. But the price action now makes me stand up and say I AM BULL, even if I am the only one in the room doing it.


No comments:
Post a Comment