by Greg Harmon
The standard answer to this question goes something like “it depends on how high it falls from from”. So is this a Dead Cat Bounce or something else? How can you be sure that the market has settled and is ready to move higher, or that the next leg down is about to occur? There will be plenty of prognosticators preaching in each camp. All I can guarantee is that come September or October about half of them will be right and half will be wrong.
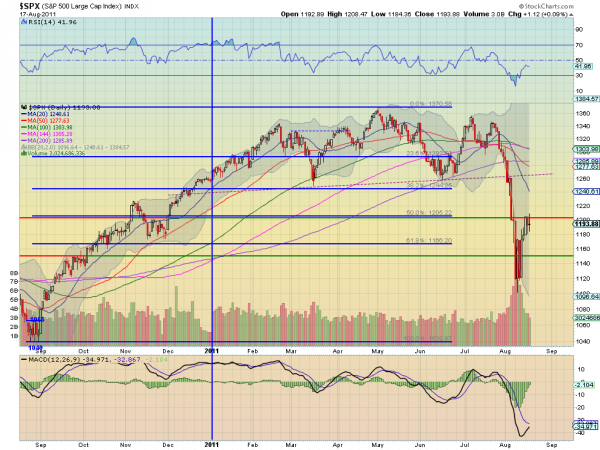
What I do have to offer is that from the daily chart of the S&P 500 ($SPX) below, there are signs of a move about to happen. First the last three daily candles, culminating in the long legged doji Wednesday, have been finding resistance and consolidating at the 1200 level. This can be expected as it is near the 50% Fibonacci level at 1205 from the move that started in September to the top May 2nd. As it has bounced off of the bottoming last week at 1120 the volume has declined

back to the average level from before the increased volume of the move lower. But from a relative basis the move higher has occurred with declining volume. The Relative Strength Index (RSI) has moved off the bottom strongly but now appears to be have topped in the mid 40′s and may be turning back lower. But the Moving Average Convergence Divergence (MACD) indicator is moving towards a positive cross. Also price is still extended from the 20 day Simple Moving Average (SMA), but all of the SMA’s are rolling lower.
The preponderance of information from the daily chart sets up for a move lower, but the MACD diverging throws a monkey wrench in the analysis. If it does head lower there is support at 1166, 1150 and 1120. Below that 1100 is the key to whether it continues down to 1065 or 1040, where the move form September higher began. If it can close over 1210 then the bulls have a chance to push it higher. As I write this Thursday morning the futures suggest that the day will be lower and a test of 1166 or 1150 will come. The future is still murky for the S&P 500 despite lower volatility and volume back to the normal range, so stay nimble or stay out.
No comments:
Post a Comment