by Greg Harmon
All hammers are not alike. Any carpenter will tell you that different jobs can require the different characteristics of a different weight or size of the head. A small tacking hammer for detailed work around molding, a bigger framing hammer for building the bones of the house all the way up to a sledgehammer for massive force on outside jobs. This is the same with hammers on candlestick charts. They all signal a potential for a reversal after a downtrend but some carry more force than others. In looking at the Select Sector SPDR weekly charts there are many differences in the strength of the hammers they printed this week. Let’s take a look.
Sledgehammer
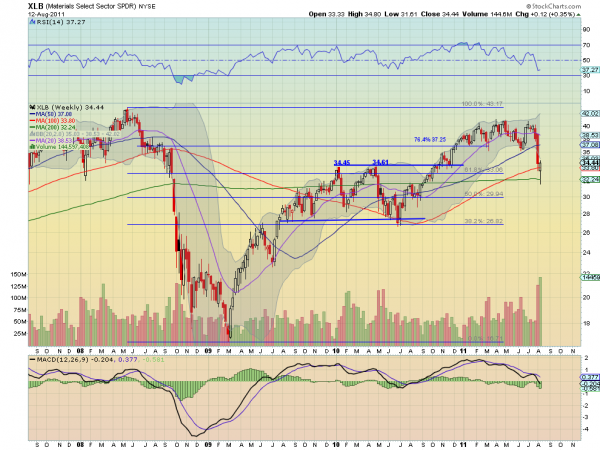
There was only one sector that printed a hammer on the week that ended higher than the previous week. This was the Materials Select Sector SPDR, $XLB. From the chart below you can see that the 100 week Simple Moving Average (SMA) provided support for the eventual move only slightly

higher. The Relative Strength Index (RSI) has moved sideways, ending the downward motion, but the Moving Average Convergence Divergence (MACD) indicator is still growing more negative. Like the force behind a sledgehammer blow, the move was powerful but there may still be collateral damage unseen. Watch to see if it moves back into the Bollinger bands and holds there.
Framing Hammer
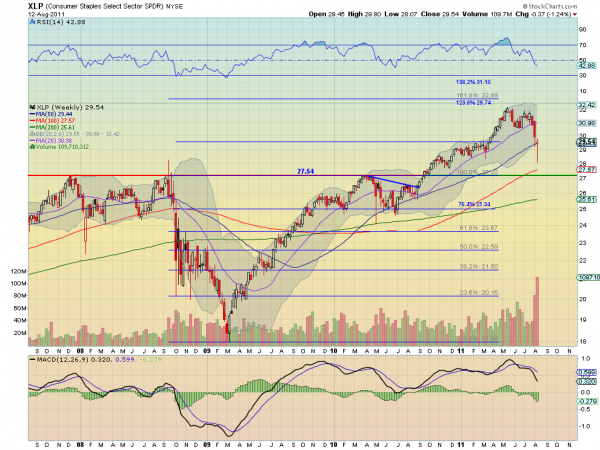
Two sectors printed hammers that showed some strength and are building a frame that may lead to further advances. These are the Consumer Staples Select Sector SPDR, $XLP and Utilities Select Sector SPDR, $XLU. From the chart the of $XLP below these two are distinguished by the fact that their hammers finished back inside their Bollinger bands and above the 50 week SMA. They have
Consumer Staples Select Sector SPDR, $XLP

RSI’s that are still trending down and MACD’s that are growing more negative in the downtrend,so there is no reason to get excited yet. But their hammers were hollow despite being red, showing that the activity for the week was bullish and their SMA’s are sloping upward. Hope.
Tacking Hammer
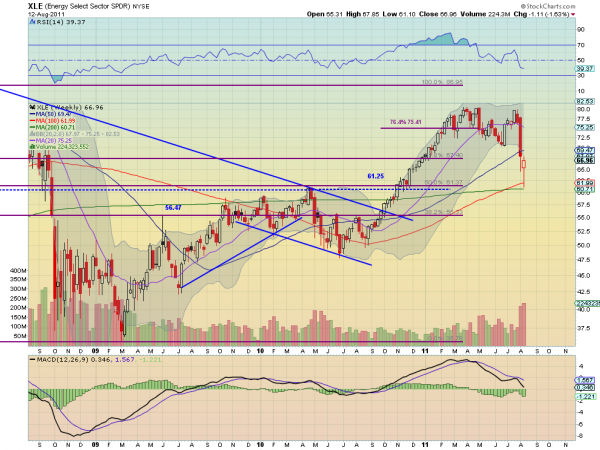
Five sectors showed very little strength in the hammers that they printed. The Energy Select Sector SPDR, $XLE, Industrials Select Sector SPDR, $XLI, Technology Select Sector SPDR, $XLK, Health Care Select Sector SPDR, $XLV and Consumer Discretionary Select Sector SPDR, $XLY make up this group. From the chart of the $XLE below, notice that these sectors finished below their 50 week
Energy Select Sector SPDR, $XLE

SMA, their RSI is still downward and their MACD is growing more negative. Additionally the 20 week SMA for each has rolled lower. The $XLI is slightly worse than the others as it is below the 100 week SMA. There is some hope though, with each in this group finishing outside of its Bollinger band, that they may jump back in or at last consolidate while the Bollinger band catches up and the hollow red candle signals bullish intra-week activity.
Toy Hammer
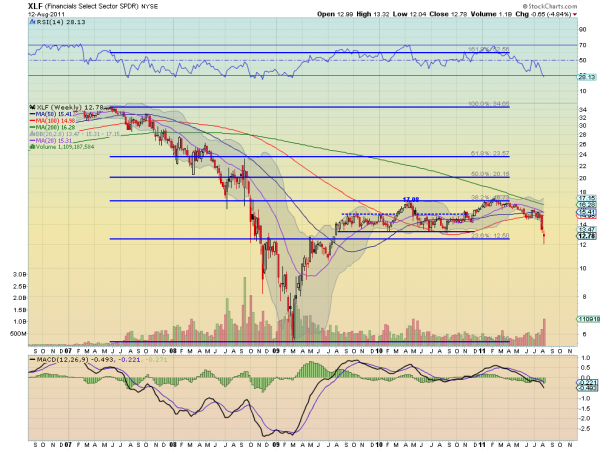
The Financials Select Sector SPDR, $XLF printed the weakest hammer of all of the sectors. Like a plastic toy hammer it did not have enough force to drive higher on the week and printed a bearish red candle. This sector continues to look the weakest with all of the SMA’s sloping lower, the RSI
Financials Select Sector SPDR, $XLF

driving lower and the MACD growing more negative. It is also outside of its Bollinger bands so it might bounce or consolidate but nothing looks good on this chart.
There were Hammer Candles printed everywhere this past week. And that is a signal to prepare for a reversal, but only if confirmed. A few sectors, $XLB, $XLP and $XLU hold more promise than others, but just because they have stronger hammers does not mean they will be confirmed. A hammer strike may miss the mark and damage the wood around the nail, and a hammer on a chart may just be a pause before more downside. Watch for confirmation before making a move unless you have the nimbleness of a day trader.
No comments:
Post a Comment