by Greg Harmon
Last week’s review of the macro market indicators suggested, heading into the next week the markets looked to be in a better mood. We looked for Gold ($GLD) to continue to consolidate or move lower while Crude Oil ($USO) continued to rise. The US Dollar Index ($UUP) and US Treasuries ($TLT) were biased lower and looking ugly. The Shanghai Composite ($SSEC) and Emerging Markets ($EEM) were biased to the downside as well. Volatility ($VIX) looked to remain subdued keeping the bias higher for the equity index ETF’s $SPY, $IWM and $QQQ, and any move lower could trigger a strong equity buy signal. The Equity Index ETF’s themselves were poised to continue their trends higher with the QQQ the strongest followed by the IWM and then the SPY.
The week played out with Gold moving lower and then consolidating while Crude Oil continued higher. The US Dollar did continue lower while Treasuries rebounded slightly on the week. The Shanghai Composite had a short week, gapping lower and setting as Emerging Markets moved lower early in the week then consolidated. Volatility moved back to last weeks highs before pulling in a bit higher but remained subdued. The Equity Index ETF’s SPY, IWM, and QQQ chopped up and down with some big range days. What does this mean for the coming week? Lets look at some charts.
As always you can see details of individual charts and more on my StockTwits feed and on chartly.)
SPY Daily, $SPY 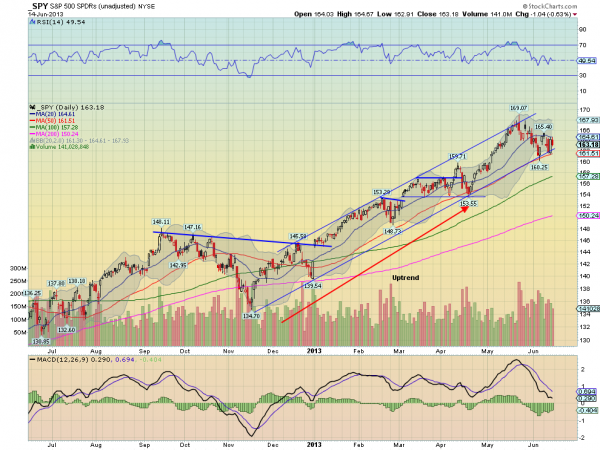
SPY Weekly, $SPY 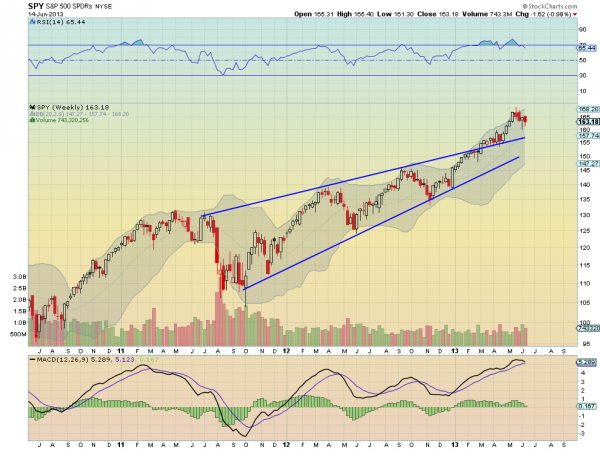
The SPY started the week breaking above the 20 day SMA but it did not last. A move back down to the 50 day SMA and it may be range bound for a little bit, between the two SMA. The uptrending support from November continues to hold and the volume is starting to tail off. The RSI on the daily chart is holding at the mid line, in bullish territory with a MACD that is starting to level on the signal line and is improving on the histogram. A mixed picture. Out on the weekly view the pullback continues, resembling a bull flag. A break of that flag higher has a Measured Move to 175. The RSI has worked off a technically overbought condition with a MACD that is rolling over. Some negative signals on this timeframe. There is support lower at 163 and 161.60 followed by 159.70 and 157.10. Resistance higher is found at 166.50 and 167.50 before 169. Consolidation with a Downside Bias in the Uptrend.
Heading into next week look for Gold to consolidate with a downward bias while Crude Oil moves higher. The US Dollar Index and US Treasuries look to continue lower. The Shanghai Composite and Emerging Markets are also biased to the downside. Volatility looks to remain low but slowly trending higher making the bias lower for the equity index ETF’s SPY, IWM and QQQ, in the short run. Their charts also show signs of a pullback with than SPY and QQQ both weaker than the IWM. Use this information as you prepare for the coming week and trad’em well.
No comments:
Post a Comment