by Greg Harmon
Last week’s review of the macro market indicators suggested, as September began to look for Gold ($GLD) to continue to bounce in its downtrend while Crude Oil ($USO) rose with a chance of consolidation. The US Dollar Index ($UUP) looked to be reversing higher while US Treasuries ($TLT) were biased higher in the short term in their downtrend. The Shanghai Composite ($SSEC) looked to continue to consolidate with an upward bias as Emerging Markets ($EEM) were poised to move lower. Volatility ($VIX) looked to remain subdued but creeping higher keeping the wind at the backs of the equity index ETF’s $SPY, $IWM and $QQQ, despite the moves lower last week. Their charts suggested that the downside is not over yet though, with the SPY and IWM looking lower while the QQQ looked the strongest and most likely to just consolidate instead of falling.
The week played out with Gold ripping higher while Crude Oil also moved up, but consolidated some gains later in the week. The US Dollar broke lower and found a bottom while Treasuries rebounded to fill upside gaps. The Shanghai Composite continued to consolidate in a tight range at the recent lows while Emerging Markets gave up some of their gains, perhaps rolling over. Volatility bounced off of the lows but remained subdued. The Equity Index ETF’s peaked with the SPY and QQQ making new multi-year highs before all gave back some ground late in the week. What does this mean for the coming week? Lets look at some charts.
As always you can see details of individual charts and more on my StockTwits feed and on chartly.)
SPY Daily, $SPY 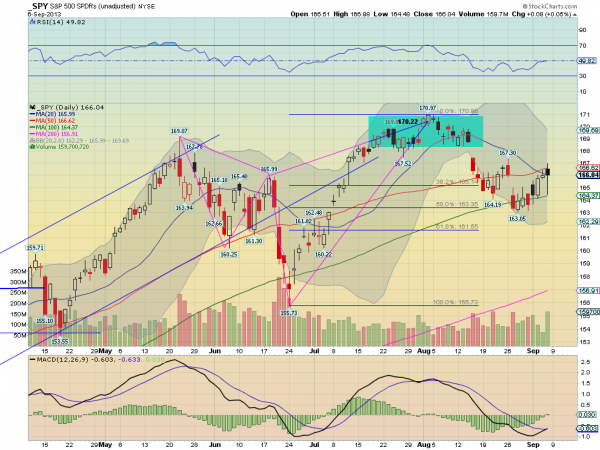
SPY Weekly, $SPY 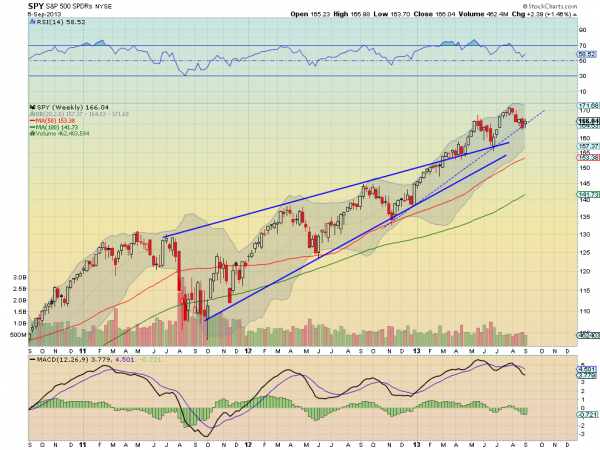
The SPY moved higher out of consolidation this week, falling just short of the 50 day Simple Moving Average (SMA). The move closed one gap above, leaving one left unfilled. The Hanging Man candle Friday, if confirmed lower Monday, could signal a reversal. The Relative Strength Index (RSI) on the daily chart is flattening at the midline, not a sign of strength to push higher, but the Moving Average Convergence Divergence indicator (MACD) is crossing higher, which is a positive sign. On the weekly view the price continues to hold above the rising trend support from the November low with a RSI that is turning higher. The lower low in RSI combined with the higher low in price, if holds, would confirm a RSI Positive Reversal with a target of 178.29. The MACD on this timeframe though is turning decidedly lower, suggesting the downside is not over. There is resistance higher at 166.50 and 167.45 followed by 169 and 170.97. Support lower comes at 164.50 and 163 followed by 161.60. There is a mixed picture on both timeframes. Consolidation with Short Term Upside Bias.
Back to a full week after the holidays Gold looks to continue lower in the short term uptrend while Crude Oil marches higher. The US Dollar Index is biased higher in the long consolidation while US Treasuries are poised to continue lower. The Shanghai Composite looks to continue higher while Emerging Markets join it after a strong reversal. Volatility looks to remain subdued keeping the bias higher for the equity index ETF’s SPY, IWM and QQQ. The charts themselves show that the QQQ is very strong looking for new highs while the IWM is next and the SPY the weakest of the bunch. Use this information as you prepare for the coming week and trad’em well.
No comments:
Post a Comment