by Greg Harmon
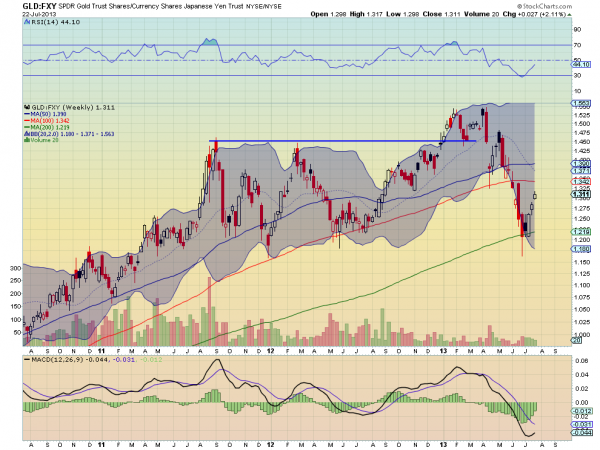
Two weeks ago I suggested buying gold in yen terms ($GLD, $FXY) in Time To Buy Gold….in Yen Terms. Since then it is up over 6%. Not bad work for two weeks. And the trend remains higher, but there are some signs that the latest move might just be an oversold bounce in a downtrend. If that is the case you will want to dispose of it quickly because if this heavy metal drops on your foot it will hurt. The weekly chart below is what gives the first clue. The first white candle, as a bullish engulfing candle was a great start higher. But the next two have been gaps and smaller bodies. This is indicative of an Advance Block Pattern, and a sign of exhaustion. This fits with the rest of the picture with the 50 and 100 week Simple moving Averages (SMA) still overhead and the Relative Strength Index (RSI) rising but unable to cross the mid line yet.
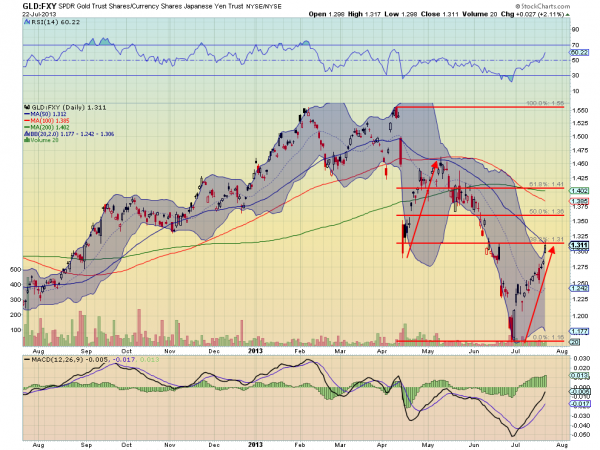
It can still move higher from here, but the daily chart also has signals that suggest to at least tighten the stop loss if not take some profits. The gap higher has reached the falling 50 day SMA with an upper shadow. It has bounced the same amount as the previous bounce higher and is reaching the 38.2% retracement of the full move lower. But this chart is much more bullish than the weekly chart. The Bollinger bands are opening for it higher and the RSI is into bullish territory with a rising Moving Average Convergence Divergence indicator (MACD) all say don’t be so quick to take profits. The best idea here is to hold on with a tighter stop if you are long, maybe even take off 1/4 or 1/3 of the position. And be prepared for a full reversal lower.


No comments:
Post a Comment