by Gregory W. Harmon
Last week’s review of the macro market indicators looked for Gold to continue its run higher and for Crude Oil to continue to consolidate with a bias for any breakout to the upside. The US Dollar Index looks ready to move higher but could consolidate further, while US Treasuries move sideways. The Shanghai Composite looks ready to break the flag higher while Emerging Markets consolidate in a broad range between 44.2 and 48.2. Volatility looks to remain subdued but despite this Equity Index ETF’s, SPY, IWM and QQQ look biased to the downside in their broad ranges, but near support. A true stock pickers market.
The week began by Gold and Crude Oil reversing roles, with Gold consolidating around the 1600 level and Crude Oil moving higher. The US Dollar Index tested higher Monday but then fell throughout the week while Treasuries did consolidate. The Shanghai Composite continued its flag, and Emerging Markets kept the range drifting towards the top end. Volatility came back in and as it did the SPY, IWM and QQQ dropped Monday and rose through out the rest of the week, with the QQQ’s making a new high. What does this mean for the coming week? Let’s look at some charts.
As always you can see details of individual charts and more on my StockTwits feed and on chartly.)
Gold Weekly, $GC_F
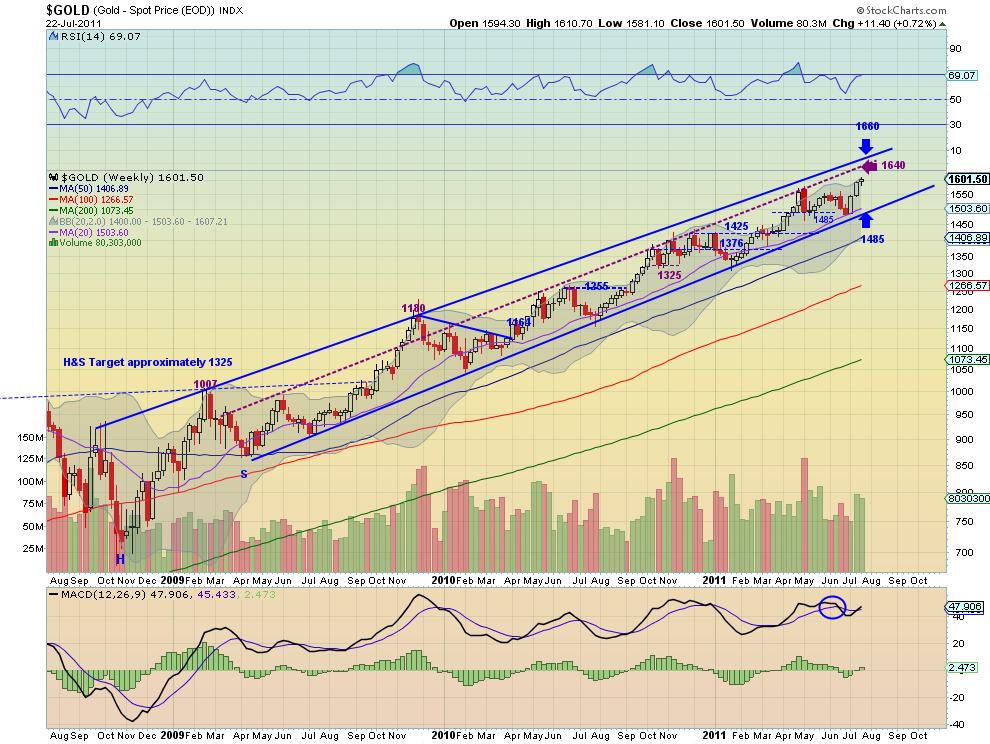
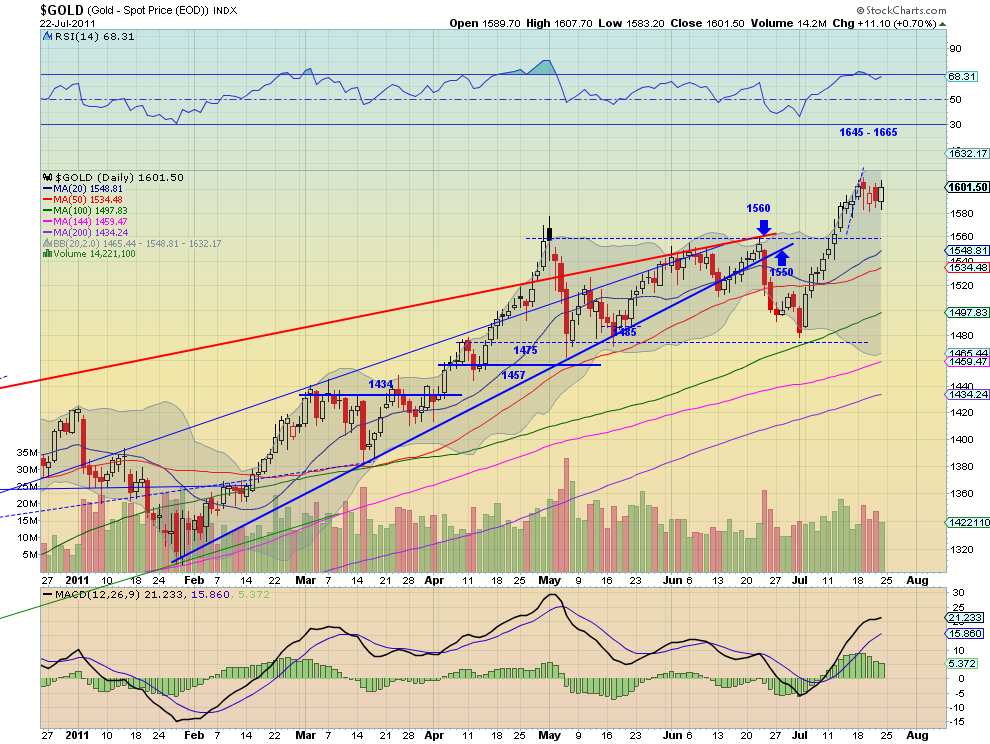
Gold spent the week building a bull flag between 1580 and 1600. On the daily chart it has positive reinforcement for more upside from the Relative Strength Index (RSI) and the rising Simple Moving Averages (SMA). But the diverging Moving Average Divergence Convergence (MACD) waning has led to consolidation. On the weekly chart the bull case for Gold remains very strong. The RSI is high and the MACD has crossed positive to join the upward sloping SMA’s. look for Gold to continue higher next week with short term targets in the 1640-1665 area and with any pullback limited to 1560 area.
West Texas Intermediate Crude Weekly, $CL_F
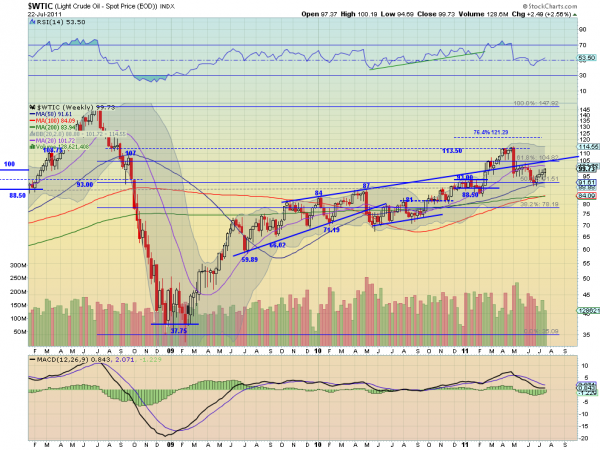
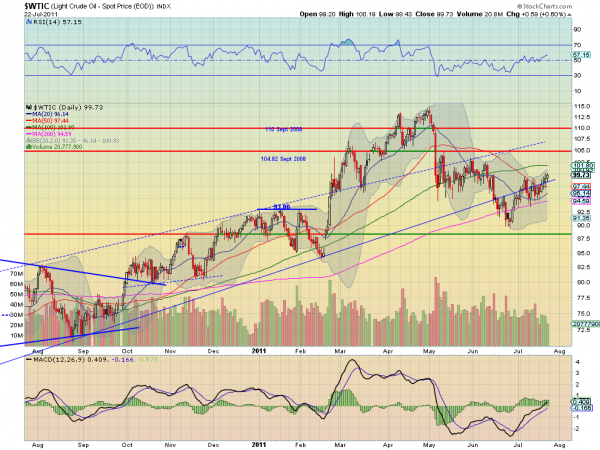
Crude Oil continued to move higher along the extension of the trendline support from 2010. The RSI is trending higher and the MACD on the daily chart shows a slow drift higher. both supporting more upside. The weekly chart also has a bullish bias to it with a rising RSI and a MACD that is improving toward zero. Look for more drift to the upside next week with a move above 100 seeing resistance at 104.82. Any pullback should find support by 93.
US Dollar Index Weekly, $DX_F
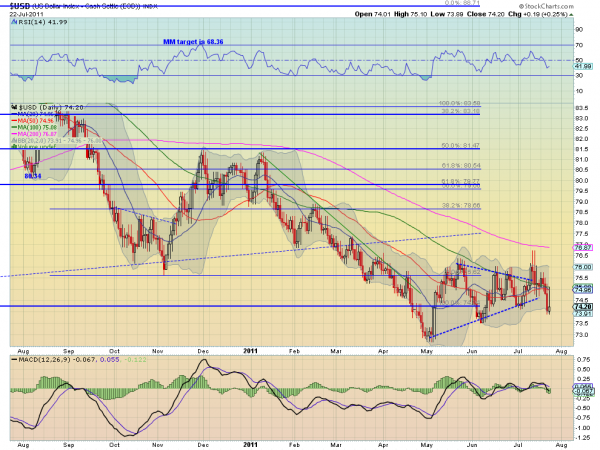
The US Dollar Index fell out of the apex of the symmetrical triangle on the daily chart and tested support at 74. The RSI is sloping lower and the MACD is growing more negative on the daily chart. The weekly chart is also bearish with the RSI rolling lower and the MACD rolling lower as well. Look for more downside next week with support at 73.50 and 73 before 72 and a test of the lows at 71.50. Any move higher should find resistance at 74.80, the triangle mid point, and then 76.00.
iShares Barclays 20+ Yr Treasury Bond Fund Weekly, $TLT

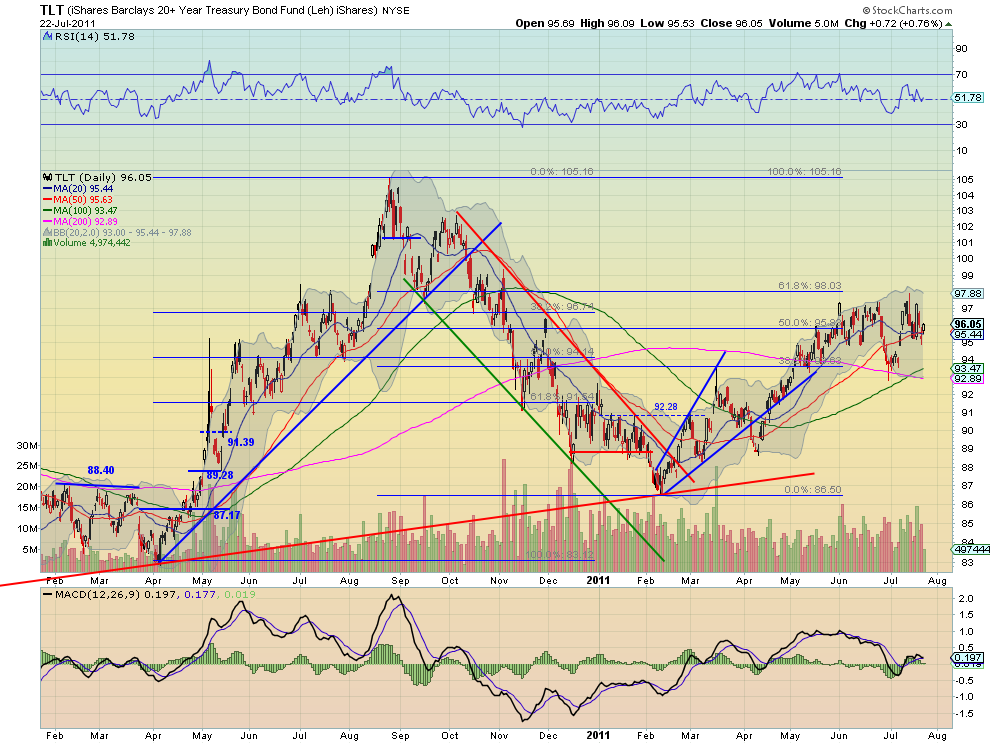
US Treasuries, measured by the TLT ETF, remained in a tight range in a consolidation zone. The daily chart shows the rejection at the top of the range and hold at 95 on top of the SMA cluster. The RSI is bouncing along the mid line and the MACD heading back to zero. The weekly chart shows that the top of the triangle center line area is big resistance at 97.30 but that the short term trend is higher. The RSI is moving back up but starting to roll and the MACD is waning. The majority of the indicators suggest that next week will be lower for bonds within the uptrend if they break consolidation. Look for support to come at 95 and then 93, while a move above 97.30 would change the forecast to higher with a target of a touch of the top rail at 102.50.
Shanghai Stock Exchange Composite Weekly, $SSEC
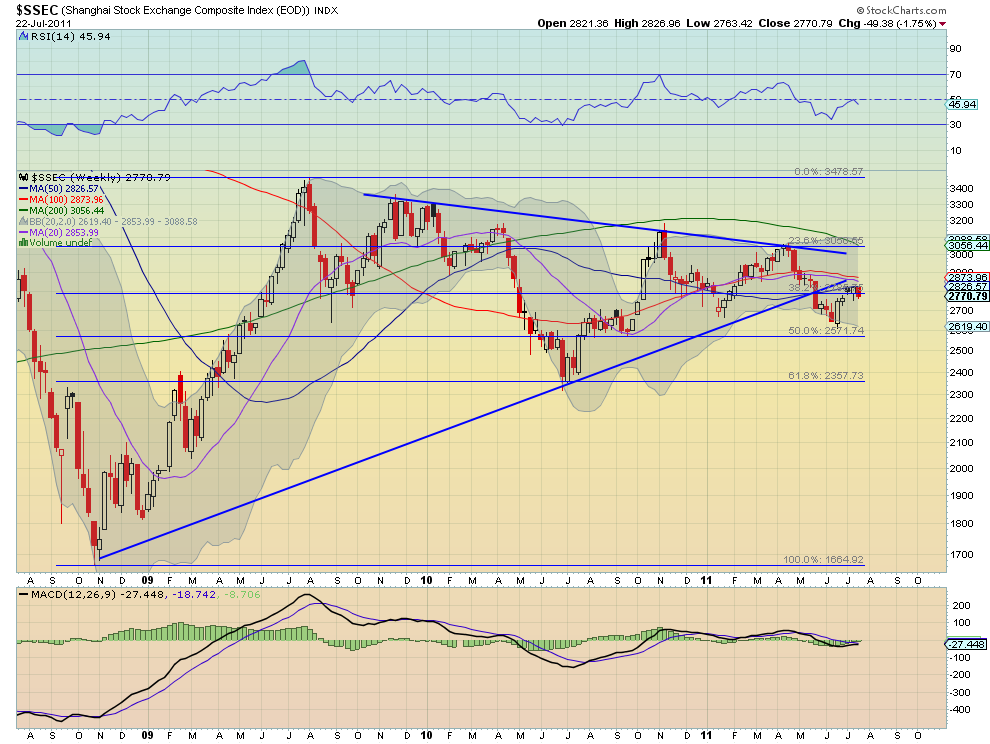
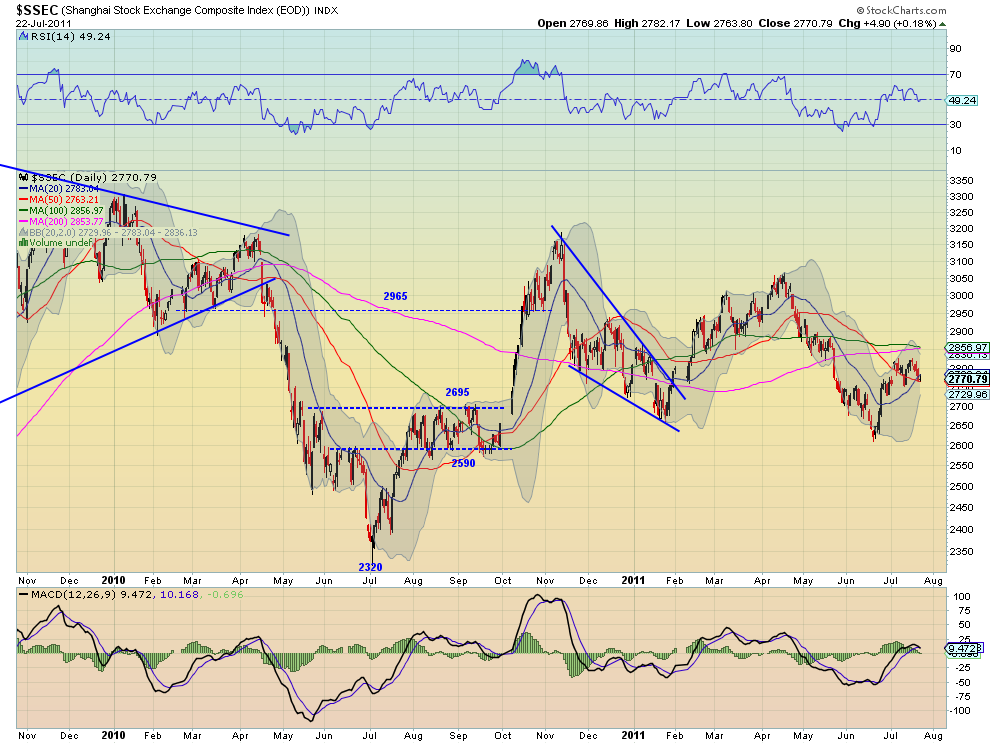
The Shanghai Composite continued in the range between 2750 and 2850 during the past week. The daily chart has a RSI that is falling but holding the mid line which has been support while the MACD is crossing negative. Also note that the Bollinger bands are starting to tighten. The weekly chart shows that the 38.2% Fibonacci level at 2785 is still playing a leading role, just below the weekly SMA’s. The MACD may be heading to a positive cross but from a shallow level while the RSI is rejecting lower off of the mid line. Next week looks like more of a mixed bag with a consolidation range. Any rise looks to meet resistance at 2800 and then 2900 and any drop to find support in the 2695-2700 area.

iShares MSCI Emerging Markets Index Weekly, $EEM
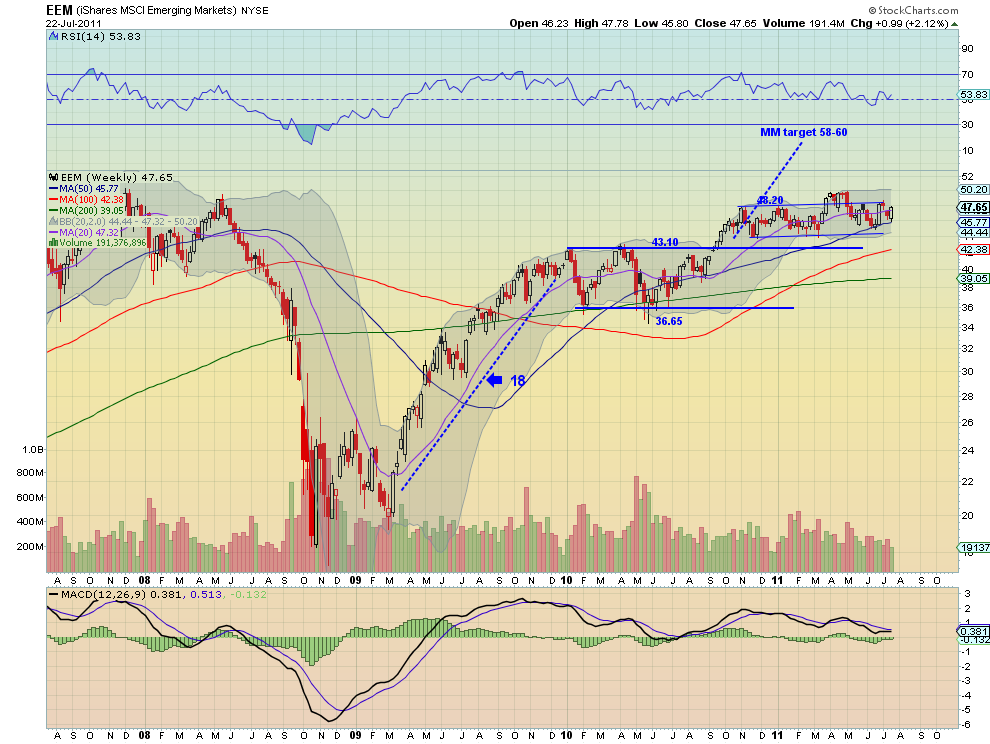
Emerging Markets, measured by the ETF EEM, moved higher off of support with in a tight range. The daily chart shows the move up began off of a Hammer candle and finished the week with a Hanging Man. It has positive reinforcement from a RSI that is trending higher and MACD that is crossed positive. On the weekly chart the consolidation can be seen more clearly between 44.20 and 48.20. The MACD is meandering and the RSI bouncing but not getting far from the mid line. Look for continued consolidation within the broad range in the coming week with a possible test of the top of the range based on the short term bullishness in the daily chart.
VIX Weekly, $VIX
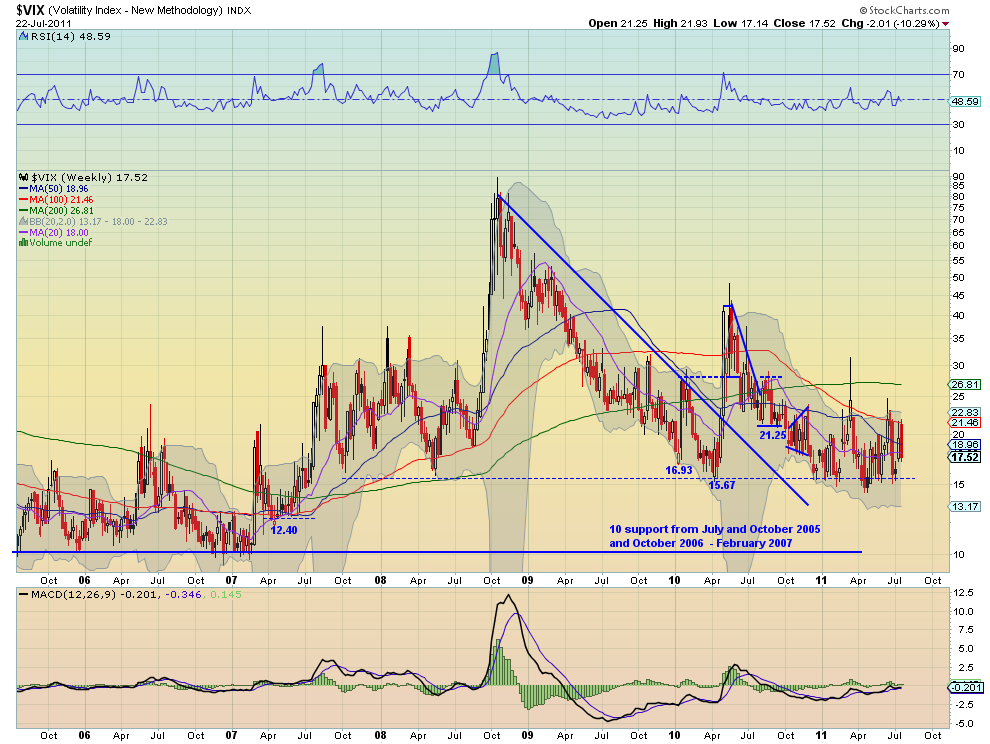
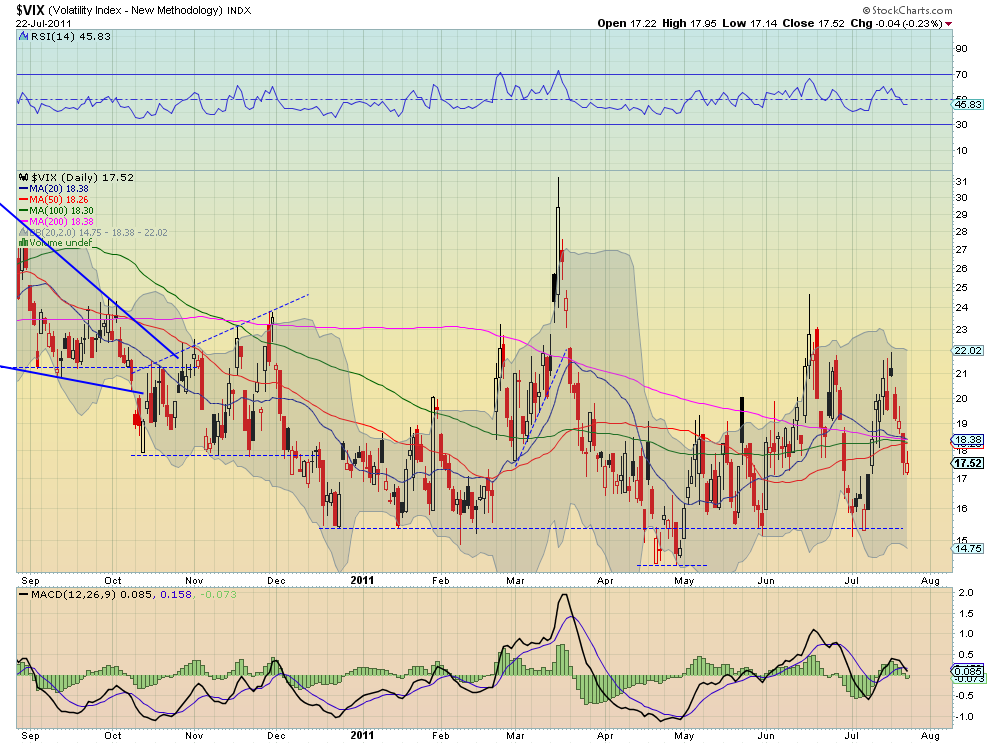
The Volatility Index met resistance at the 21.25 level and fell throughout the week. The daily chart shows the RSI heading lower and the MACD crossing down, suggesting more downside. The weekly chart shows the falling SMA’s played a role at resistance and the RSI still hovering near the mid line. The MACD is flat as well. Look for Volatility to remain low and in a range between 15.50 and 22 with the possibility of an upside surprise reaching as far as 24.
SPY Weekly, $SPY
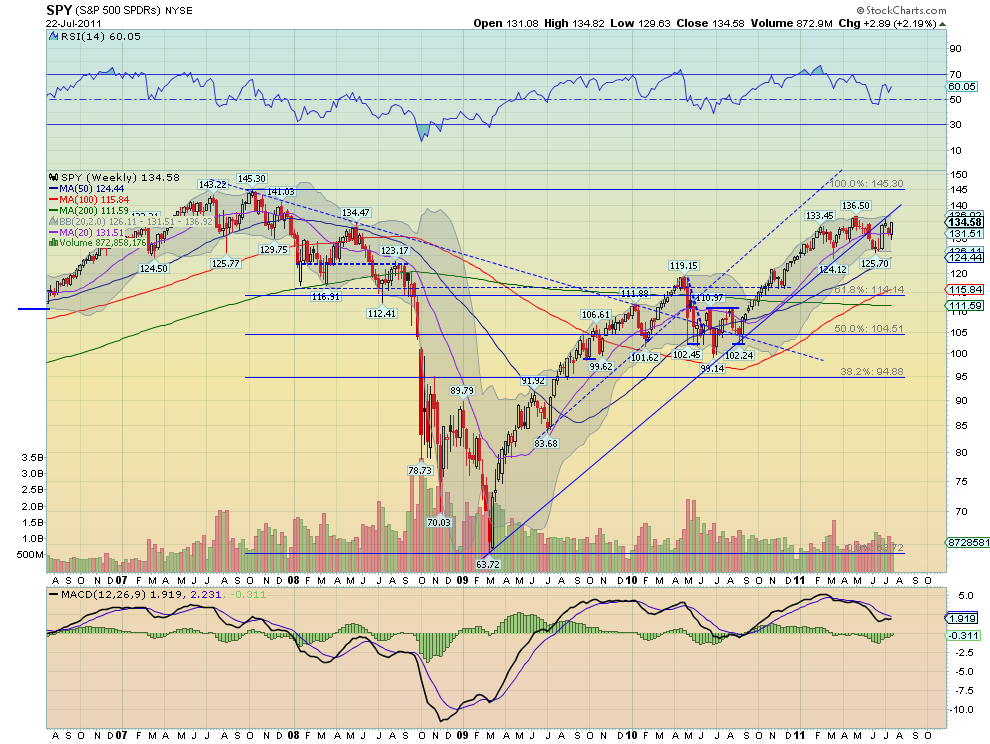
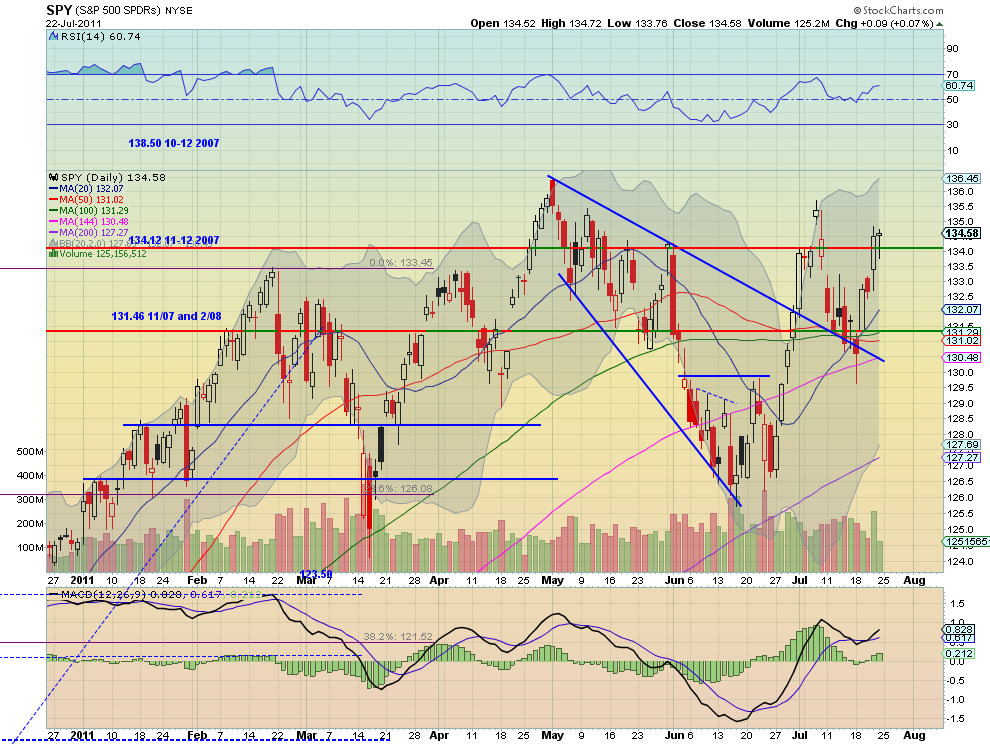
The SPY found a bottom Monday printing a Hammer reversal candle near the previous downtrend support and then rising through the week, finishing with a Hanging Man. It is over long term support/resistance at 134.12 and with a MACD that is increasing and a RSI that is slowly moving up, looks positive. The weekly chart shows that it bounced off of the 20 week SMA and is now approaching resistance. The RSI is trending higher and the MACD is about to cross up. Look for next week to be biased to the upside with resistance higher at 135.60 followed by 136.50 and then 141. Any pullback should find support at the 134.12 or 131.46 levels. A hold and move higher above 136.50 would signal an end to consolidation and a trend change to higher.
IWM Weekly, $IWM
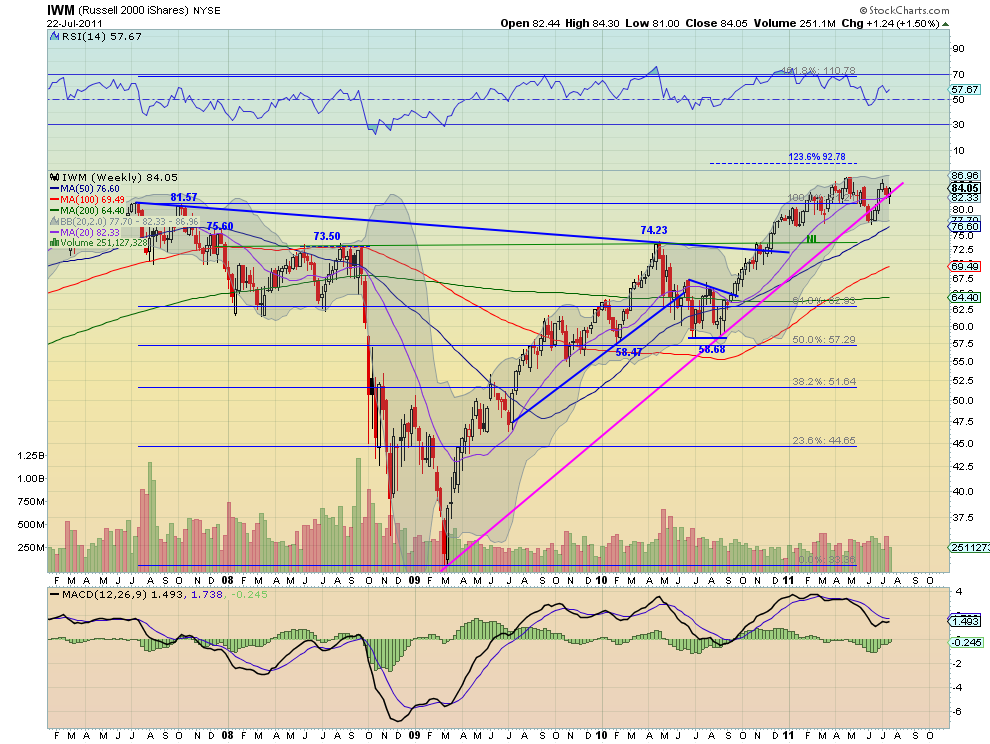
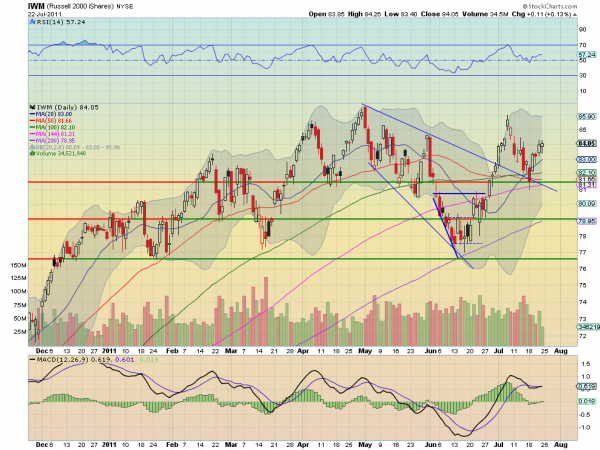
The IWM also found a bottom Monday reversing near the previous downtrend support and then rising through the week, finishing with a Hanging Man. It is over long term support/resistance at 81.57 and with a MACD that has crossed up and is increasing, and a RSI that is slowly moving up, looks positive. The weekly chart shows that it is now approaching resistance. The RSI is trending higher and the MACD may be about to cross up. Look for next week to be biased to the upside with resistance higher at 85 followed by 86 and then 86.55. Any pullback should find support at the 81.57 or 79.10 levels. A hold and move higher above 86.55 would signal an end to consolidation and a trend change to higher.
QQQ Weekly, $QQQ
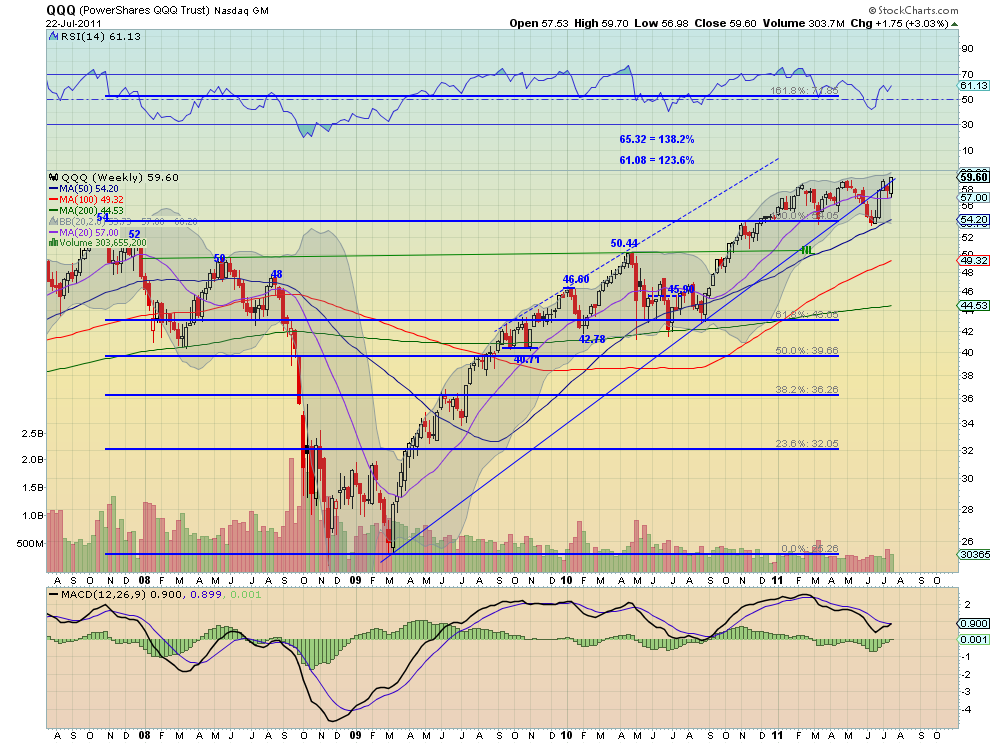
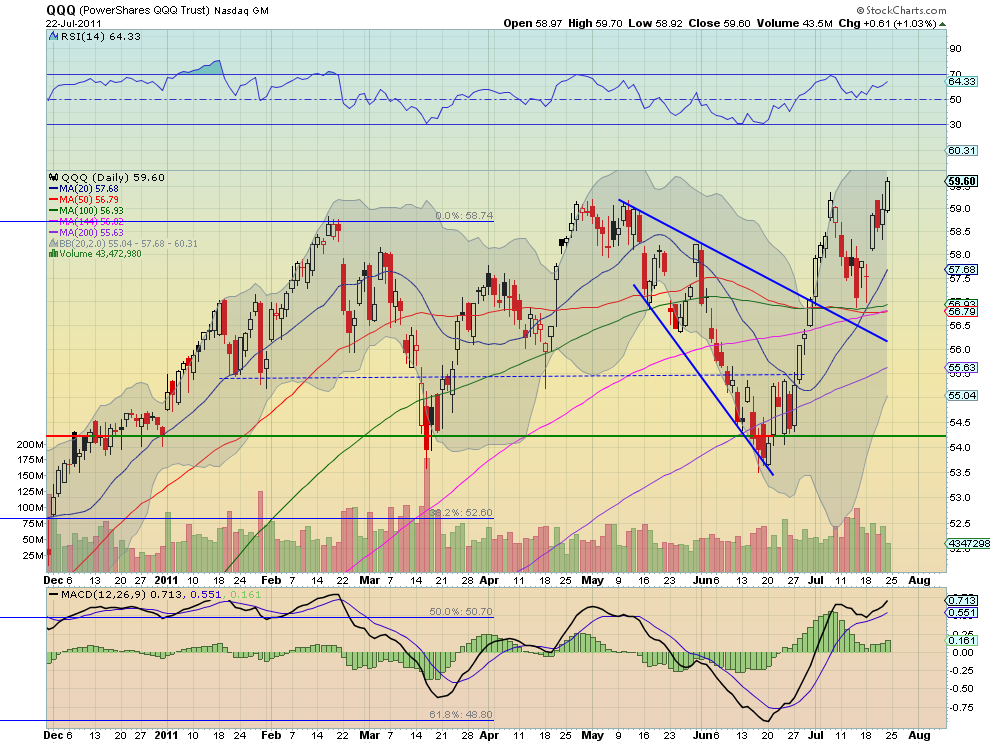
The QQQ found a bottom Monday printing a long legged doji reversal candle near the confluence of the SMA’s and then rising through the week, finishing with a strong move higher Friday. It has a MACD that is increasing and a RSI that is slowly moving up, the strongest of the three indexes on the daily timeframe. The weekly chart shows that it is breaking resistance. The RSI is trending higher and the MACD is about to cross up. Look for next week to be biased to the upside with targets higher at 60 followed by 61.08 and then 65.32. Any pullback should find support at the 57 or 54.26 levels. A continued move higher above 60 would signal an end to consolidation and a trend change to higher.
Next week looks for the move higher in Gold and Crude Oil to continue. The US Dollar Index and US Treasuries conversely are set up to move lower, with a chance of Treasuries just running in place. The Shanghai Composite and Emerging Markets look as though they may test the top of their consolidation ranges. Volatility appears to remain muted and allow for the Equity Indexes SPY IWM and QQQ to continue to test higher and perhaps break their consolidation ranges, with the QQQ already making a new high. Use this information to understand the major trend and how it may be influenced as you prepare for the coming week ahead. Trade’m well.
No comments:
Post a Comment