by
Last week’s review of the macro market indicators looked for Gold to continue lower with Crude Oil biased to the upside but defined by the range between 88 and 102, I know that is big just stay away from the middle. The US Dollar Index looked headed higher to test the trend break in a bear flag, while US Treasuries continue lower. The Shanghai Composite was headed higher towards a test of the breakdown while Emerging Markets continue higher to resistance. The Volatility Index looked to remain stable allowing a run higher by the Equity Indexes toward previous highs from April.
The week began with Crude Oil and the US Dollar Index acting as the charts suggested, both heading higher. But Gold also moved higher. US Treasuries consolidated and then rose Friday. The Shanghai Composite held higher in a narrow range while the Emerging Markets found resistance and bounced. Volatility remained low and the Equity Index ETF’s SPY, IWM and QQQ moved higher. What does this mean for the coming week? Lets look at some charts.
As always you can see details of individual charts and more on my StockTwits feed and on chartly.)
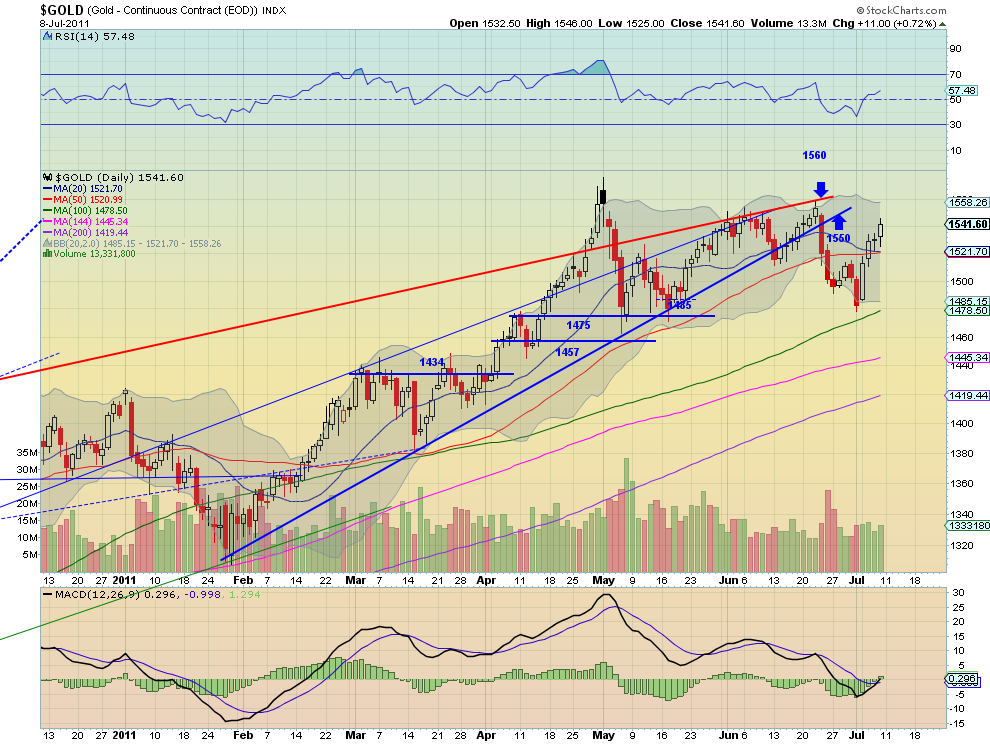
Gold Weekly, $GC_F
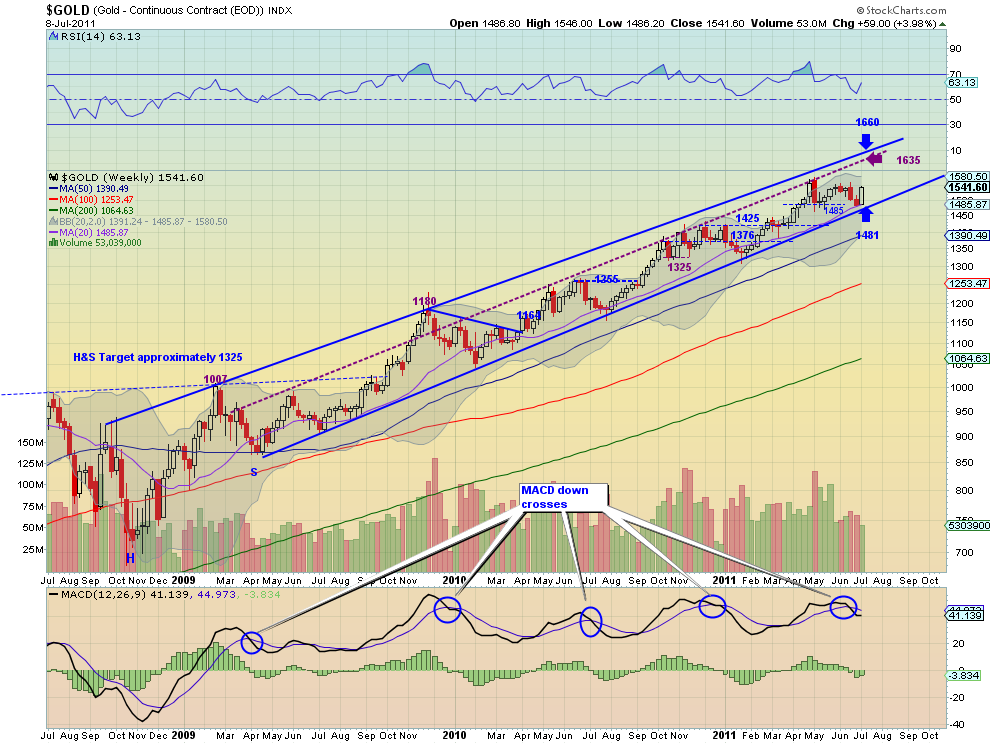
Gold moved higher off of the bottom at 1485 and settled for the week just under resistance at 1550. The daily chart shows the Relative Strength Index (RSI) creeping higher and the Moving Average Convergence Divergence (MACD) crossing up, bullishly. The weekly chart shows the role that the 20 week Simple Moving Average (SMA) played in support launching Gold higher. The RSI is moving steeply higher and the MACD is reversing up towards the zero line. Look for Gold to continue higher next week with a move above 1550 leading to a test of the highs at 1563 and then 1600 in its sights. Any pullback has support at 1516 and then 1500 before the double strong support at 1481-1485.
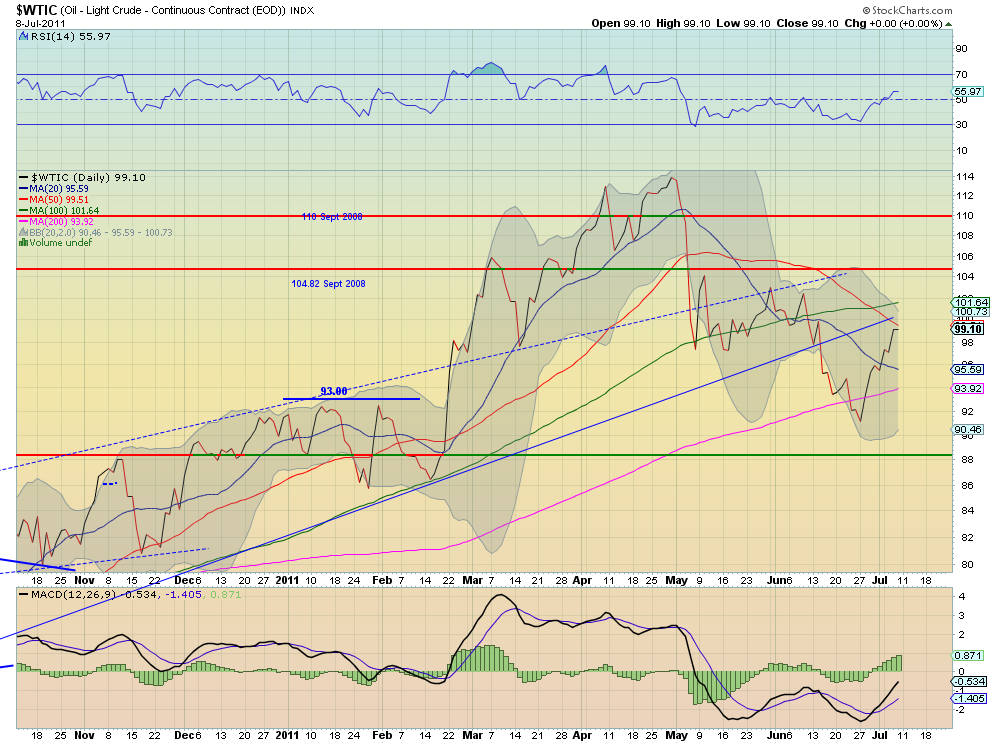
West Texas Intermediate Crude Weekly, $CL_F
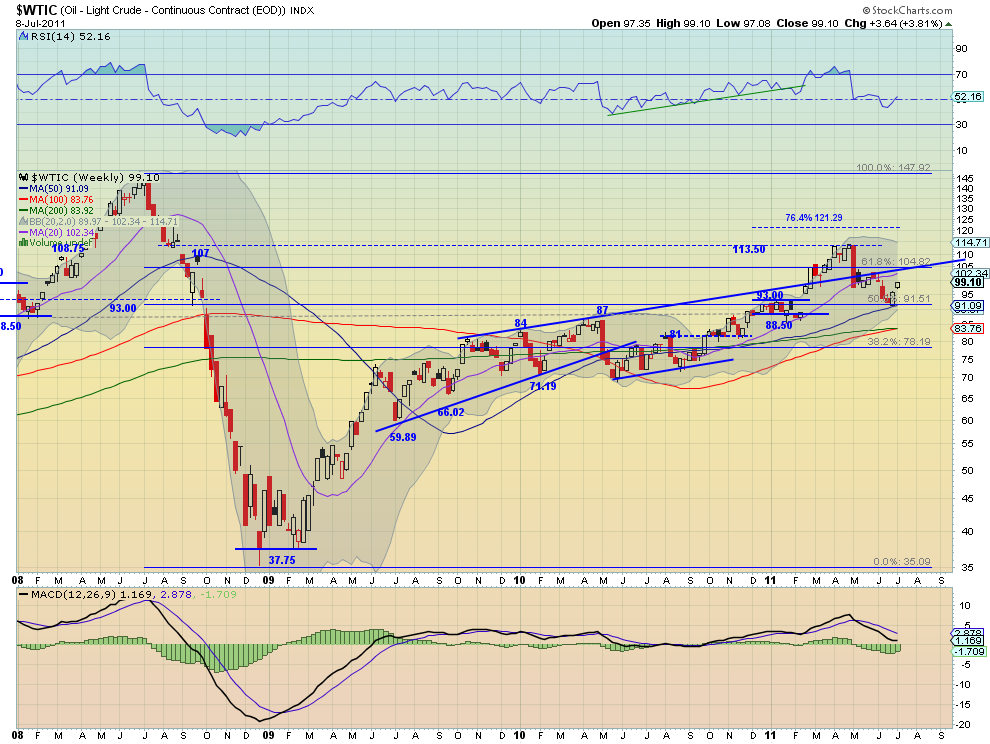
Crude Oil continued its move higher this week and is now approaching the rising trend line at 100 on the daily chart. The RSI is trending higher and the MACD is increasing, supporting more upside. The weekly chart shows crude closing on its highs as it moves towards the intersection of the extended trendline from from 2009 and the 104.82 Fibonacci level. The weekly RSI is moving higher while the MACD is improving towards the flat line. Crude looks to head higher next week and through 100 likely to take a run at 104.82. Any pullback should be contained by support at 93.
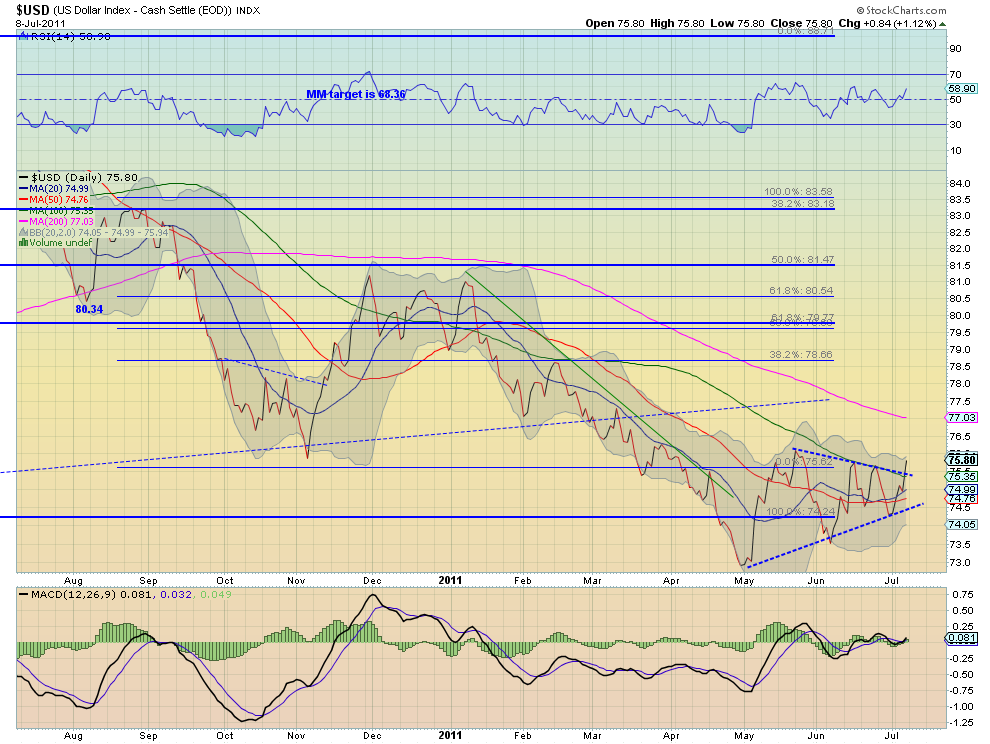
US Dollar Index Weekly, $DX_F

The US Dollar Index is breaking out above a symmetrical triangle on both the daily and weekly timeframe. It has a rising RSI on the daily chart with the MACD very flat, supporting more upside. The weekly chart shows the RSI poking at the mid line and the MACD positive and increasing. It still has work to erase the down trend but a move above 76 would gain some attention. Look for more upside next week with a retest of the multi-year uptrend breakdown at 77.30 still a possibility. Any move below 74.80 will gather steam lower.

iShares Barclays 20+ Yr Treasury Bond Fund Weekly, $TLT
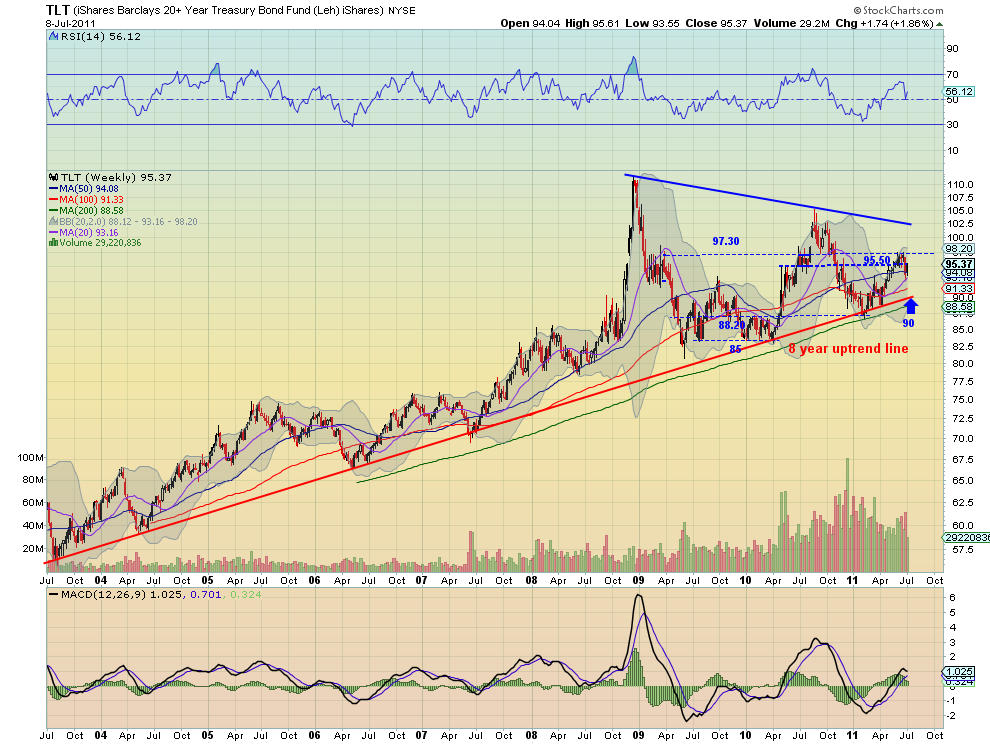
US Treasuries, proxied by the ETF TLT, consolidated testing support just above the 38.2% retracement of the move from August 2010, before moving higher Friday. The daily chart shows that it stopped Friday between the 20 and 50 day SMA. The RSI on the daily chart is moving sharply higher and the MACD is improving. On the weekly chart the RSI bounced hard off of the mid line but the MACD is diverging lower. Not unusual signs in a symmetrical triangle. The center of the triangle is a range between 95.50 and 97.30. Look for the TLT to have a short term bias to the upside but capped at the 97.30 area in the coming week. If it does get over 97.30 then a test of 102.50 is possible. Any move lower looks to find support at 93 and then the 8 year rising trend at 90.

Shanghai Stock Exchange Composite Weekly, $SSEC
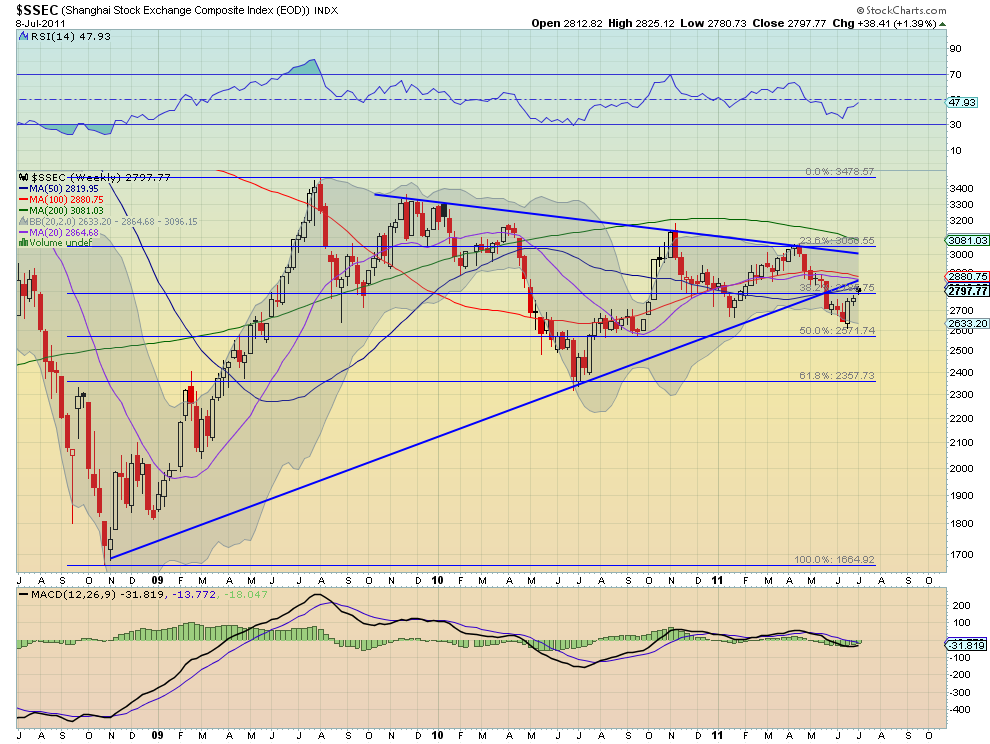
The Shanghai Composite continued in a tightening range this week on a move back toward the symmetrical triangle break down from May. The daily chart shows the RSI and MACD pointing to lower prices as it is in a bull flag near 2800 resistance. The weekly chart has a RSI that is rising and a MACD that is flat but moving back towards positive. The weekly chart takes precedence giving a short term bias for next week to the upside but with resistance very nearby at 2800 and through that the possibility to 2900. Pullbacks should be limited to the 2695-2700 area.
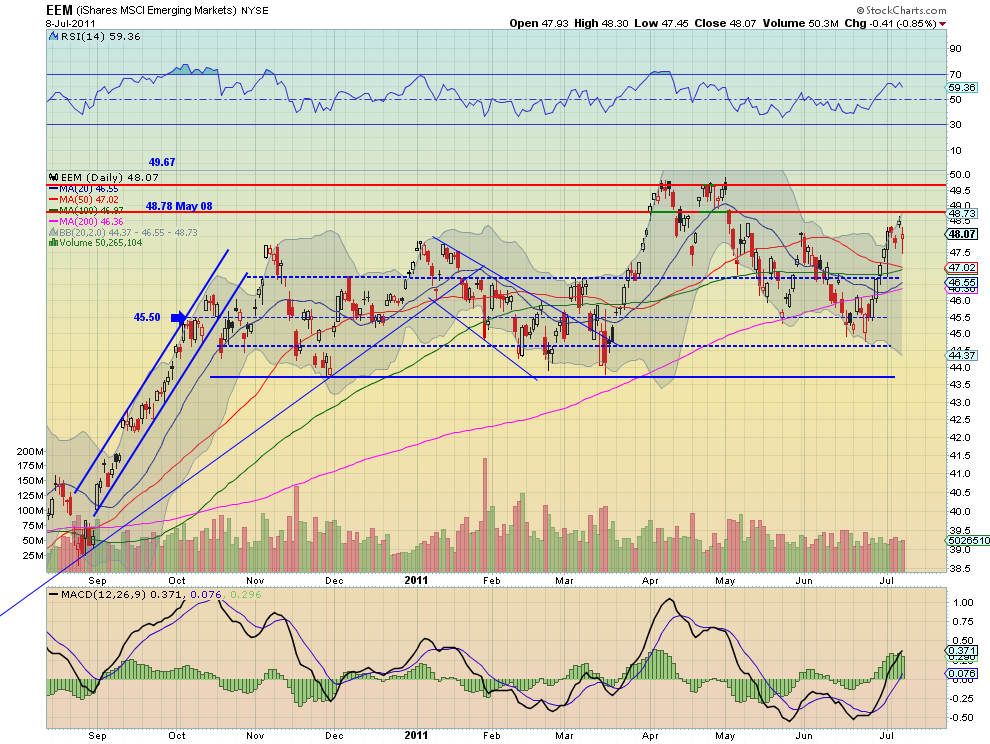
iShares MSCI Emerging Markets Index Weekly, $EEM
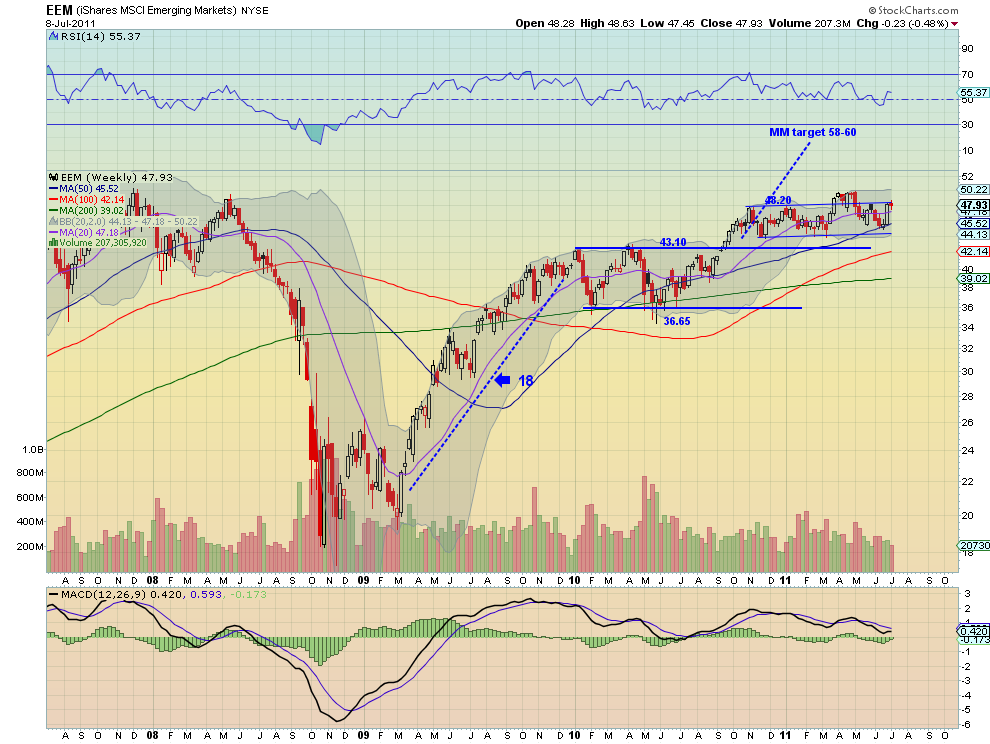
Emerging Markets, as measured by the ETF EEM, consolidated in a wide range this week. The daily chart shows the RSI topping and the MACD waning. The weekly chart shows the RSI leveling as price reaches the top of the channel but with the MACD improving. Again the weekly chart trumps and gives a bias to the upside. Look for a move above 48.78 next week to run to test 50. Failure would lead to pullback to support at 46.70.
VIX Weekly, $VIX
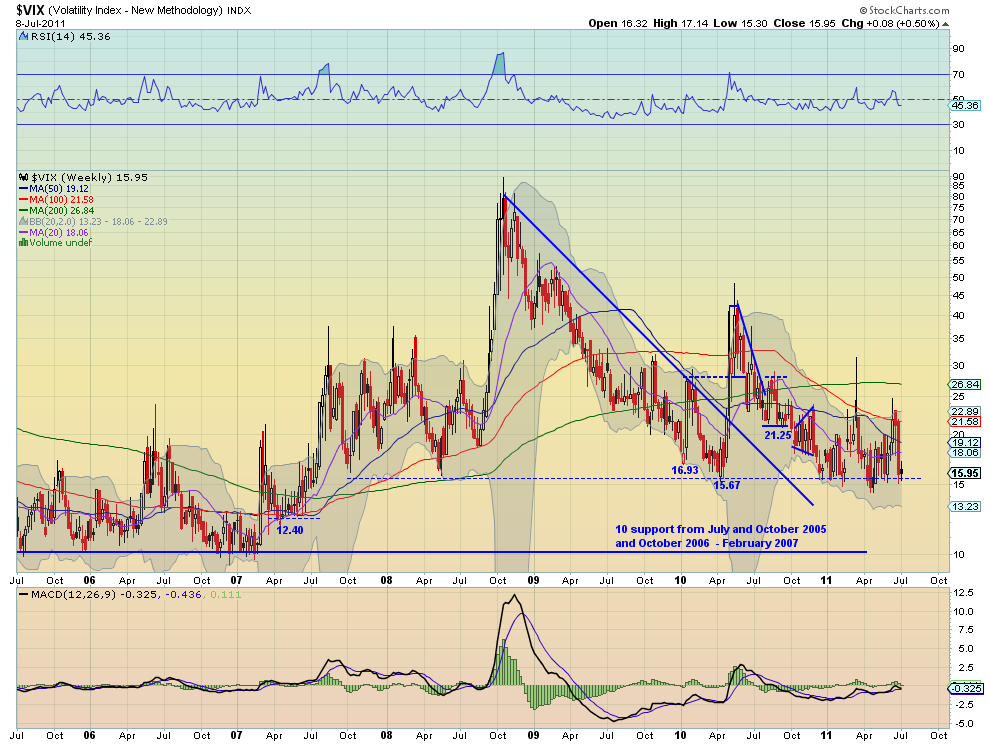
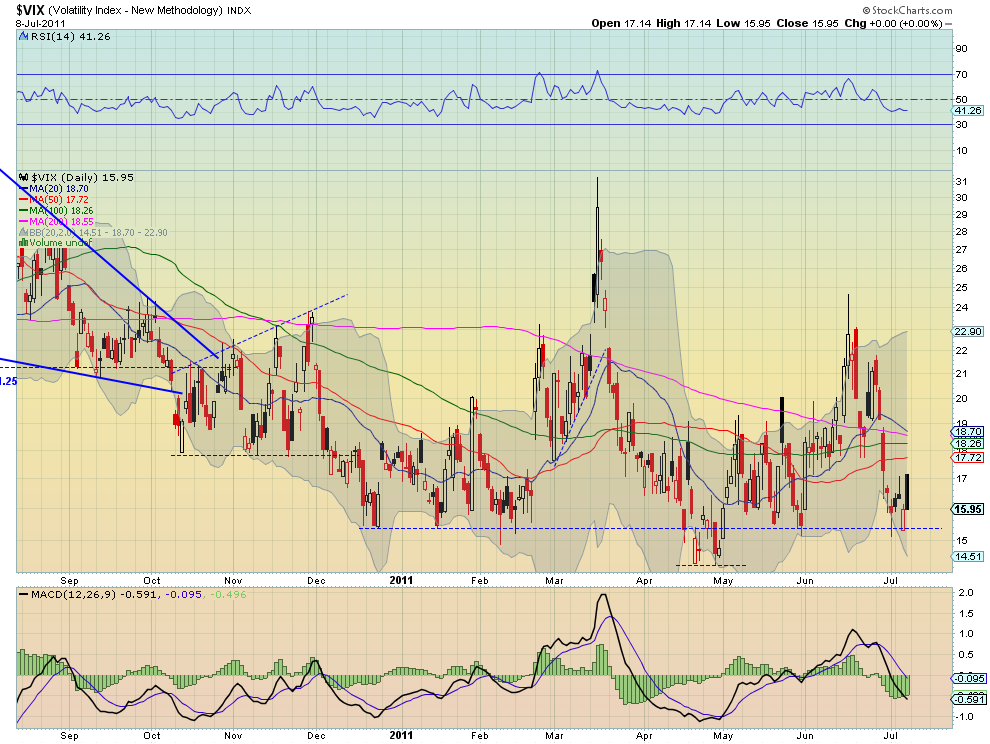
The Volatility Index settled lower for the week in a tighter and lower range finding support at 15.40 and not breaking far above 17. The weekly chart shows the RSI trending lower but but leveling, and the MACD starting to improve. The weekly chart shows support at 15.67 holding and a RSI and MACD that are hovering around the mid line and the zero line. Look for continued subdued volatility in the coming week within a range of 15.4 to 22.
SPY Weekly, $SPY

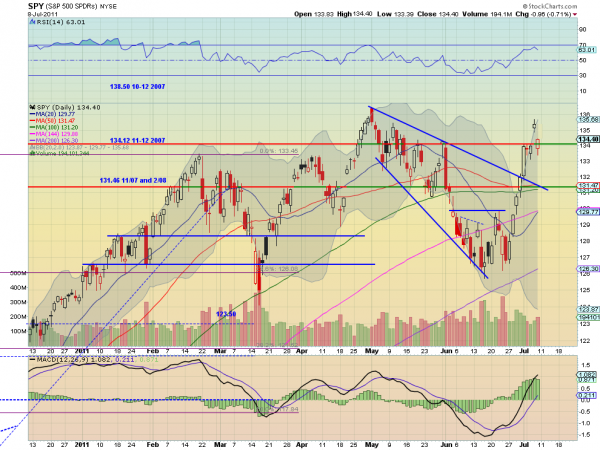
The SPY settled into a flag higher after pulling back from a gap higher on Thursday. The daily chart shows the RSI curling lower off of the 70 area with a MACD that is leveling and starting to move lower. Both suggest downside to come despite the positive price action. The weekly chart shows a move higher to retest the trend line from the March 2009 lows printing an evening star or spinning top. The shadows are in between. The RSI is moving higher and the MACD is improving towards a potential positive cross. The short term trend remains higher and expect more upside for the coming week with resistance at 135.5 and then 136.50. Any pullback should find some support at 131.46 and below that 130.
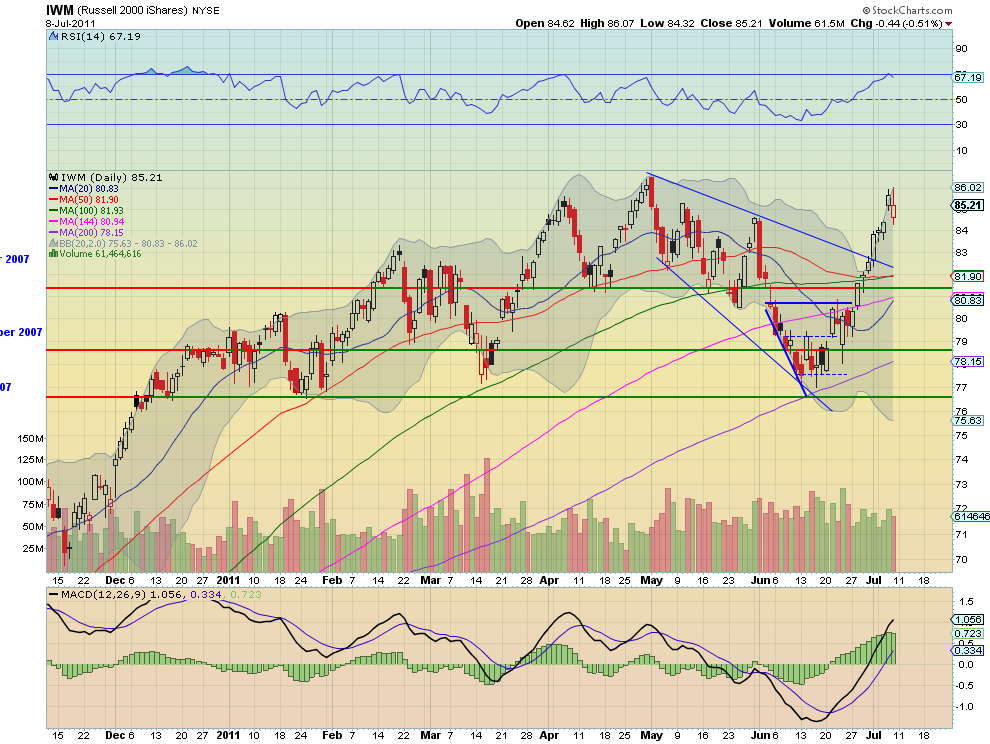
IWM Weekly, $IWM
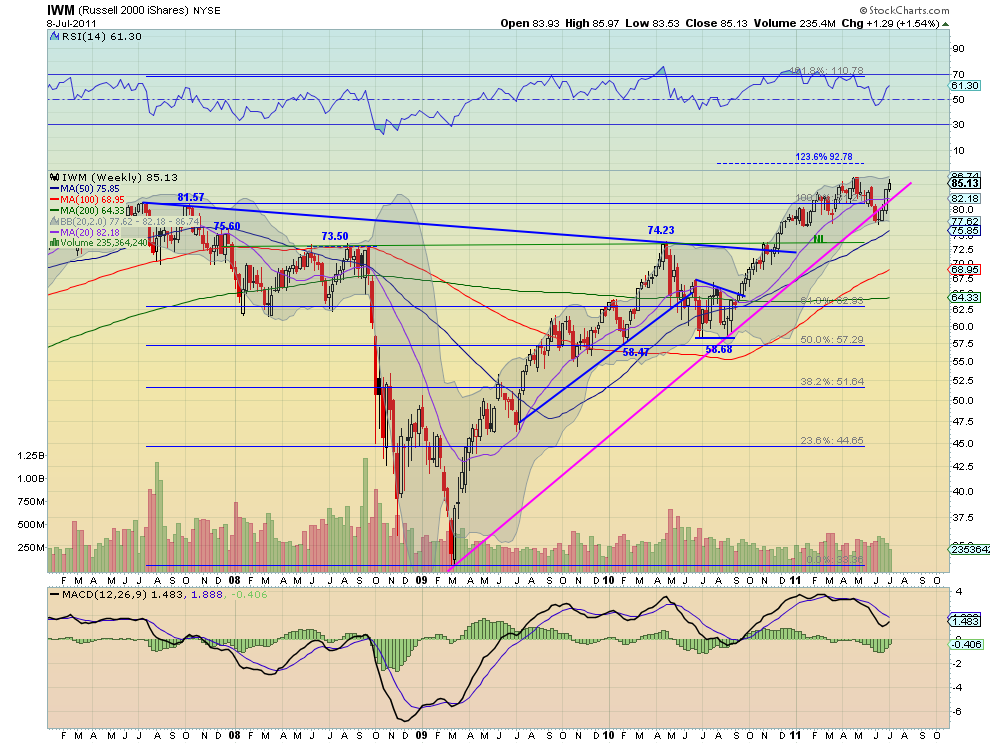
The IWM moved higher but pulled back from a gap higher on Thursday. The daily chart shows the RSI curling lower off of the 70 area with a MACD that is leveling and starting to move lower. Both suggest downside to come despite the positive price action. The weekly chart shows a move higher to retest the previous high but printing an evening star. The RSI is moving higher and the MACD is improving towards a potential positive cross. The short term trend remains higher and expect more upside for the coming week with resistance at 85.60 and then 86.55. Any pullback should find some support at 84.20 and below that 83.50 and 81.57.
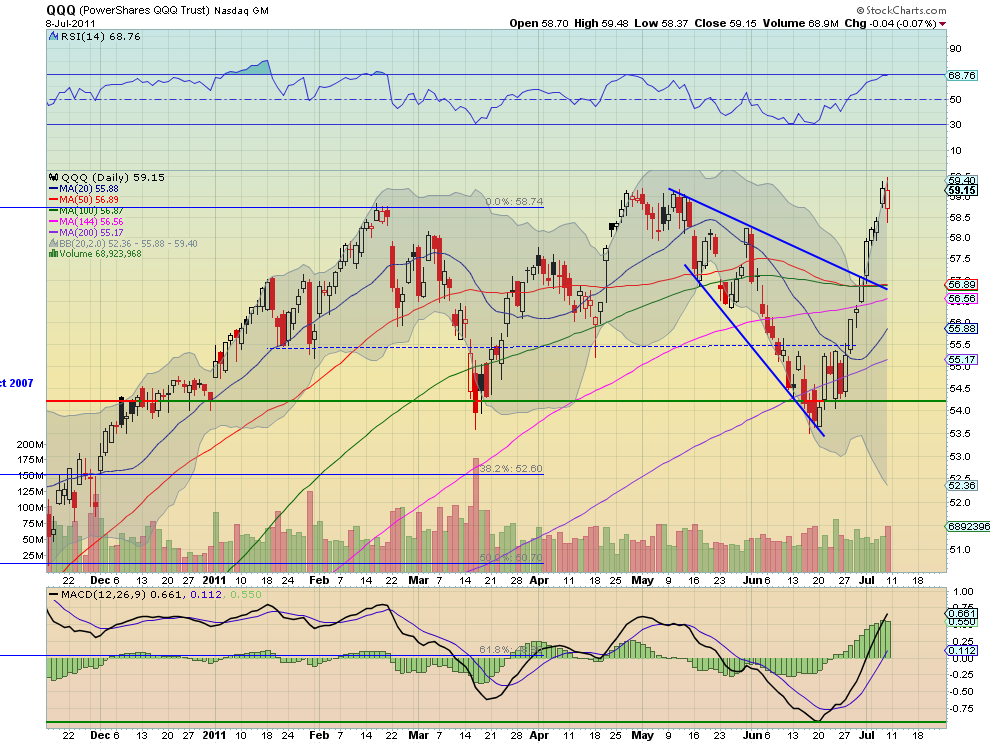
QQQ Weekly, $QQQ
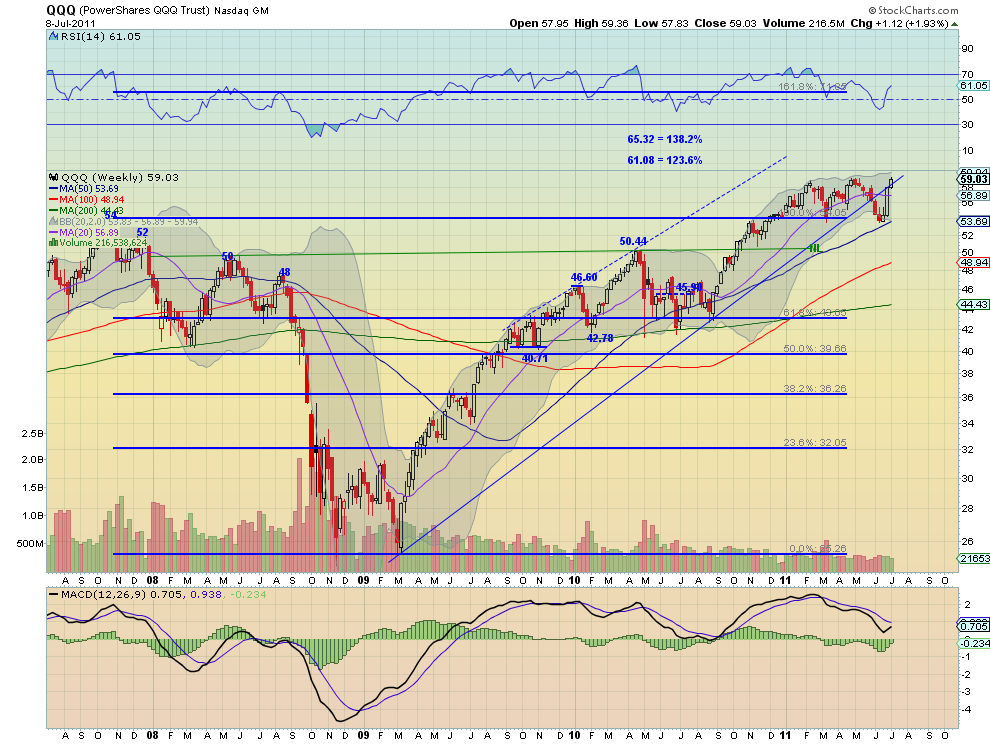
The QQQ moved higher but pulled back from a gap higher on Thursday. The daily chart shows the RSI leveling off of the 70 area with a MACD that is also leveling and starting to move lower. Both suggest downside to come despite the positive price action. The weekly chart shows a move higher above the trend line from the March 2009 lows but printing an evening star. The RSI is moving higher and the MACD is improving towards a potential positive cross. The short term trend remains higher and expect more upside for the coming week with resistance at 59.21 and then 60 and 61.08. Any pullback should find some support at 58 and below that 57.50 and 55.50.
The coming week looks for Gold and Crude Oil to both continue higher. The US Dollar Index and US Treasuries to move higher towards resistance at 77.30 and 97.30 respectively. The Shanghai Composite and Emerging Markets also are biased to the upside, although both have resistance nearby. Volatility looks to remain stable and subdued allowing for the Equity Index ETF’s SPY, IWM and QQQ to continue higher. But each are showing signs of a pullback in the short timeframe that could translate into the weekly timeframe quickly, with Treasuries moving higher as a possible catalyst. Look for upside but keep the stops tight. A reversal could come quickly. Use this information to understand the major trend and how it may be influenced as you prepare for the coming week ahead. Trade’m well.
No comments:
Post a Comment