The Holiday shortened week saw the first measurable pullback in the market since November. With the broad indexes recovering more than 50% of the losses by the end of the day Friday everyone was breathing a sigh of relief. The bull market can continue on to new highs. A look at the daily charts for the SPDR Sector funds gives the same conclusion. Each has a rising price trend, a Relative Strength Index (RSI) that has either bounced off of the low and is moving back higher off of the mid line or back to it, and a Moving Average Convergence Divergence (MACD) indicator that had moved lower but is leveling or improving. The two exceptions to this are the Energy Select Sector SPDR, XLE, which just keeps going up, and the Utilities Select Sector SPDR, XLU which remains in a downward channel. Time for the Champagne and Caviar.
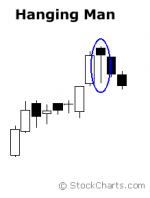
Unless you decide to look at the weekly charts. Oh, they are not signaling an imminent decline, but there are reasons for caution, the main culprit being the Hanging Man. The Hanging Man reversal candlestick pattern, shown below, shows up in 8 of the 9 SPDR Sector charts. It is not a one period pattern, meaning that it needs to be confirmed with a lower candlestick the following period to signal a reversal. But it does signal that there is a loss of momentum to the upward trend and the start of some selling pressure. In that way it makes sense to see them given the pullback this week.

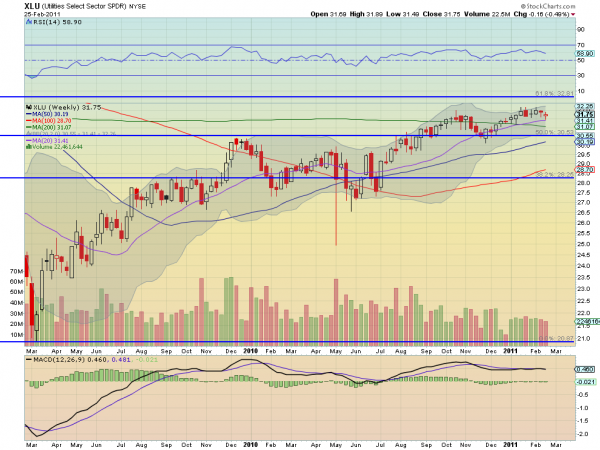
The worst example of this is exhibited by the XLU. A quick look at the chart below shows that XLU actually printed a Hanging Man candlestick two weeks ago and it was confirmed with a lower candlestick print this week. Coming after a nearly 2 year upward trend in the XLU it is something to pay attention to.
Utilities Select Sector SPDR, XLU

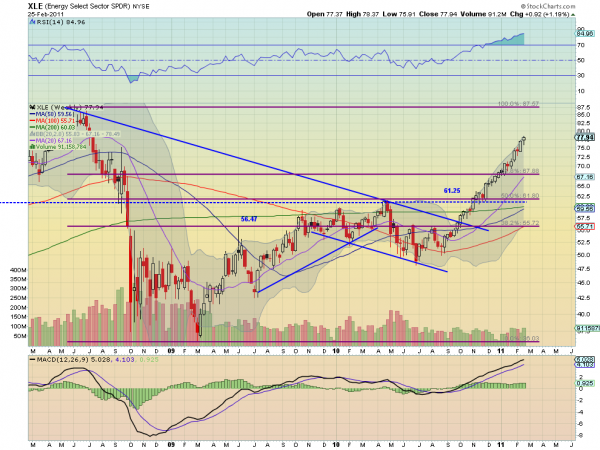
The seven other SPDR Sector funds that printed a Hanging Man this week include Materials, Energy, Financials, Industrials, Technology, Health Care and Consumer Discretionary (XLB, XLE, XLF, XLI, XLK, XLV, and XLY respectively). The weakest of these is in XLF as it has the shorted and least powerful trend higher. The Hanging Man candles for XLB, XLI, XLK, XLV, and XLY are more troublesome as their runs higher have lasted longer and been more powerful. All 6 of these candlesticks occurred below the high that was set the previous week. Because of that they are not as worrisome as the one in XLE, chart below.

Notice that the Hanging Man here occurred at new highs. This does not mean that XLE is going to head lower or that it has a greater chance of going lower than the other sectors. What is of interest is that there was selling pressure at the highs in a strong uptrend. The RSI at nearly 85 is another signal that corroborates the caution signal put out by the Hanging Man.
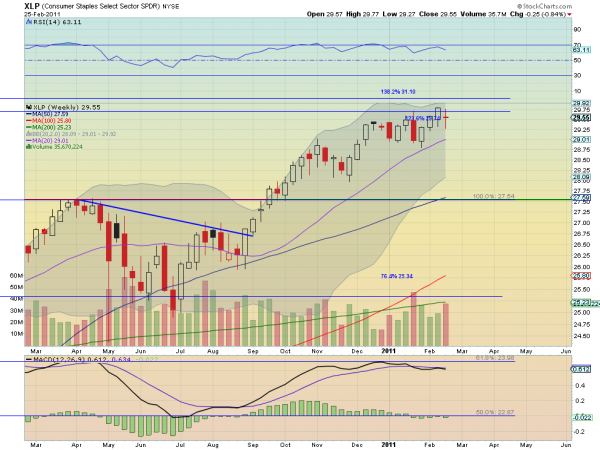
That leaves just Consumer Staples Sector SPDR, XLP, to discuss. There are caution flags here as well, just of a different variety. This chart printed a Long Legged Doji candlestick. This candlestick signals indecision as there was a lot of back and forth ending up virtually unchanged from where it started.
Indecision means uncertainty and therefore requires caution too, which is reinforced by the slightly falling RSI and slightly negative MACD.

So caution is warranted across all sectors despite the big rally on Friday. What should you do Monday? First put the Champagne and Caviar back on ice. Then look to protect your gains. Take some profits, buy some put protection or tighten your stops, if you have not already. The uptrend is not dead, but it did get caught up this week. Be prepared in case the noose tightens on the Hanging Men sending it lower.
No comments:
Post a Comment