Sometimes analyzing very short-term charts can be misleading. For example, an a-b-c formation often subdivides so that Wave a also is an a-b-c. That is what appears to have happened at yesterday’s close.
The hourly charts often show the most granularity, since they also show support and resistance, while smaller degree charts only show wave structure.
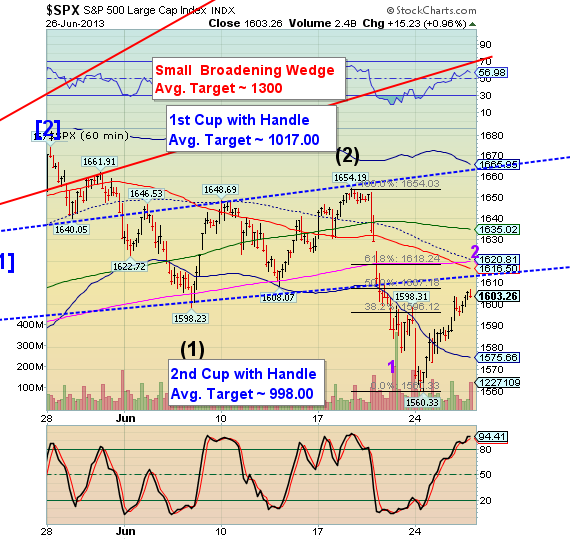
There are several resistance points that may offer a stopping place for this retracement. The first is the Lip of the Cup with Handle at 1613.00, followed by short-term resistance at 1616.50. The next set of resistances are the 50-day and mid-Cycle resistance, both currently at 1620.61.
Considering that the Pre-Market is up nearly 11 points, it appears that the upper resistance is the prime candidate for a reversal. The Cycles Model allows up to 24 hours on either side of the Pivot date, since in this case 4.3 X 14 = 120.4. So we may see a final spike up and a probable reversal sometime this morning.
There is a storm front moving through the area this morning, leaving us an unreliable power supply. I am still in northern Michigan for the rest of the day, but will be packing soon for the drive back home.
No comments:
Post a Comment