By Rohan Clarke
The Financial Crisis Observatory (here) publishes research that gravitates around a model proposed by Didier Sornette that suggests that bubbles follow a predictable pattern – and that their collapse can be forecast with reasonable accuracy.
The key insight of Didier and his comrades is that financial market prices tend to follow a power law as they accelerate into bubbles. Specifically, they fit a log periodic function to observed price movements to forecast the evolution of prices to a ‘singularity’ whereupon prices collapse.
I’ve been reading the pieces coming out of the observatory for a while. They appeal to my fatalistic nature, in addition to mirroring the trader’s wisdom that parabolic price rises tend to end in tears. (Note, I’d caution that forecasts can be subject to revision based on ‘new information’.)
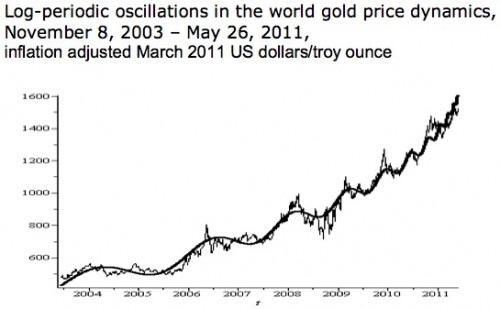
One of the latest papers, “The Second Wave of the Global Crisis” (published 3rd July), has a satisfyingly specific target for the end of the ‘gold price bubble’ – 27 July 2011 (here for the full piece). Following is a chart from the paper. The thick black line that sits over the gold price illustrates this price acceleration and the forecast terminal point:

“…the thin line indicates daily gold price between November 3, 2003 and May 26, 2011, whereas the smooth thick black line has been generated by the following version of equation (1) with parameters chosen by the least squares:
p(t) = 1978.2 – 734.8 (2011.573 – t)0.36 {1 + 0.024 cos[16.5 ln(2011.573 – t) – 36.3]}, (1b)
where p(t) is gold price at the moment t. Note that the quasisingularity moment (tC) here equals 2011,573, which corresponds to July 27 and suggests that the gold bubble should start collapsing before this date anyway.”
No comments:
Post a Comment